

-
Stock Pick Update: January 8 - January 14, 2020
January 8, 2020, 9:13 AMLet's check which stock could magnify S&P's gains in case it rallies, and which stocks would be likely to decline the most if S&P plunges. Here are our stock picks for the Wednesday, January 8 - Tuesday, January 14 period.
The Stock Pick Update for the Thursday, January 2 - Tuesday, January 7, 2020 period resulted in a modest loss of 0.09%. The S&P 500 index has lost 0.23% in the same period. Below we include statistics and the details of the previous updates. Only the updates for week-long periods ending on December 24 and January 7 are verified by the alert's release on our website, but before we decided to make it available to you, we tested our approach and our stock picks performed very well:
- Jan 7, 2020
Long Picks: GD, CHRW, CTL, CLX, CSCO
Short Picks: PM, ANSS, HST, JCI, EA
Average long result: -1.15%, average short result: 0.97
Total profit (average): -0.09%- Dec 24, 2019
Long Picks: VTR, CHRW, CF, IDXX, CINF
Short Picks: LLY, MS, AES, DRE, AME
Average long result: 1.12%, average short result: -1.31%
Total profit (average): -0.10%- Dec 17, 2019
Long Picks: WMT, FAST, SEE, ZTS, SLB
Short Picks: BMY, PSX, SST, LW, EMR
Average long result: 2.45%, average short result: -1.69%
Total profit (average): 0.38%- Dec 10, 2019
Long Picks: PSA, OXY, DE, ILMN, TTWO
Short Picks: ZTS, DIS, LW, WELL, PSX
Average long result: 0.87%, average short result: 1.30%
Total profit (average): 1.08%- Dec 03, 2019
Long Picks: PSA, EXC, FANG, ILMN, FLT
Short Picks: ABBV, NVDA, CHTR, WELL, AEP
Average long result: -0.03%, average short result: 1.55%
Total profit (average): 0.76%- Nov 26, 2019
Long Picks: VTR, YUM, HAL, ADI, CME
Short Picks: MSFT, JPM, ABT, WELL, LOW
Average long result: 1.89%, average short result: -0.50%
Total profit (average): 0.69%- Nov 19, 2019
Long Picks: PSA, DUK, EBAY, MMC, MMM
Short Picks: C, CAT, TXN, PLD, SO
Average long result: 1.08%, average short result: -1.50%
Total profit (average): -0.21%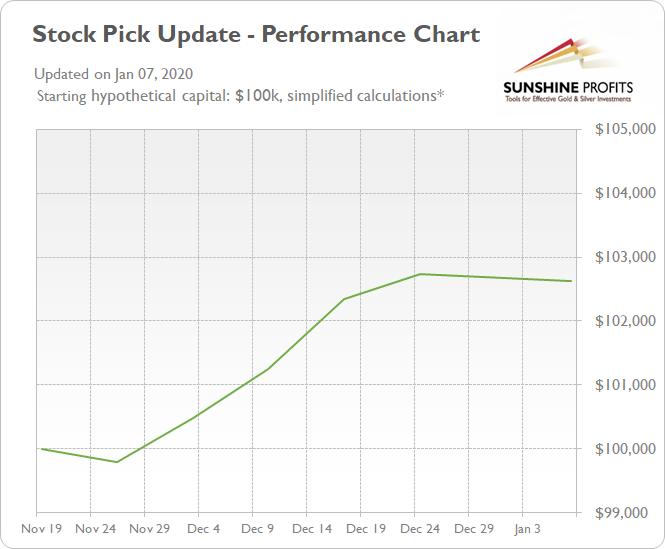
The broad stock market has reached historically high levels recently. Last year's breathtaking December correction was followed by the record-breaking comeback rally. The late October - early November breakout led to another leg higher, as the S&P 500 index broke above the 3,200 mark. But will the rally continue? If the market goes higher, which stocks are going to beat the index? And if it reverses down from here, which stocks are about to outperform on the short side?
We will provide stock trading ideas based on our in-depth technical and fundamental analysis, but since the main point of this publication is to provide the top 5 long and top 5 short candidates (our opinion, not an investment advice) for this week, we will focus solely on the technicals. The latter are simply more useful in case of short-term trades.
We will assume the following: the stocks will be bought or sold short on the opening of today's trading session (January 2) and sold or bought back on the closing of the next Tuesday's trading session (January 7).
First, we will take a look at the recent performance by sector. It may show us which sector is likely to perform best in the near future and which sector is likely to lag. Then, we will select our buy and sell stock picks.
There are eleven stock market sectors: Energy, Materials, Industrials, Consumer Discretionary, Consumer Staples, Health Care, Financials, Technology, Communications Services, Utilities and Real Estate. They are further divided into industries, but we will just stick with these main sectors of the stock market.
We will analyze them and their relative performance by looking at the Select Sector SPDR ETF's.
Let's start with our first charts (charts courtesy of www.stockcharts.com).
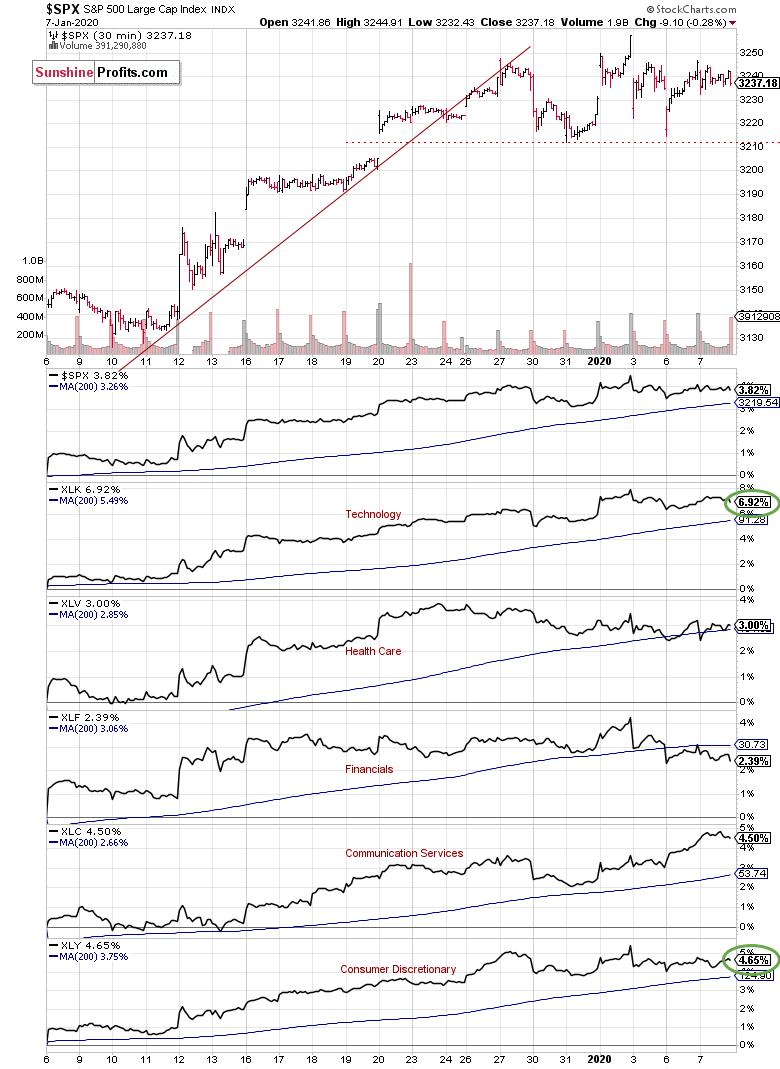
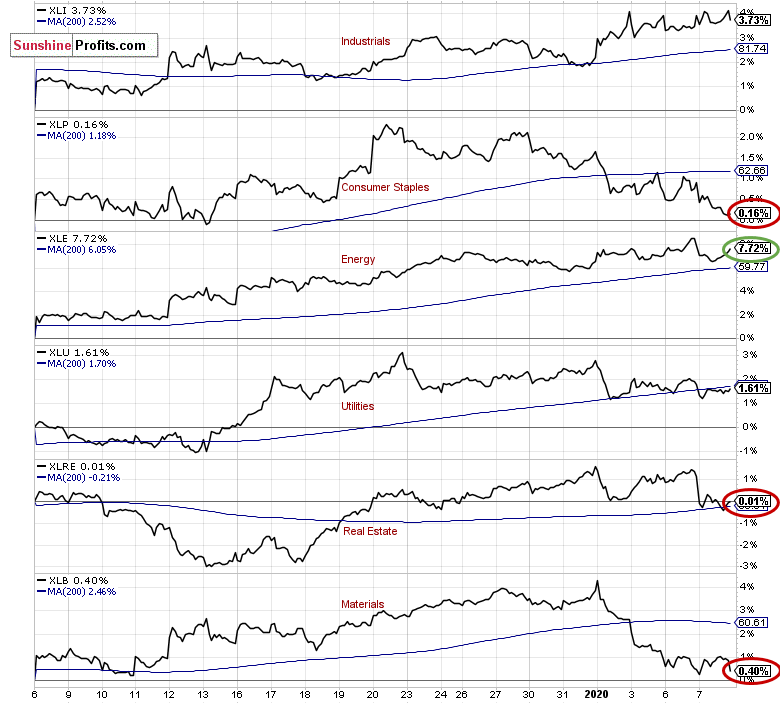
There's a S&P 500's 30-minute chart along with market sector indicators for the past month. The S&P 500 index has gained 3.82% since December 6. The strongest sector was Energy XLE, as it gained 7.72%. The Technology XLK gained 6.92% and the Consumer Discretionary XLY gained 4.65%.
On the other hand, the weakest sector was Real Estate XLRE, as it gained just 0.10%. The Consumer Staples XLP gained 0.16% and Materials XLB gained 0.40% in the last 30 days.
Based on the above, we decided to choose our stock picks for the next week. We will choose our top 3 long and top 3 short candidates using a contrarian approach, and top 2 long and top 2 short candidates using the trend-following approach:
Contrarian approach (betting against the recent trend):
- buys: 1 x Real Estate, 1 x Consumer Staples, 1 x Materials
- sells: 1 x Energy, 1 x Technology, 1 x Consumer Discretionary
Trend-following approach:
- buys: 1 x Energy, 1 x Technology
- sells: 1 x Real Estate, 1 x Consumer Staples
Contrarian approach
Top 3 Buy Candidates
VTR Ventas, Inc. - Real Estate
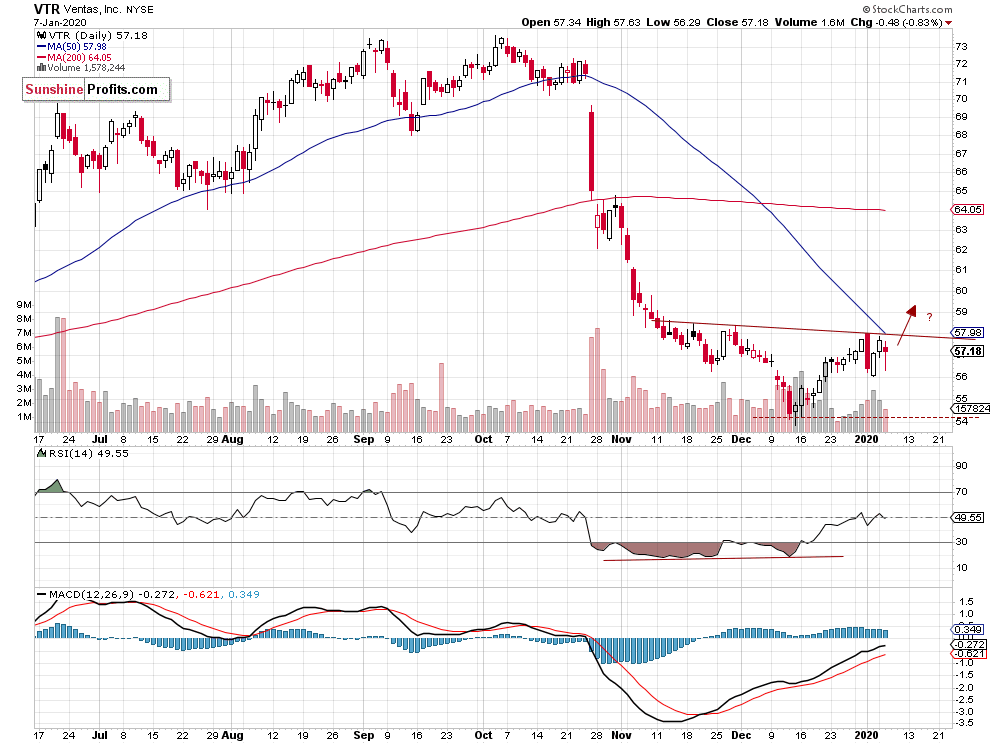
The VTR stock remains slightly below its two-month-long downward trend line. It may act as a neckline of the inverse head and shoulders pattern. If the price breaks above the line, we could see short-term advance towards the resistance level of $60-62.
COST Costco Wholesale Corp. - Consumer Staples
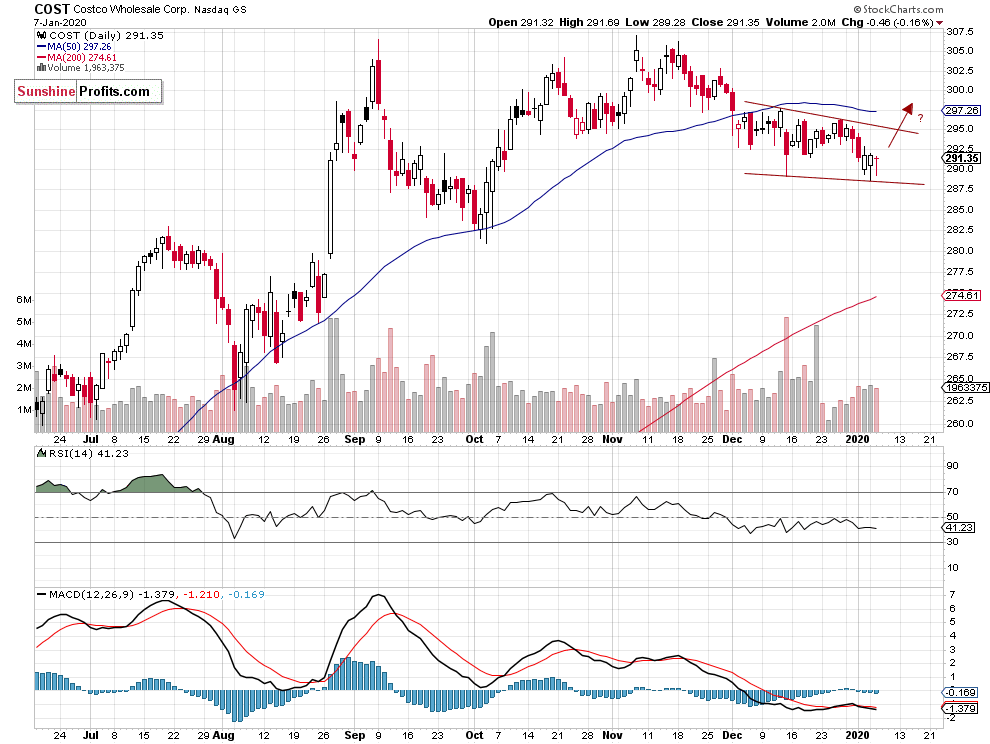
The Costco Wholesale Corp. stock continues to trade above the support level of $290. We could see an attempt at breaking above a potential falling wedge pattern. The resistance level is at around $295.
ECL Ecolab, Inc. - Materials
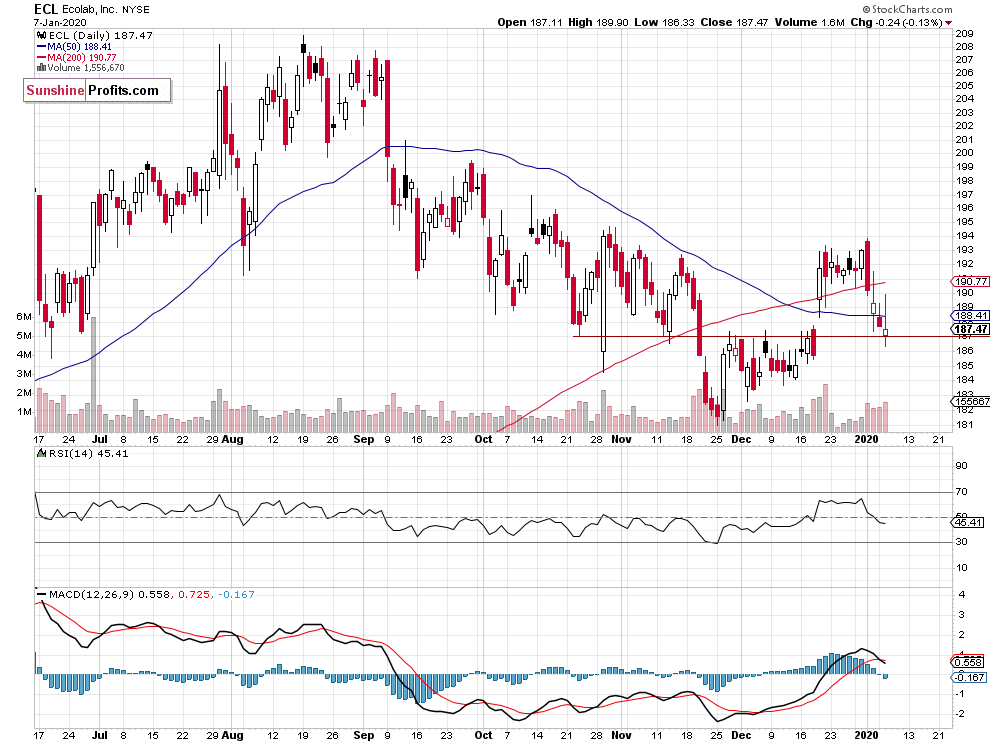
The stock retraced its mid-December advance and it is back at the support level of its previous consolidation. Therefore we may see an attempt at reversing short-term downtrend here.
We hope you enjoyed reading the above free analysis, and we encourage you to read today's Stock Pick Update - this analysis' full version. There, we include the remaining long and short stock picks for the next week. There's no risk in subscribing right away, because there's a 30-day money back guarantee for all our products, so we encourage you to subscribe today.
-
Stock Pick Update: January 2 - January 7, 2020
January 2, 2020, 9:35 AMLet's check which stock could magnify S&P's gains in case it rallies, and which stocks would be likely to decline the most if S&P plunges. Here are our stock picks for the Thursday, January 2 - Tuesday, January 7 period.
The Stock Pick Update for the December 18 - December 24, 2019 period resulted in a modest loss of 0.1%. Below we include statistics and the details of the previous updates. Only the above - mentioned update for a week-long period ending on December 24 is verified by the alert's release on our website, but before we decided to make it available to you, we tested our approach and our stock picks performed very well:
- Dec 24, 2019
Long Picks: VTR, CHRW, CF, IDXX, CINF
Short Picks: LLY, MS, AES, DRE, AME
Average long result: 1.12%, average short result: -1.31%
Total profit (average): -0.10%- Dec 17, 2019
Long Picks: WMT, FAST, SEE, ZTS, SLB
Short Picks: BMY, PSX, SST, LW, EMR
Average long result: 2.45%, average short result: -1.69%
Total profit (average): 0.38%- Dec 10, 2019
Long Picks: PSA, OXY, DE, ILMN, TTWO
Short Picks: ZTS, DIS, LW, WELL, PSX
Average long result: 0.87%, average short result: 1.30%
Total profit (average): 1.08%- Dec 03, 2019
Long Picks: PSA, EXC, FANG, ILMN, FLT
Short Picks: ABBV, NVDA, CHTR, WELL, AEP
Average long result: -0.03%, average short result: 1.55%
Total profit (average): 0.76%- Nov 26, 2019
Long Picks: VTR, YUM, HAL, ADI, CME
Short Picks: MSFT, JPM, ABT, WELL, LOW
Average long result: 1.89%, average short result: -0.50%
Total profit (average): 0.69%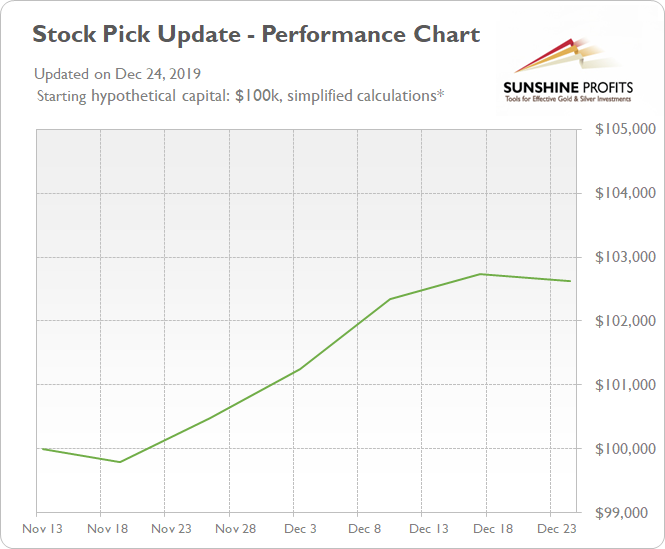
The broad stock market has reached historically high levels recently. Last year's breathtaking December correction was followed by the record-breaking comeback rally. The late October - early November breakout led to another leg higher, as the S&P 500 index broke above the 3,200 mark. But will the rally continue? If the market goes higher, which stocks are going to beat the index? And if it reverses down from here, which stocks are about to outperform on the short side?
We will provide stock trading ideas based on our in-depth technical and fundamental analysis, but since the main point of this publication is to provide the top 5 long and top 5 short candidates (our opinion, not an investment advice) for this week, we will focus solely on the technicals. The latter are simply more useful in case of short-term trades.
We will assume the following: the stocks will be bought or sold short on the opening of today's trading session (January 2) and sold or bought back on the closing of the next Tuesday's trading session (January 7).
First, we will take a look at the recent performance by sector. It may show us which sector is likely to perform best in the near future and which sector is likely to lag. Then, we will select our buy and sell stock picks.
There are eleven stock market sectors: Energy, Materials, Industrials, Consumer Discretionary, Consumer Staples, Health Care, Financials, Technology, Communications Services, Utilities and Real Estate. They are further divided into industries, but we will just stick with these main sectors of the stock market.
We will analyze them and their relative performance by looking at the Select Sector SPDR ETF's.
Let's start with our first charts (charts courtesy of www.stockcharts.com).
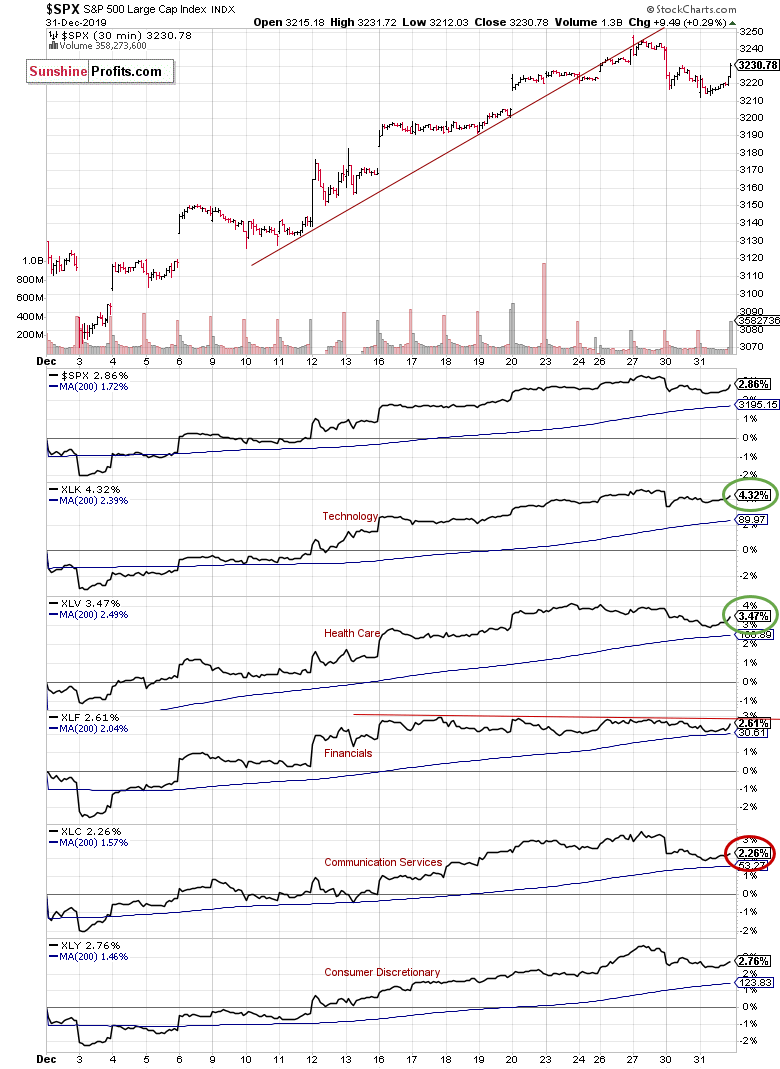
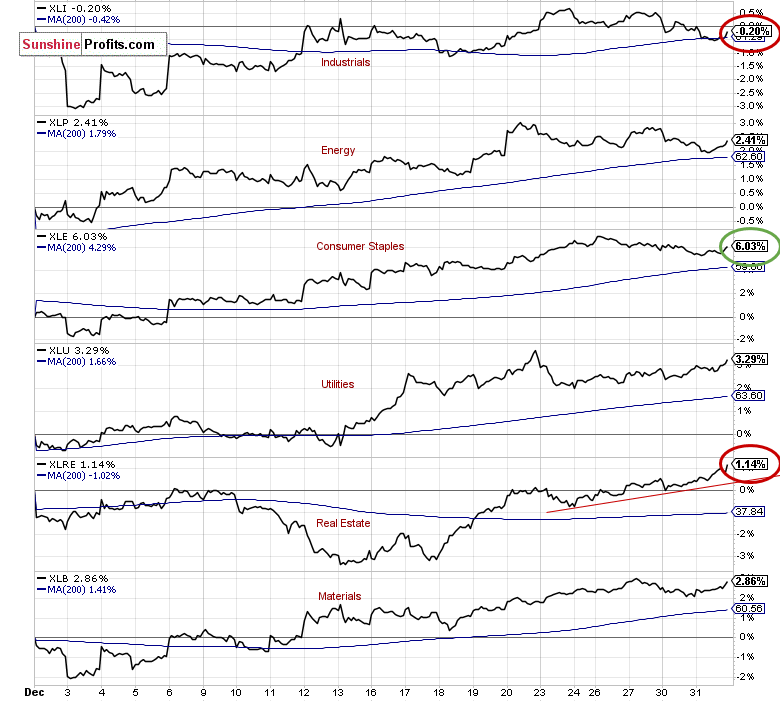
There's a S&P 500's 30-minute chart along with market sector indicators for the past month. The S&P 500 index has gained 2.86% since December 2. The strongest sector was Consumer Staples XLE, as it gained 6.03%. The Technology XLK gained 4.32% and the Health Care XLV gained 3.47%.
On the other hand, the weakest sector was Industrials XLI, as it lost 0.2%. The Real Estate XLRE gained just 1.14% and Communication Services XLC gained 2.26% in the last 30 days.
However, the Real Estate XLRE trades within a strongest short-term uptrend, and the Financials XLF is the weakest in the short-term
Based on the above, we decided to choose our stock picks for the next week. We will choose our top 3 long and top 3 short candidates using a contrarian approach, and top 2 long and top 2 short candidates using the trend-following approach:
Contrarian approach (betting against the recent trend):
- buys: 2 x Industrials, 1 x Communication Services
- sells: 1 x Consumer Staples, 1 x Technology, 1 x Real Estate
Trend-following approach:
- buys: 1 x Consumer Staples, 1 x Technology
- sells: 1 x Industrials, 1 x Communication Services
Contrarian approach
Top 3 Buy Candidates
GD General Dynamics Corp. - Industrials
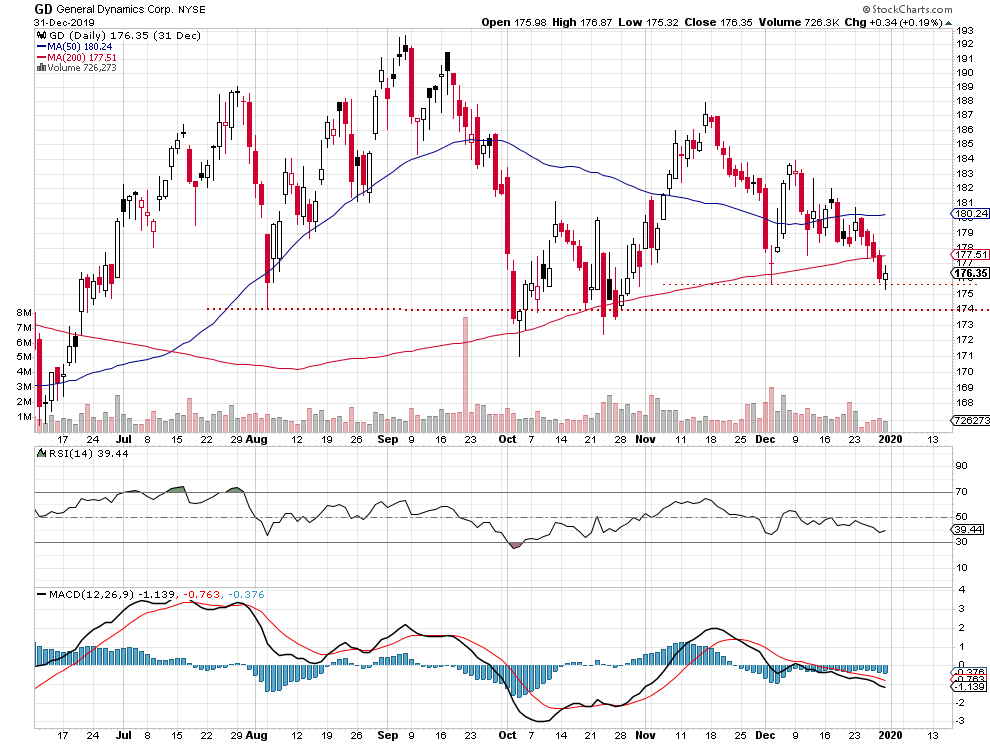
The GD stock trades at its early December local low. Furthermore, there is a potential support level at around $172-174, marked by October local lows. On the other hand, the resistance level is at $180.
CHRW C.H. Robinson Worldwide, Inc. - Industrials
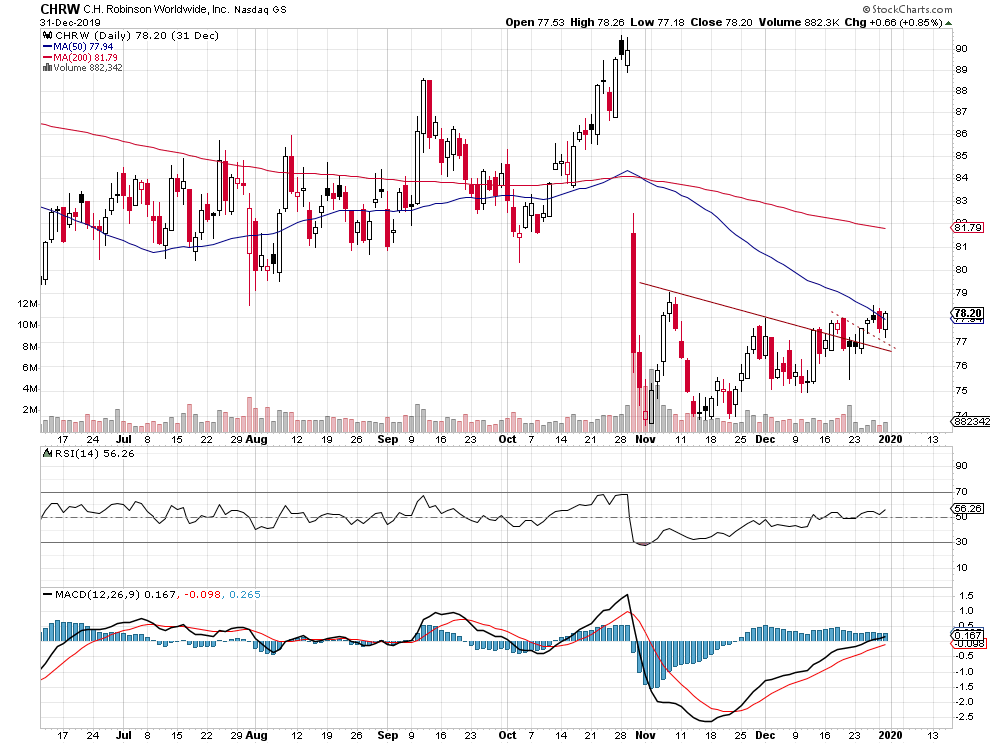
The C. H. Robinson Worldwide Inc. stock is our long pick again. The market broke above its month-long downward trend line recently. For now, it looks like a correction within a medium-term downtrend. However, we could see an attempt at retracing more of the late October sell-off.
CTL CenturyLink, Inc. - Communication Services
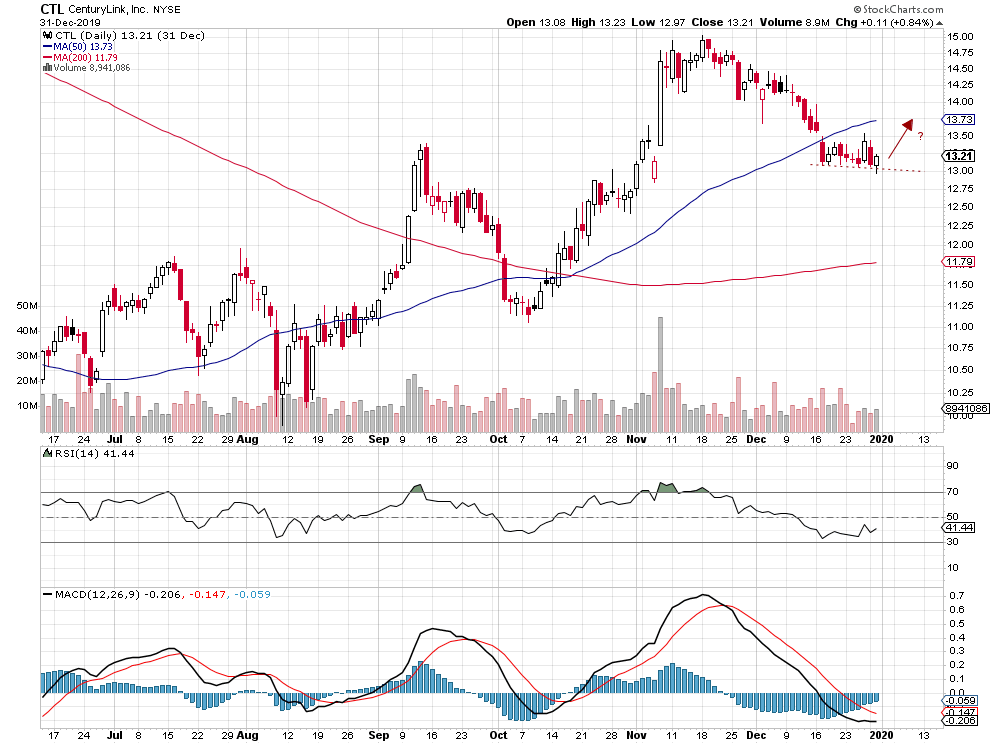
CTL stock remains within a short-term consolidation. The market is at September's local high that's acting as a support level. We may see an attempt at retracing some of the declines.
We hope you enjoyed reading the above free analysis, and we encourage you to read today's Stock Pick Update - this analysis' full version. There, we include the remaining long and short stock picks for the next week. There's no risk in subscribing right away, because there's a 30-day money back guarantee for all our products, so we encourage you to subscribe today.
-
Stock Pick Update: December 18 - December 24, 2019
December 18, 2019, 9:20 AMStarting this moment, we will be publishing the weekly Stock Pick Updates. It will be released each Wednesday and the top 5 long and top 5 short candidates for a week-long stock trading will be included (our opinion regarding their risk to reward potential). Without further ado, let's check which stock could magnify S&P's gains in case it rallies, and which stocks would be likely to decline the most if S&P plunges.
The broad stock market has reached historically high levels recently. Last year's breathtaking December correction was followed by the record-breaking comeback rally. The late October - early November breakout led to another leg higher, as the S&P 500 index got close to the 3,200 mark. But will the rally continue? If the market goes higher, which stocks are going to beat the index? And if it reverses down from here, which stocks are about to outperform on the short side?
We will provide stock trading ideas based on our in-depth technical and fundamental analysis, but since the main point of this publication is to provide the top 5 long and top 5 short candidates (our opinion, not an investment advice) for this week, we will focus solely on the technicals. The latter are simply more useful in case of short-term trades.
We will assume the following: the stocks will be bought or sold short on the opening of today's trading session (December 18th) and sold or bought back on the closing of the next Tuesday's trading session (December 24th).
First, we will take a look at the recent performance by sector. It may show us which sector is likely to perform best in the near future and which sector is likely to lag. Then, we will select our buy and sell stock picks.
There are eleven stock market sectors: Energy, Materials, Industrials, Consumer Discretionary, Consumer Staples, Health Care, Financials, Technology, Communications Services, Utilities and Real Estate. They are further divided into industries, but we will just stick with these main sectors of the stock market.
We will analyze them and their relative performance by looking at the Select Sector SPDR ETF's.
Let's start with our first charts (charts courtesy of www.stockcharts.com).
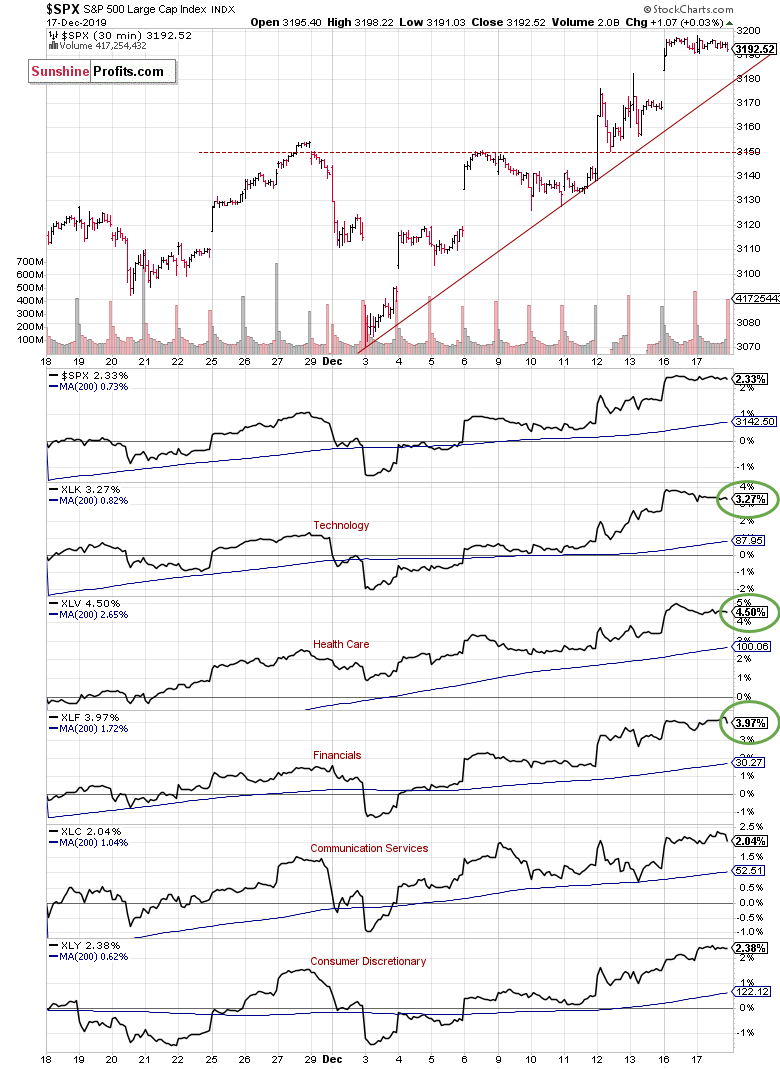
There's the S&P 500's 30-minute chart along with market sector indicators for the past month. The strongest sector was Health Care XLV index, as it gained 4.50% since November 18th. The Financials XLF gained 3.97% and Technology XLK gained 3.27%.
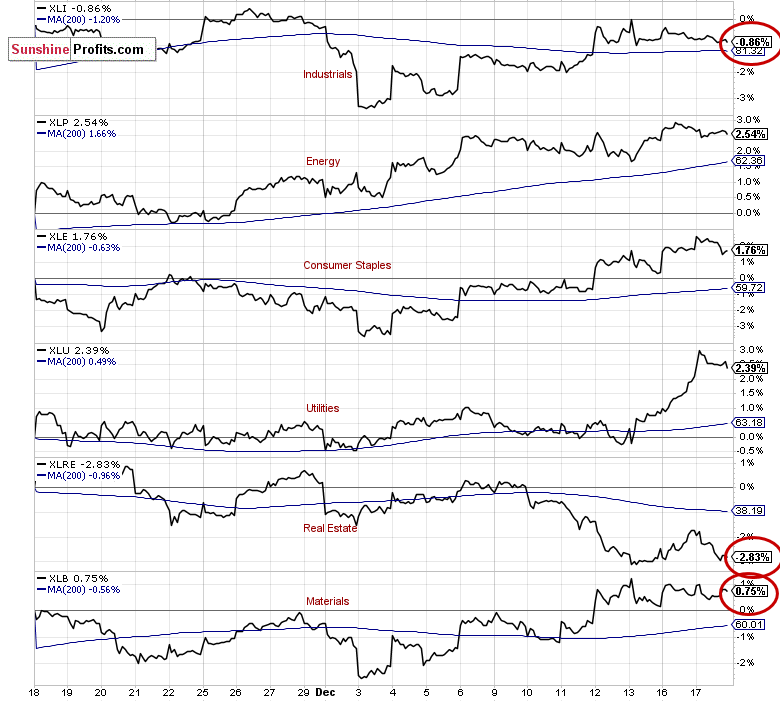
On the other hand, the weakest sector was Real Estate XLRE, as it lost 2.83%. The Industrials XLI lost 0.86%, and Materials XLB gained just 0.75% in the last 30 days.
Furthermore, the Utilities XLU index remains within a strongest short-term uptrend.
Based on the above, we decided to choose our stock picks for the next week. We will choose our top 3 long and top 3 short candidates using a contrarian approach, and top 2 long and top 2 short candidates using the trend-following approach:
Contrarian approach (betting against the recent trend):
- buys: 1 x Real Estate, 1 x Industrials, 1 x Materials
- sells: 1 x Health Care, 1 x Financials, 1 x Utilities
Trend-following approach:
- buys: 1 x Health Care, 1 x Financials
- sells: 1 x Real Estate, 1 x Industrials
Contrarian approach
Top 3 Buy Candidates
Ventas, Inc. - Real Estate
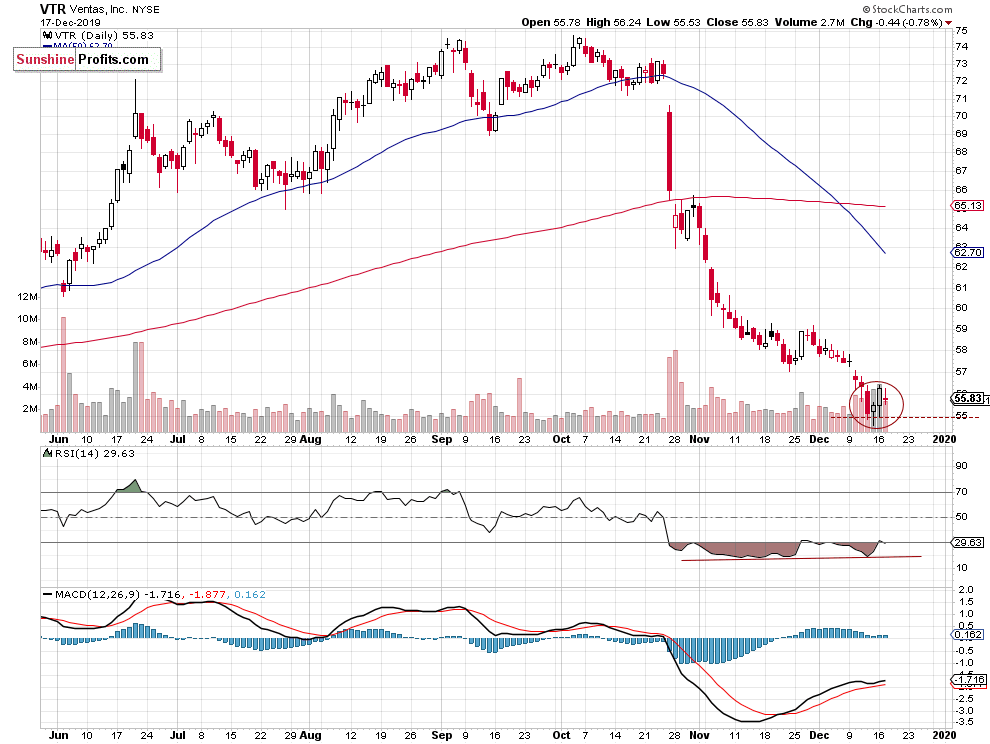
The VTR stock accelerated its over one-month-long downtrend last week, as it broke below the recent local low of around $57. But we can see a potential bottoming pattern along with positive technical divergences. The short-term support level remains at $55.
C. H. Robinson Worldwide, Inc. - Industrials
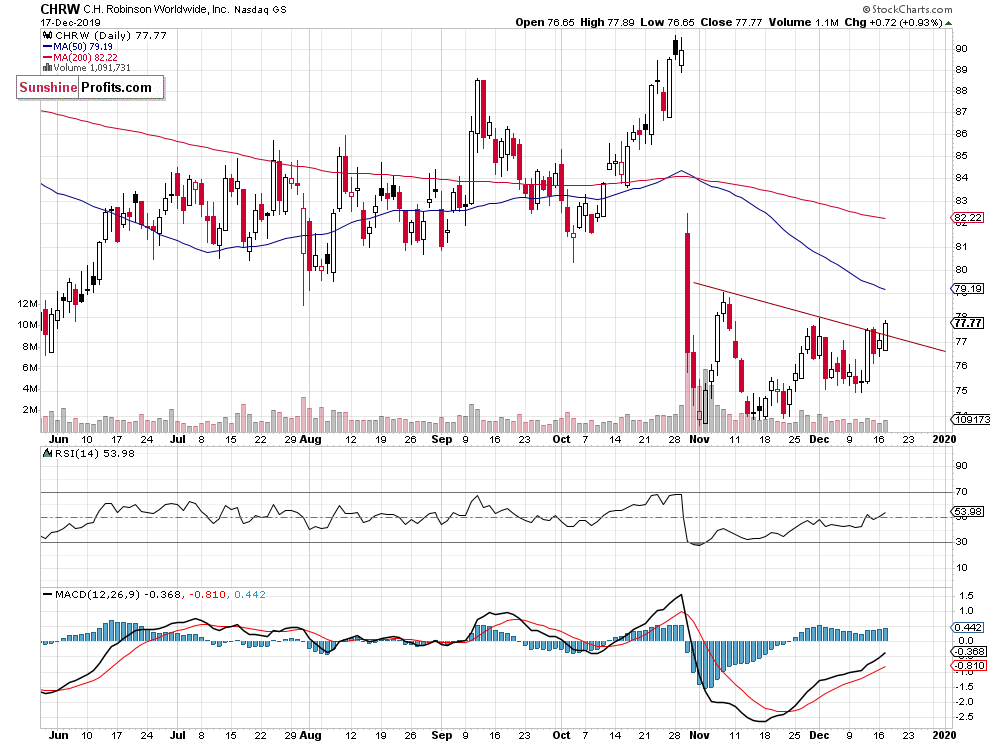
Here we can see the C. H. Robinson Worldwide Inc. stock breaking above the month-long downward trend line. The market may retrace some of its late October sell-off. It makes a pretty good contrarian buy.
CF Industries Holdings, Inc. - Materials
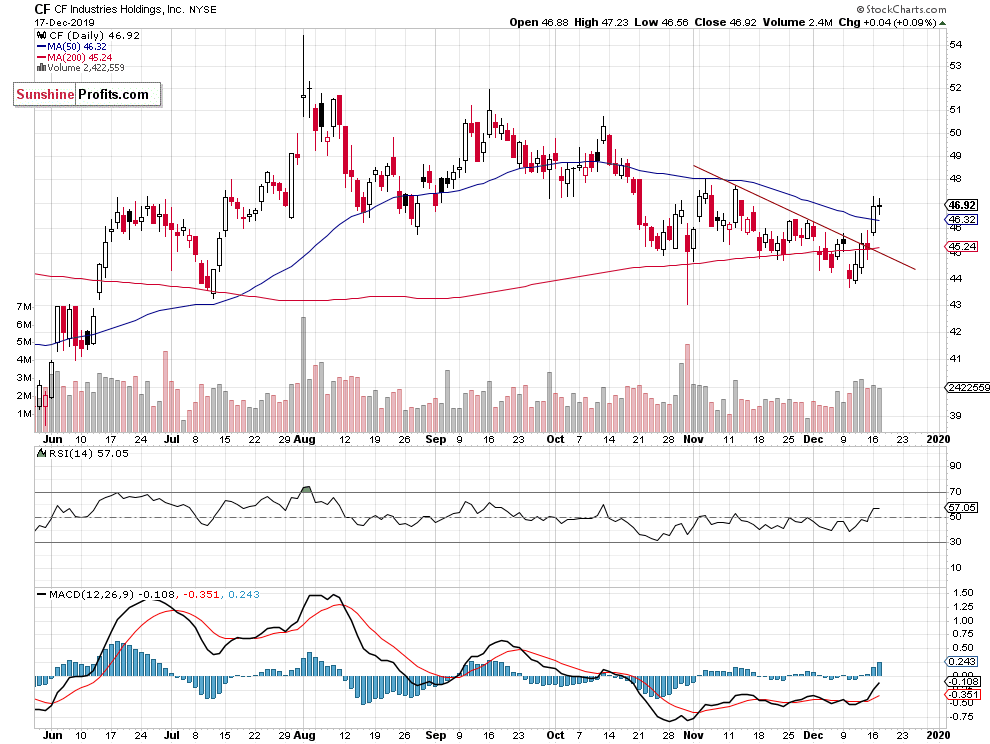
CF is another stock that broke above an over one-month-long downward trend line. Will it extend its short-term uptrend and gain from today's open to the next Tuesday's close? It could break above the nearest important resistance level of around $47.
Top 3 Sell Candidates
Eli Lilly & Co. - Health Care
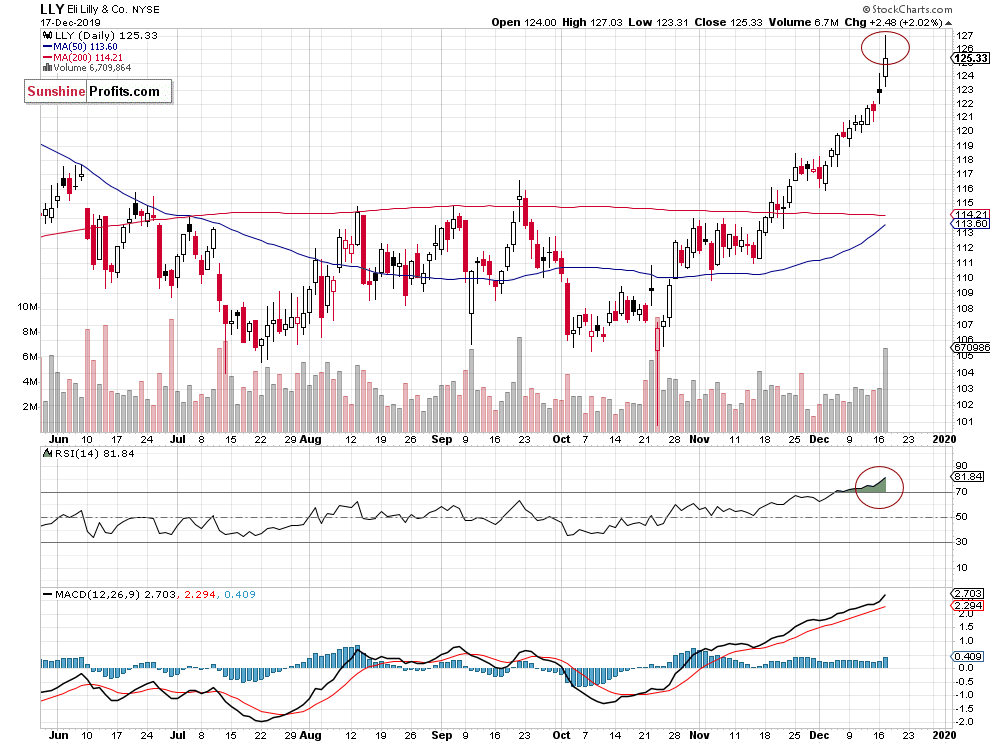
The LLY stock accelerated its uptrend this week following breaking above the resistance level of around $120-122. However, the market may retrace some of that rally. We can see technical overbought conditions that may lead to a short-term downward correction.
Morgan Stanley - Financials
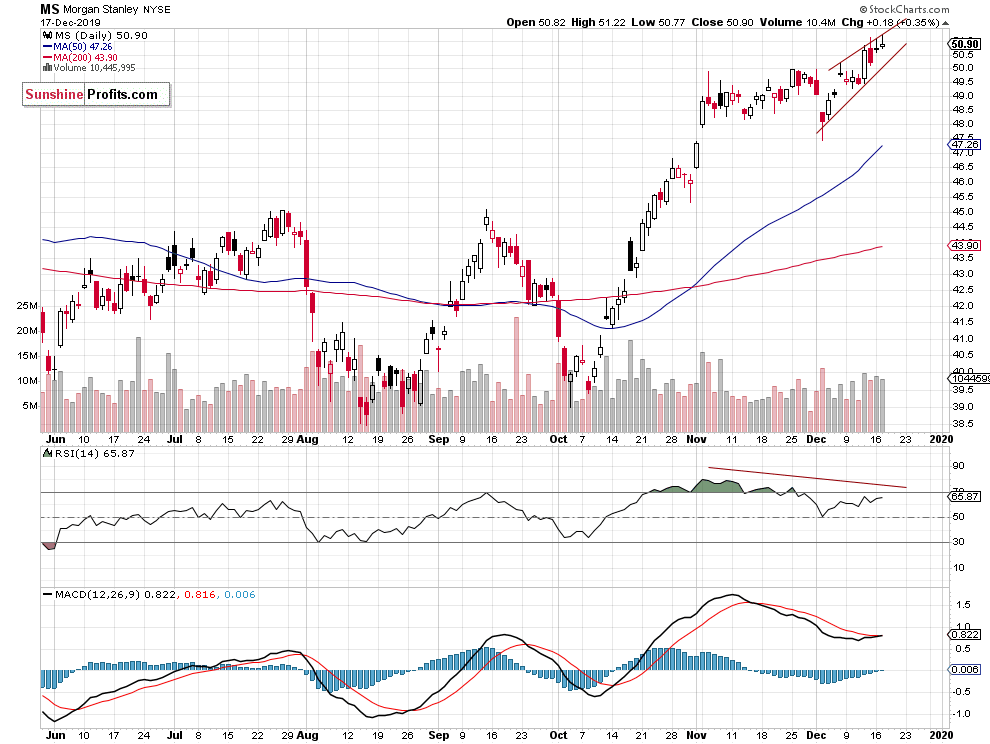
The MS chart shows a potential rising wedge topping pattern. There are also some clear negative technical divergences. The stock may retrace some of its recent advance and give a profit on the short side in the coming week.
AES Corp. - Utilities
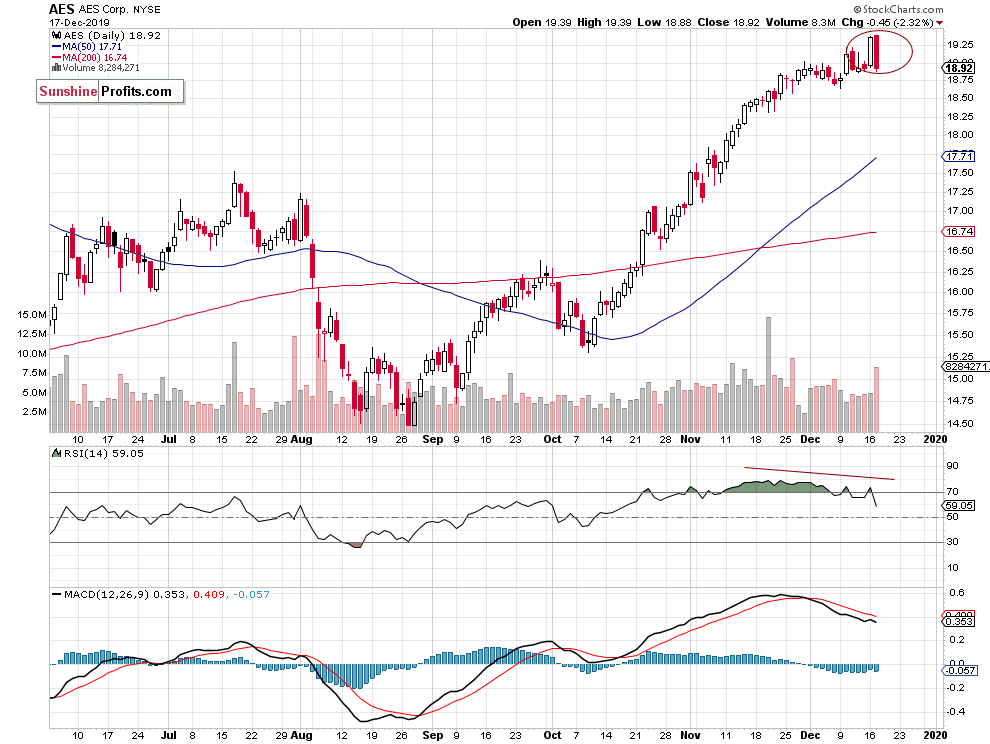
And here is another potential topping pattern. The AES Corp. stock keeps bouncing off the $19 resistance level recently. First, it formed a dark cloud cover candlestick pattern, then a bearish engulfing. We can also see negative technical divergences.
Trend-following approach
Top 2 Buy Candidates
IDEXX Laboratories, Inc. - Health Care
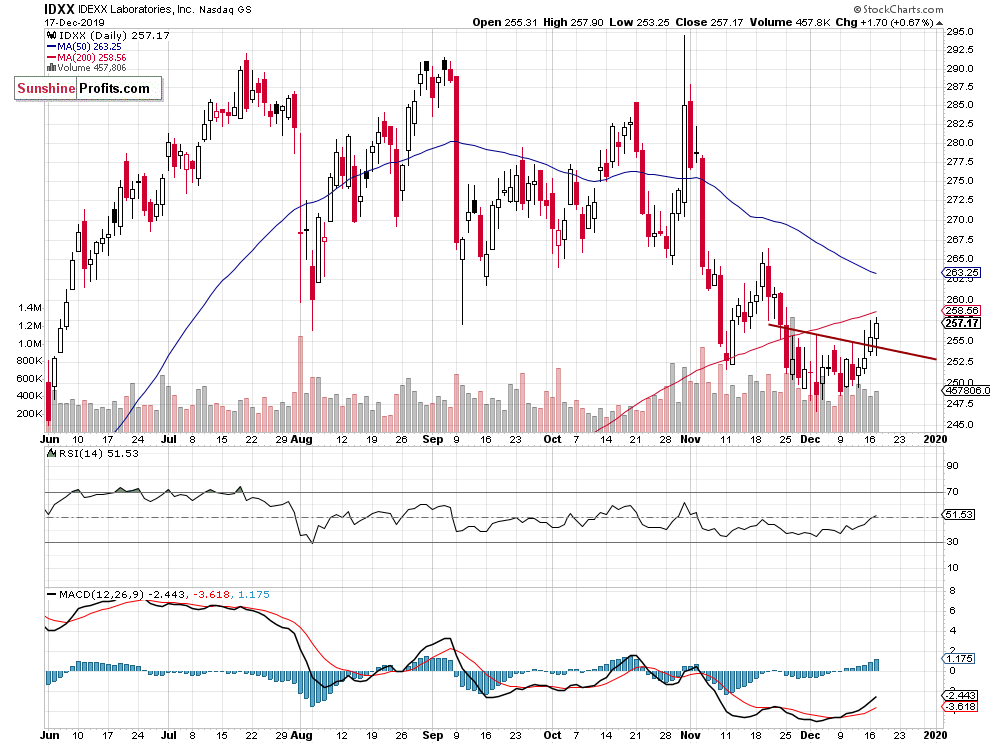
The IDXX stock broke above its weeks-long downward trend line. It may extend its short-term uptrend and retrace more of the late November decline. Will it reach a potential resistance level of around $265? We still can see some short-term bullish momentum.
Cincinnati Financial Corp. - Financials
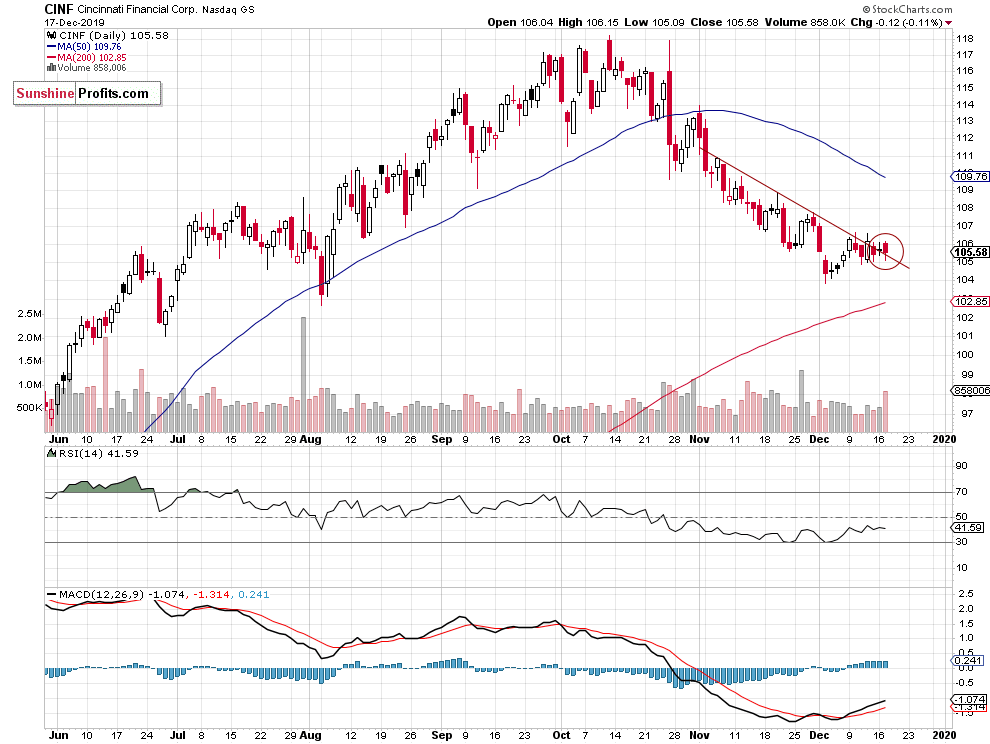
Here, we can see a breakout attempt above an over one-month-long downward trend line. The Cincinnati Financial Corp. stock may retrace some of its October-November decline. The nearest important resistance level is at $109-110.
Top 2 Sell Candidates
Duke Realty Corp. - Real Estate
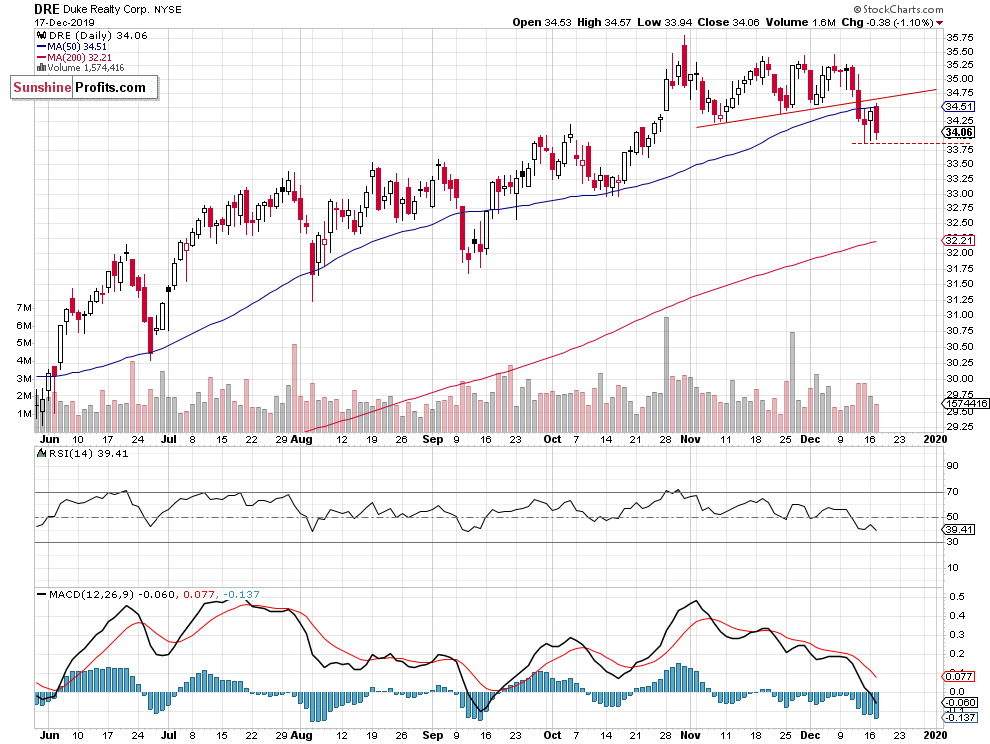
The DRE stock broke below its one-month-long upward trend line last week. For now, it keeps bouncing off a short-term support level at around $33.80-34.00, but it will likely extend the downtrend and give a profit on the short-side.
Ametek, Inc. - Industrials
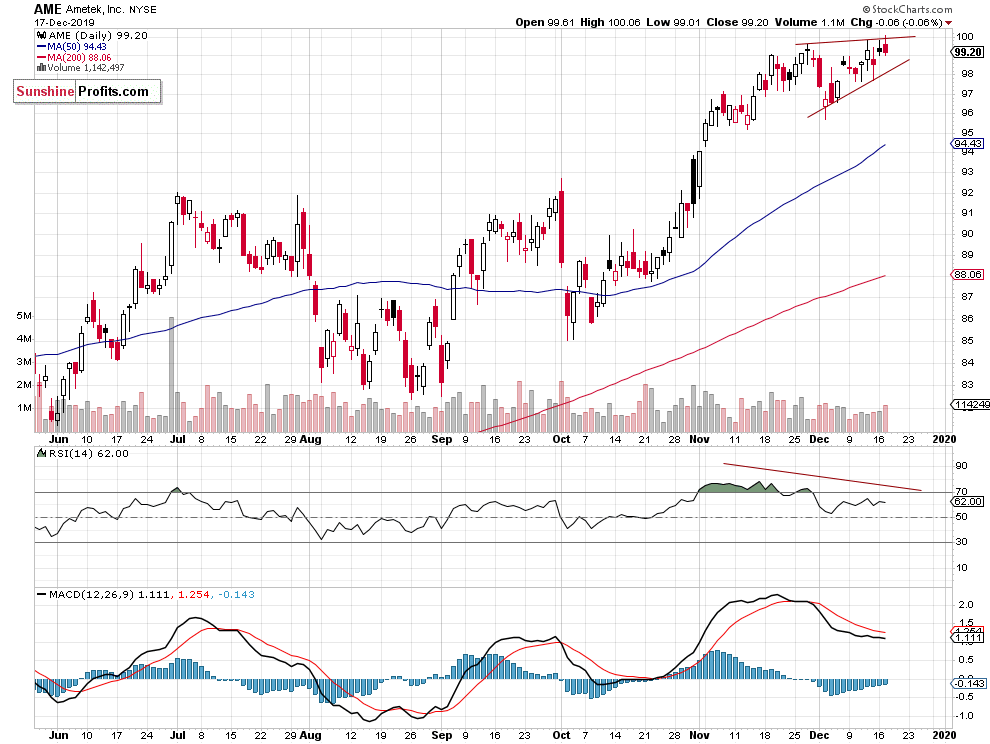
The AME stock trades within a potential rising wedge topping pattern. We can also see negative technical divergences. There have been no confirmed negative signals so far. However, it seems that the stock may bounce off the $100 resistance level and retrace some of its recent advances.
Conclusion
In our opinion, the following stock trades are justified from the risk/reward point of view between December 18 and December 24th:
Long: VTR, CHRW, CF, IDXX, CINF
Short: LLY, MS, AES, DRE, AME
Thank you.
Paul Rejczak
Stock Trading Strategist
Sunshine Profits - Effective Investments through Diligence and Care* * * * *
Disclaimer
All essays, research and information found above represent analyses and opinions of Paul Rejczak and Sunshine Profits' associates only. As such, it may prove wrong and be a subject to change without notice. Opinions and analyses were based on data available to authors of respective essays at the time of writing. Although the information provided above is based on careful research and sources that are believed to be accurate, Paul Rejczak and his associates do not guarantee the accuracy or thoroughness of the data or information reported. The opinions published above are neither an offer nor a recommendation to purchase or sell any securities. Mr. Rejczak is not a Registered Securities Advisor. By reading Paul Rejczak's reports you fully agree that he will not be held responsible or liable for any decisions you make regarding any information provided in these reports. Investing, trading and speculation in any financial markets may involve high risk of loss. Paul Rejczak, Sunshine Profits' employees and affiliates as well as members of their families may have a short or long position in any securities, including those mentioned in any of the reports or essays, and may make additional purchases and/or sales of those securities without notice.
Free Daily Newsletter
Delivered To Your Inbox
Free Of Charge
Bonus: Day Trading Signals, Gold & Silver, Oil, Forex Trading Alerts
Gold Alerts
More-
Status
New 2024 Lows in Miners, New Highs in The USD Index
January 17, 2024, 12:19 PM -
Status
Soaring USD is SO Unsurprising – And SO Full of Implications
January 16, 2024, 8:40 AM -
Status
Rare Opportunity in Rare Earth Minerals?
January 15, 2024, 2:06 PM

