

Briefly: outlook for the stock market is bearish in the short-term, then sideways for the following weeks and months.
Welcome to this week’s Stock Investment Update. Its purpose is to lay out what has happened in the S&P 500 over the previous week, and examine the prospects of upcoming moves.
Thursday's bullish run into the closing bell evaporated faster than you could say Jack Robinson. On the heels of the Amazon (AMZN) earnings disappointment, stocks slid during the overnight session, opening subdued across the board. The glimmer of hope offered by stronger than expected ISM Manufacturing PMI data proved short-lived, and gave us an opportune entry point to exit the prior long position on better terms, and simultaneously open the new and immediately profitable short position.
S&P 500 in the Medium- and Short-Run
We'll start this week's flagship Stock Trading Alert with the weekly chart (charts courtesy of http://stockcharts.com ):
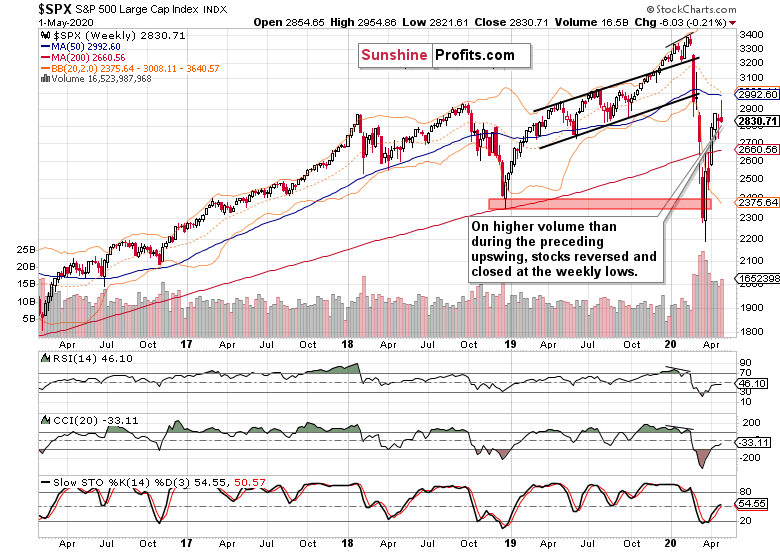
The long upper knot shows how far the rally has reached over the week, almost touching the 50-week moving average. However, prices reversed sharply lower, and did so on higher volume than was the case throughout the preceding upswing. That's a bearish omen.
Let's check the daily chart to see how the story of decelerating weekly indicators is most likely to proceed.
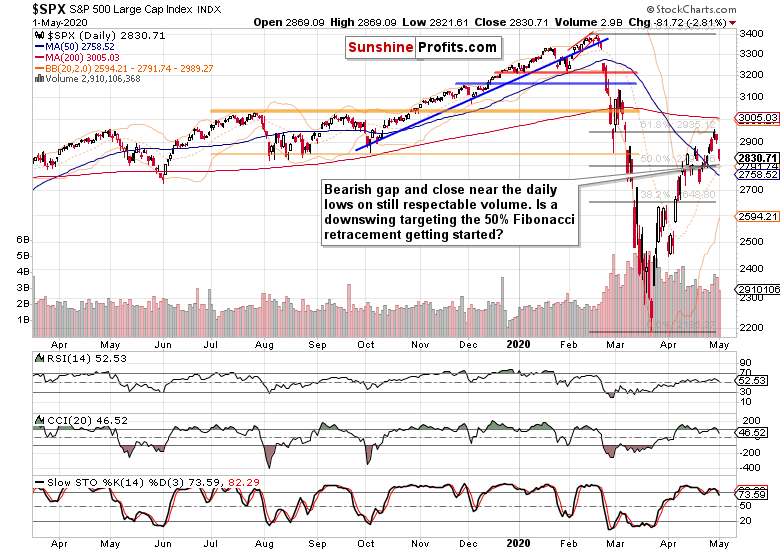
The sizable bearish gap at the open drove prices lower in the following hours regardless of the positive manufacturing surprise. It's true that Friday's volume has been lower than that of Thursday's reversal with the comeback attempt to the 61.8% Fibonacci retracement. Does that mean the downswing is running out of steam?
In all likelihood, the lower volume just shows that a larger move is underway, and that the bulls don't find the setup interesting enough to step in and buy with conviction. Similarly the bears don't find it a good time or place to get out of their positions just yet.
As the daily indicators are overwhelmingly in accord with the downtrend's chances to continue, which areas could prove an obstacle for the sellers?
The 50% Fibonacci retracement at around 2790 is the closest at hand, but we don't expect it to be overly strong at stopping the bears. Depending on the momentum and time it gets to reach, the 2750-2720 area might prove stronger. This is the area marked by the 50-day moving average on its upper end and previous local lows on the lower end.
Depending on the technical signals we get along the way, we'll be able to better assess how far the downswing could go, and make appropriate trading decisions.
With that in mind, let's check the debt markets.
The Credit Markets' Point of View
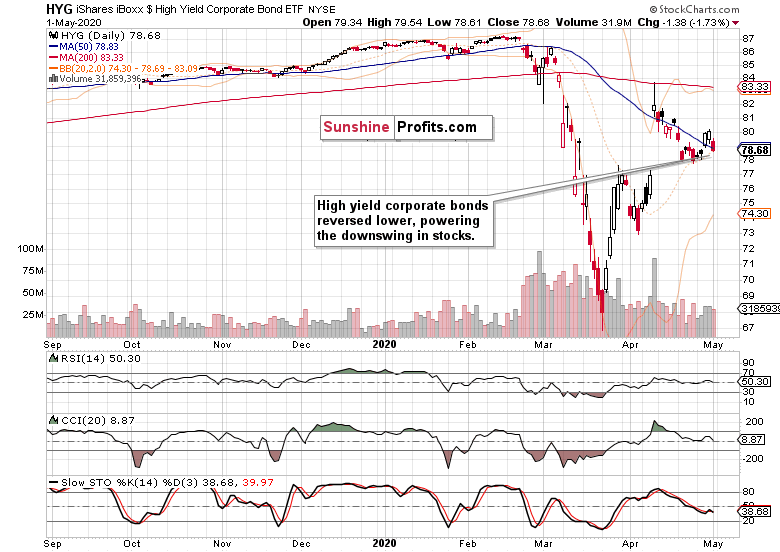
High yield corporate debt turned lower, in unison with the declining stocks. And so did its ratio to short-term Treasuries (HYG:SHY). Is the message from investment grade corporate bonds (LQD ETF) any better?
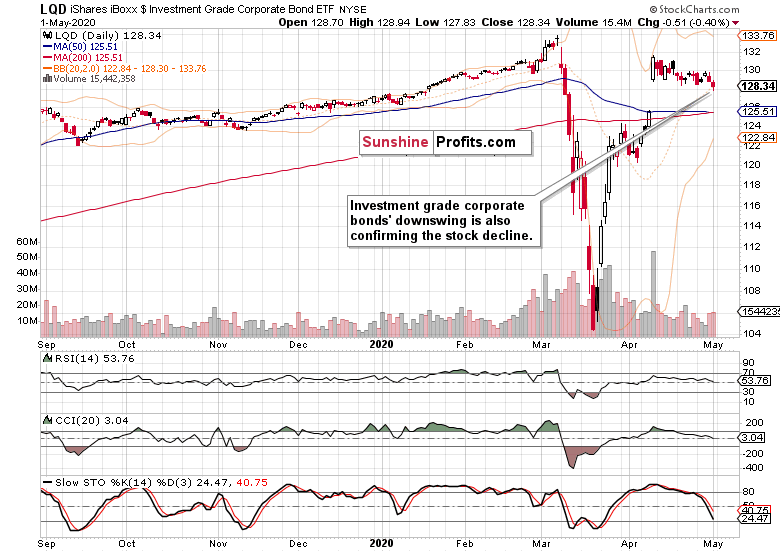
Not really, and this better-rated corner of the corporate debt world, is actually leading the downside move. And again, so is its ratio to the longer-dated Treasuries (LQD:IEI).
Unless both ETFs' moves lower are reversed, the credit markets aren't really on the bulls' side right now.
Key S&P 500 Sectors in Focus
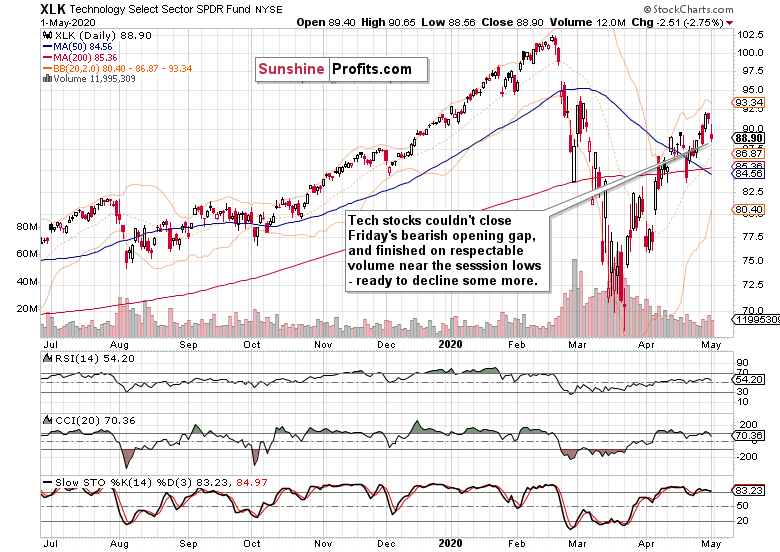
The tech sector tried hard to erase the opening losses, but just could close Friday's gap. Just as the S&P 500, it closed near its lows on respectable volume, giving the coming move lower a pretty good chance of continuing. The daily indicators are rolling over to the downside, supporting the downswing.
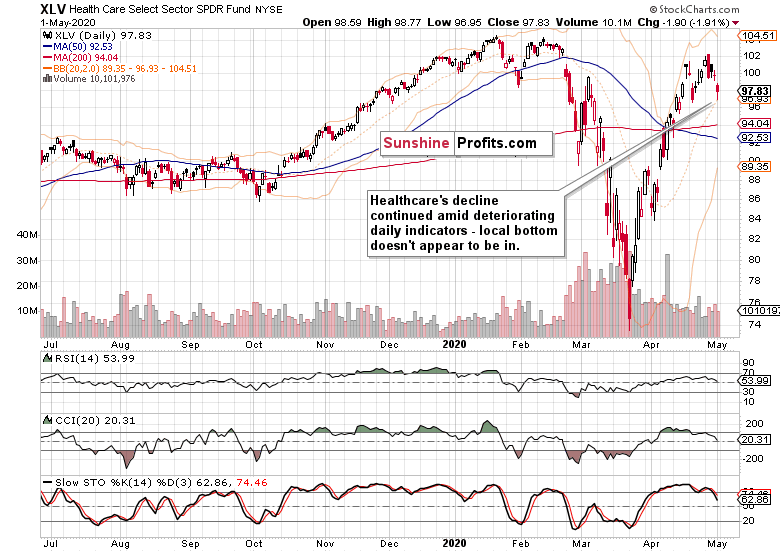
Healthcare mirrors the action in tech quite well, with the exception of an attempt to close Friday's bearish gap. As this was near to nonexistent in this sector, it subtly speaks in favor of more downside to come - just as the daily indicators' sell signals do.
As the credit markets' standing has deteriorated, how much was it reflected in the financials?
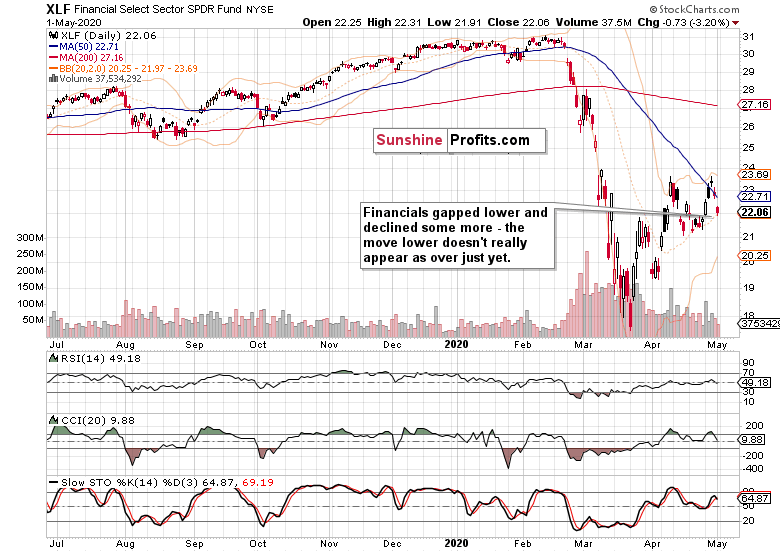
The financials' outperformance is over, and the sector has moved steeply lower. Thanks to the position of the daily indicators, the downswing has a good chance to continue as well.
Next, we'll examine the stealth bull market trio of sectors that are supposed to lead the index higher, if we are in a bull market, that is. So, let's check energy (XLE ETF), materials (XLB ETF) and industrials (XLI ETF).
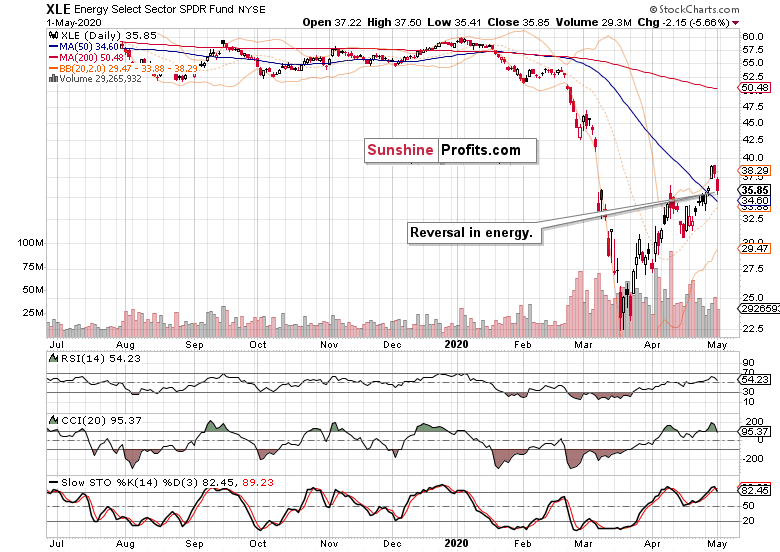
Energy clearly reversed, and its relative strength (or lack thereof) as we see the S&P 500 going lower, will be an important signal in assessing the health of the decline and prospects for upside reversal. For now, there's been no sign of strength on Friday.
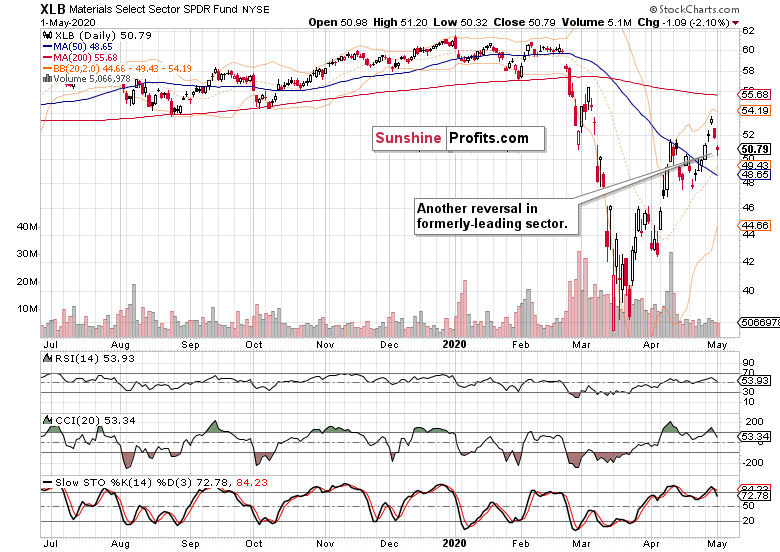
A similar conclusion can be reached from the materials examination. While they held up better throughout the day (just like consumer discretionaries, the XLY ETF, did), it'll likely prove to be of fleeting nature only (in both cases).
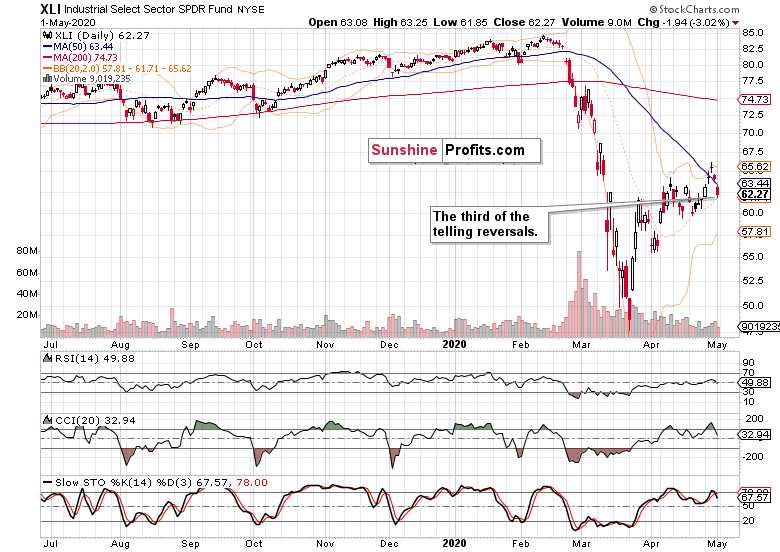
And that's also true with industrials, where the weakness was more along the lines of energy. Plain obvious, that is.
Overall, this mix shows that there can be no talk of a local bottom being reached. The S&P 500 downswing has its ducks ligned in a row right now.
The Fundamental S&P 500 Outlook
Early in the week, the bulls enjoyed earnings reports that beat expectations among the tech heavyweights. That however changed with Thursday's aftermarket Amazon (AMZN) release - it's notable, how easily could the whole of its Q2 projected profit get gobbled up by coronavirus-related expenses, as they foresee it would.
The reopening euphoria has run against the wall as about half the States have partially reopened their economies. The epidemiological situation is improving in some areas while deteriorating in others, underscoring that jumpstarting the economy would be a long process. As we noted in our April 12 Stock Trading Alert, while there is a legitimate desire to get the economic life going again, these factors are to be counted with:
(...) 1. the stress and damage to the supply chains
2. consumer confidence and lifestyle habits
3. small and medium business capacity to absorb the shocks
4. the ability to buy time and soften the blow via monetary and fiscal interventions
Going into Friday's trading, the Trump finger pointing on China for coronavirus raised fears about the trade war that took a backseat to the pandemic. Understandably, not even the high hopes placed in remdesivir getting the emergency use authorization, could turn the sentiment.
Fundamentally, we expect the stock market to reassess its overly optimistic prospects against the economic impact on the ground. Stock valuations are likely to be viewed as extended, and this supports the bearish bias over the coming sessions.
From the Readers' Mailbag
Q: What would you think would be the next level down on the SP 500? 2793 - the 50% FIB retracement from the lows? or 2652 - the 38,2% retracement?
A: The 50% Fibonacci retracement is within spitting distance, and in the course of the S&P 500 daily chart analysis, we've discussed an area in between these two retracements that we expect to give the bears a harder time than the 50% Fibonacci retracement. Throughout the move, we'll be monitoring the sectoral strength, their ratios, and the credit markets, for these will give us an idea how far the current downswing can actually reach. We think that we're in the opening stages thereof, and that our open profits will keep growing before it's justified to close the trade.
Q: Should I buy at around 2600?
A: It's too early to say that, as the above points about credit markets, sectoral strength, ratios and fundamental developments apply whatever numerical target we discuss. Together, they'll form the basis for our upcoming trading decision, and yes, stocks declining to the low 2600s is one of the preliminary scenarios or hypothesis if you will.
Summary
Summing up, stock rolled over almost all the way down to the 50% Fibonacci retracement, highlighting the significance of the reversal from the 61.8% Fibonacci retracement. The credit markets support the downswing, and so does the broad sectoral analysis. We're in the early stages of the S&P 500 downswing and our open and profitable short position currently featured in Stock Trading Alerts, is amply justified.
Very short-term outlook for the stock market (our opinion on the next 2-3 weeks):
Bearish.
Short-term outlook for the stock market (our opinion on the next 2 months): Sideways.
Medium-term outlook for the stock market (our opinion on the period between 2 and 6 months from now): Sideways.
Long-term outlook for the stock market (our opinion on the period between 6 and 24 months from now): Sideways, then rather bullish.
Very long-term outlook for the stock market (our opinion on the period starting 2 years from now): Bullish.
As a reminder, Stock Investment Updates are posted approximately once per week. We are usually posting them on Monday, but we can't promise that it will be the case each week.
Please note that this service does not include daily or intraday follow-ups. If you'd like to receive them, we encourage you to subscribe to our Stock Trading Alerts today.
Thank you.
Monica Kingsley
Stock Trading Strategist
Sunshine Profits - Effective Investments through Diligence and Care

