
- Tapering or Tightening?
- USD and Euro Indices
- General Stock Market
- Correlation Matrix
- Gold
- Silver
- Mining Stocks
- Letters from Subscribers
- What is a reasonable timeframe to hold DUST?
- GDX - the best buying opportunity in a lifetime or the end of the bull market?
- Summary
Tapering or Tightening?
Atlanta Federal Reserve President Dennis Lockhart delivered the news, responding to all speculation about the coming back issue of possible “tapering”. Despite the chairman change for Ms. Yellen, the tapering issue did not taper out yet. Lockhart has told us that the Federal Reserve still plans to stay “accommodative” for the number of years to come. This does not mean though that some possible adjustment may not happen, because the “tools” of remaining “accommodative” may change. In other words, the message is: even if some things may change, remember, the Fed is always ready to starts its machine to help banks.
What does he mean exactly by this? Definitely it relates to the “dovish” aspects of Fed’s current policies. The underlying message is quite clear: we are not backing out from expansionary monetary framework. The American central bank is still planning to make sure that the banking system has enough Greenbacks, Dollars at hand to keep them afloat. What may change is the tool affecting that process.
We should keep in mind what we have mentioned in the last report: the Federal Reserve has used different special Bernankish tools to make sure that the money-machine is still working in favor of the current benefactors of the American banking system. Those tools in general were:
- Interest rates kept very low for a significant amount of time
- Quantitative easing, which meant money production for support of various assets, especially government bonds,
- Easing in terms of qualitative aspects, that is the expansion of the balance sheet which has benefited not only government bonds, but also some private assets, related to real estate markets.
This leads us to Lockhart’s observations. Some form of “tapering” may happen even though the Fed shall stay “easy like the Sunday morning” in its approach to money printing. The simplest possible scenario to imagine is for example a decrease in private assets holdings by the Fed, and moving away in favor of government bonds. At the same time interest rates could stay at record low levels (negative in real terms), and no money vacuum cleaner shall be turned on.
In other words, the Fed could just drop holding on to some paper related to the real-estate without raising the interest rates, and also without sucking out any money from circulation. The Fed could just swap its private paper not for the money, but simply for other government assets. This naturally would favor the Treasury even more than it is favored now.
Overall, the essential difference between the two tools is that asset purchases and interest rate targeting are two separate methods of helping out the banking system. Those details do not change the main goal visible on the horizon: do not let the banks get into trouble. The side effect of the above approach is that over the long run, gold should not get into trouble as well – meaning, that its price is likely to be much higher in the years to come regardless of how low it goes in the coming weeks.
The above is based on the December Market Overview report. Let’s move to the charts to see what’s likely to happen in the medium- and short term (charts courtesy of http://stockcharts.com.)
USD and Euro Indices
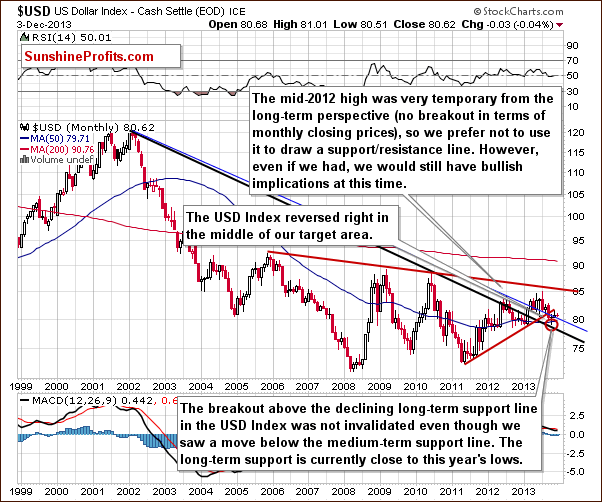
From the long-term perspective the situation hasn’t changed much recently and what we wrote in our previous Premium Update is still up-to-date today.
(...) the long-term breakout above the declining long-term support line was not invalidated. Additionally, the USD Index reversed right in the middle of our target area. Therefore, from this perspective, it seems that the downward move – if it’s not already over – will be quite limited because the long-term support line will likely stop any further declines.
Now, let’s examine the weekly chart.
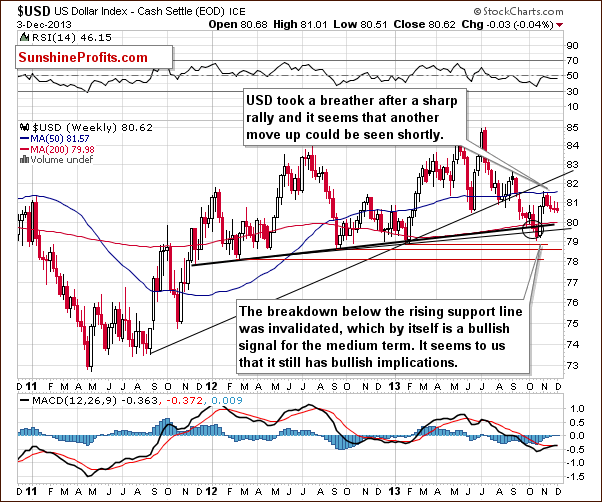
Looking at the above chart we see that the USD Index dropped to the last week’s low, which is slightly above the November low. Therefore, we might see a post-double-bottom rally in the coming week.
Please keep in mind that from this point of view the current correction is still shallow, which is a bullish signal for the short term. As you can see on the above chart, recent weeks have formed a consolidation, which is likely a pause before further increases.
Let’s check the short-term outlook.
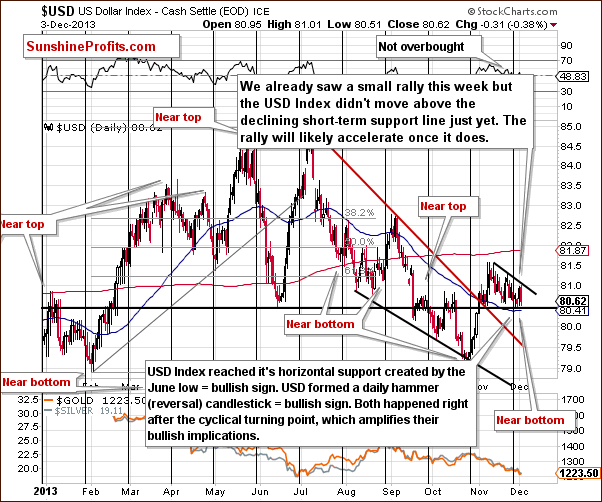
In our previous Premium Update we wrote the following:
(...) the USD Index extended its decline and dropped to the previously-broken support/resistance line created by the June low. Last week, the proximity to this support level (…) triggered a sharp move up, which took the dollar above the level of 81 once again. Therefore, since this level was reached once again, it seems that we might see a similar rally once again.
As you see on the above chart we saw such price action earlier this week. The dollar bounced off its horizontal support and approached the level of 81. However, it didn’t move above the declining short-term resistance line just yet. If we see a breakout above this line the rally will likely accelerate. In this case, the first upside target for buyers will be around the November high at 81.58.
What’s even more interesting is the decline that we saw on Tuesday. Basically, the USD Index nullified Monday’s rally, so with a neutral situation on the precious metals market, one might have expected gold, silver and mining stocks to move back up after Monday’s decline. Gold barely rallied, while silver and mining stocks declined. This is a very bearish sign and we will get back to it in part of today’s update.
Let’s now take a look at the medium-term Euro Index chart.
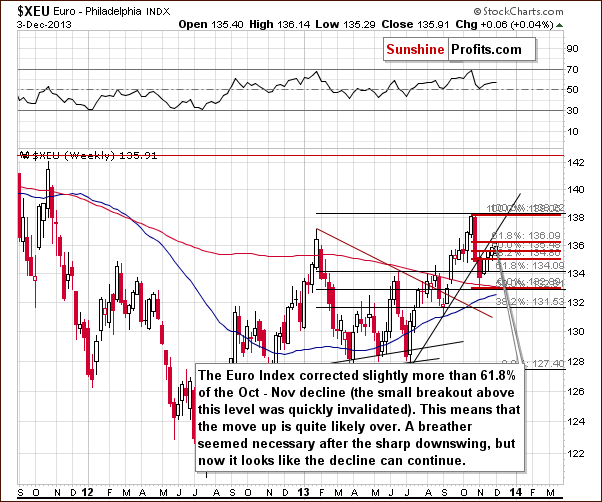
As you see on the above chart, at the end of last week, the Euro Index extended its rally above the level of 136 and corrected slightly more than 61.8% of its October-November decline (to 136.09). In spite of this fact, the European currency quickly reversed course and invalidated this small breakout, which is a bearish signal.
Please note that despite the recent increase the euro didn’t even touch the short-term rising support line based on the July and September lows. It still serves as resistance and the breakdown below this line hasn’t been invalidated.
Combining these two facts, we can conclude that the move up is quite likely over and the decline can continue. If we see a move below 131.56, the bearish implications will be even stronger.
Summing up, we are likely to see improvement in the USD Index and weakness in the Euro Index on a short-term basis. As mentioned earlier in this section, the USD Index bounced off its horizontal support once again and it seems that the bottom of the current correction is already in. Additionally, the euro invalidated the breakout above the 61.8% retracement, which means that the move up is quite likely over. Therefore, currently, the implications for the precious metal market are bearish – especially when we take into account the fact that the USD Index didn’t even approach its November high, while precious metals declined below their November lows.
General Stock Market
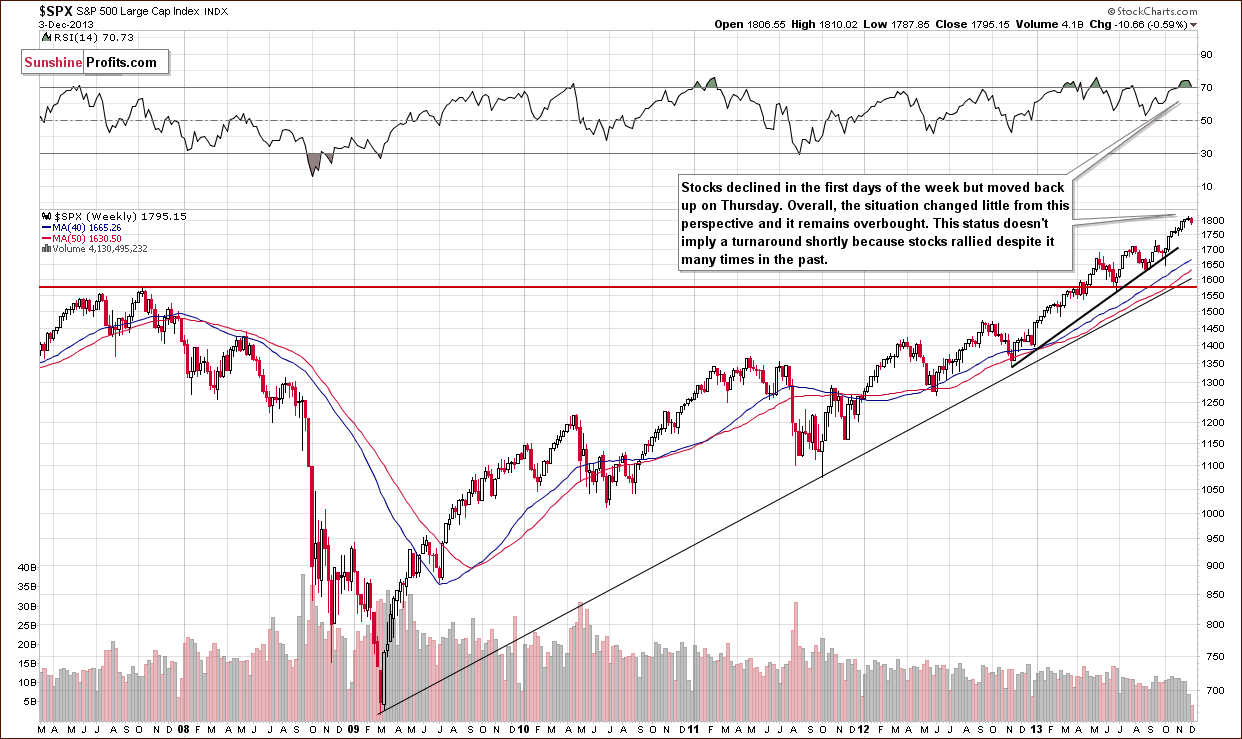
On the above chart we see that the S&P500 Index hit a fresh all-time high at 1,813.55 on Friday. However, the index gave up the gains and closed the previous week slightly above its psychological barrier of 1,800. This week we saw further deterioration and the S&P500 Index slipped below 1,800. Nevertheless, the breakdown is not confirmed.
Despite this decline, from this point of view, the long-term outlook remains bullish. Please note that the RSI slipped below the level of 70 for the first time since the beginning of the previous month, which suggests that we might see some weakness in the short term.
Let’s move on to the short-term chart.
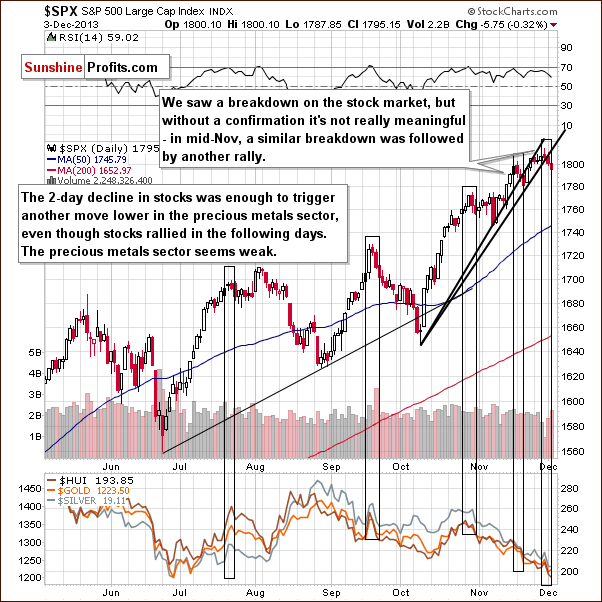
On the above chart we clearly see that stocks broke not only below their previous high, but also their psychological barrier of 1,800. Although the breakdown is not really meaningful without a confirmation we noticed that the current situation is similar to the one of which we wrote 2 weeks ago.
At that time we wrote the following:
Stocks declined once again (…) and there are some non-obvious bearish implications for the precious metals sector. If we consider the past 6 months, there were only 3 cases when stocks declined for 2 consecutive trading days in a similar fashion to what we see right now - similar shapes of daily candlesticks and with sharp rallies preceding the 2-day decline. These were July 23-24, Sep 19-20, and Oct 29-30. It was not the final top for the stock market in all 3 cases, but in all 3 cases we saw a significant decline in the precious metals sector in the following days and weeks. (…) The above-mentioned declines on the precious metals market were not small – as you can see on the above chart – and thus, it seems that this bearish signal is still in play.
Currently, we saw another two-day decline in stocks (actually a 3-day one). As it turned out it was enough to trigger another downward move in precious metals. Therefore, the implications are bearish going forward. We’ll discuss them in greater detail in the following section.
Gold & Silver Correlations
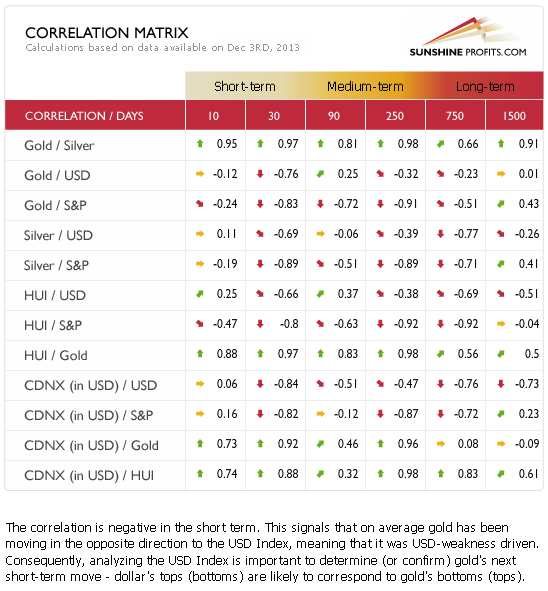
The correlation coefficients remain strongly negative as far as the short-term (30 trading days) link between precious metals and the USD Index is concerned. The 10-day column includes values that are closer to 0, which simply means that gold didn’t really respond to dollar’s move lower – which is a bearish sign. We saw that on Tuesday, when gold moved just a little higher (silver and miners declined) despite a move lower in the USD.
As far as the general stock market is concerned, the correlation coefficients can currently be quite misleading as they were based on a period when gold moved lower and stocks rallied – the only thing that we know based on the negative correlation calculated based on this period is that gold is likely to decline if stocks rally – it doesn’t tell us much about the other side of the market. Based on the negative 30-day value, we have only a slight indication that if stocks decline gold would move higher. We would have a much stronger one if in the last 30 trading days we saw a decline in stocks and could measure gold’s reaction. At this time gold’s, silver’s, and miners’ performance on Tuesday tells us a lot about the sectors link with the general stock market. The precious metals sector didn’t respond with a rally to main stock indices’ decline. Consequently, we don’t expect further declines on the general stock market to trigger rallies in the precious metals sector either.
Overall, the implications of the related markets on the precious metals sector are bearish.
Gold
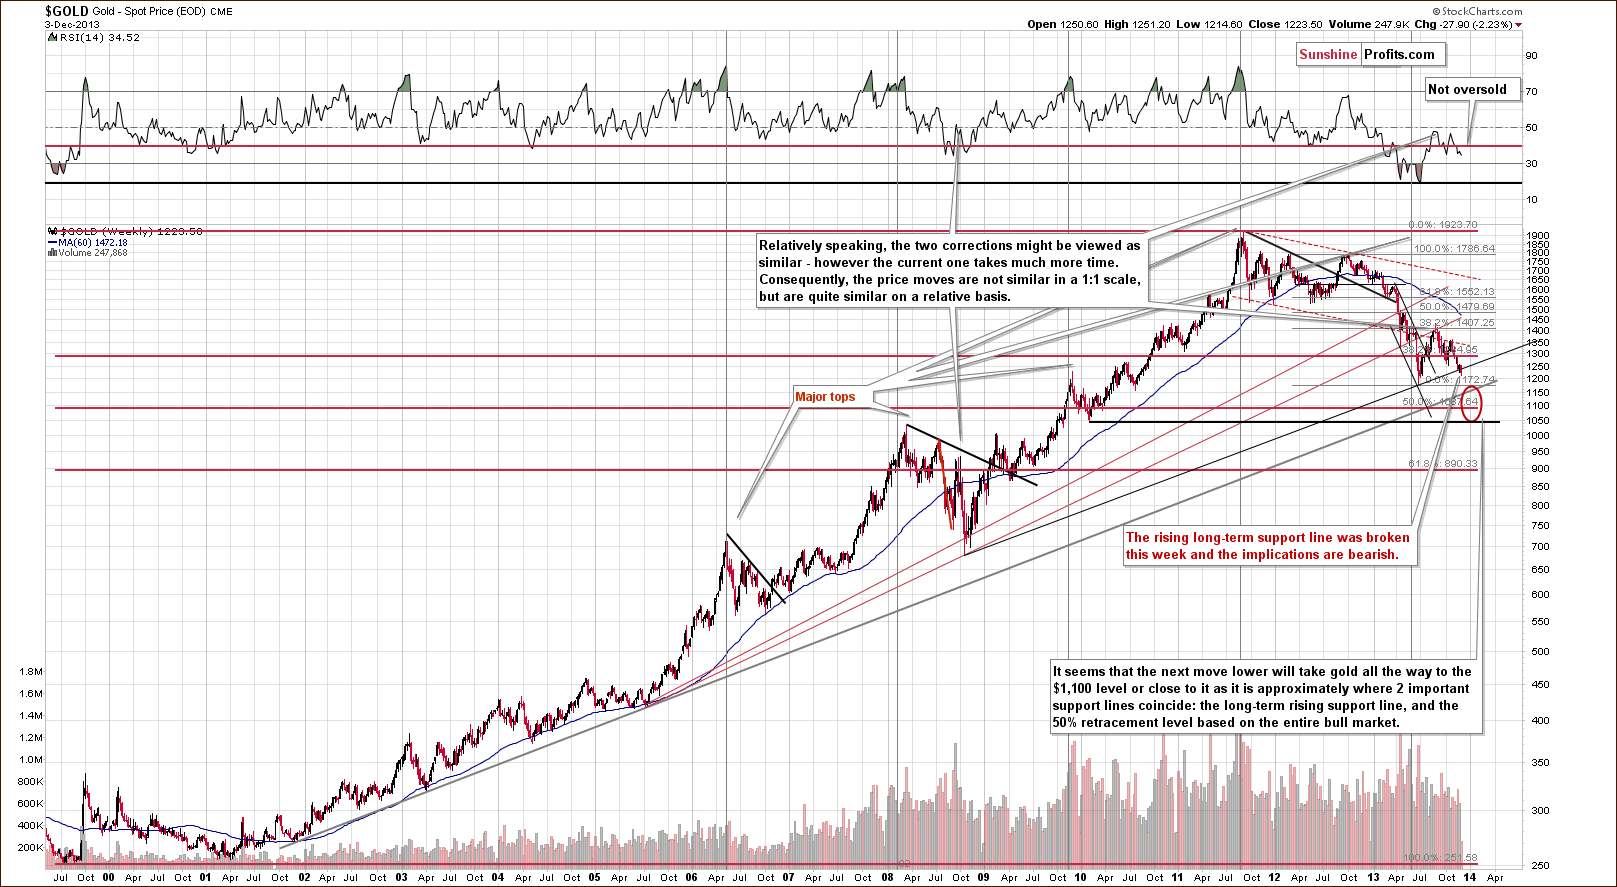
This week we saw a major change on the above chart as gold broke below the rising long-term support line.
The implications are bearish, especially that the RSI indicator is currently not oversold – it’s above 30 and well above its previous 2013 lows. Back in 2008, the RSI indicator moved close to its previous lows when the final bottom was in. In this case we would need to see much lower gold prices to have RSI close to the 20 level.
The next stop for gold is at its 2013 low, slightly above $1,170. It seems to us, however, that this will not be the final bottom for this decline, we expect the final one to form close to $1,100, possibly even at $1,050.
Let’s move on to the short-term chart to see the recent price moves more clearly and estimate the short-term outlook.
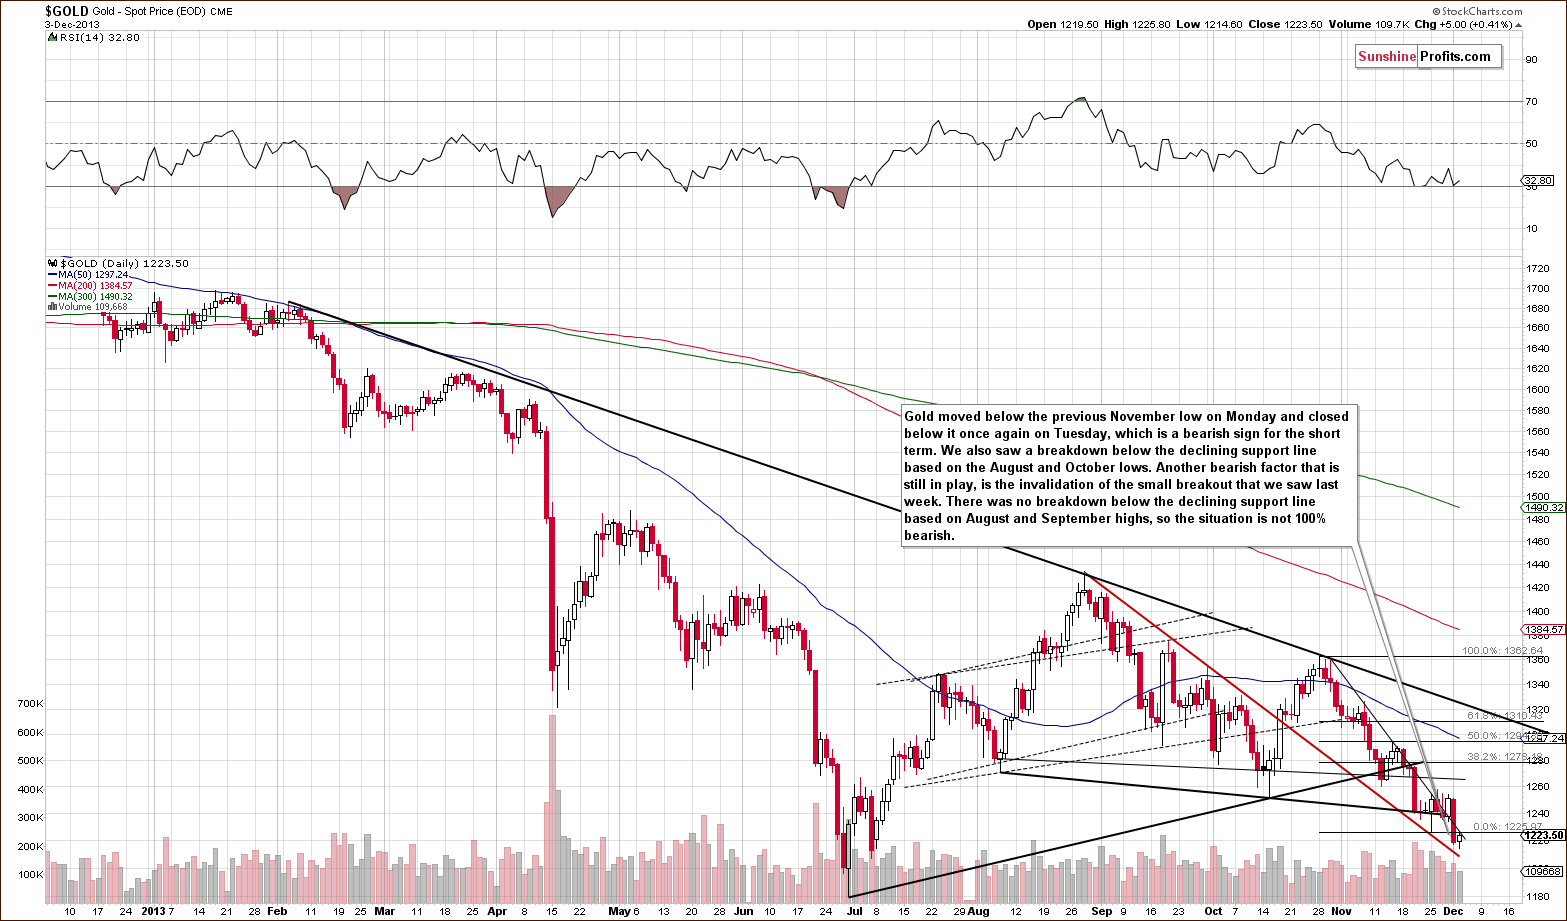
Gold moved below the previous November low on Monday and closed below it once again on Tuesday, which is a bearish sign for the short term. We also saw a breakdown below the declining support line based on the August and October lows. Another bearish factor that is still in play is the invalidation of the small breakout that we saw last week.
There was no breakdown below the declining support line based on August and September highs, which means that the situation is not clearly bearish just yet.
Let’s keep in mind that gold is once again exhibiting great weakness relative to the USD Index, which we can see once again on the above chart – the downtrend clearly remains in place, even though USD moved slightly lower recently.
The RSI is close to 30, which signals that gold is oversold on a short-term basis, but the above-mentioned weakness suggests that we shouldn’t be surprised to see gold even more oversold shortly – after a big drop.
Let’s take a look at the chart featuring gold’s price from the non-USD perspective.
From the non-USD perspective, we saw a breakdown below the rising support line and below the previous 2013 low.
Not only is the medium-term trend down, but the pace of the decline might accelerate in the coming days/weeks based on the above-mentioned breakdown.
Speaking of breakdowns, let’s see how the above breaks down to individual currencies (non-USD gold price is the average of several gold prices priced in currencies other than the USD).
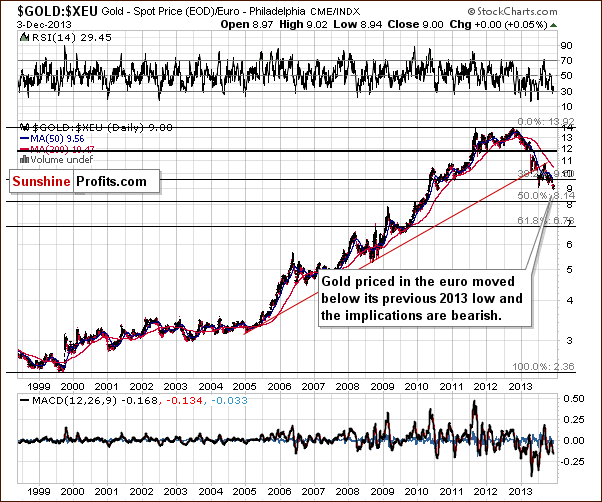
This week we finally also saw a breakdown in the case of gold seen from the European perspective. Gold closed below the previous 2013 low and the implications are bearish. We saw 2 consecutive closes below this level, and if we see the third one, we will have a verification of the breakdown with much more bearish implications.
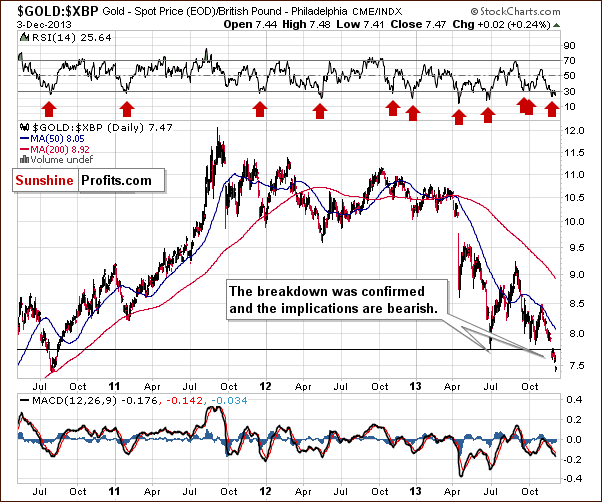
Generally, what we wrote last week about gold priced in the British pound remains up to date:
It moved below its 2013 lows, which is a bearish factor, and the breakdown was verified by 3 consecutive closes below this level, which is even more bearish. The RSI indicator is currently below the 30 level, which means that a correction is quite likely to be seen soon, but based on the confirmation of the breakdown, it seems that it could start at much lower prices (meaning after a quick decline).
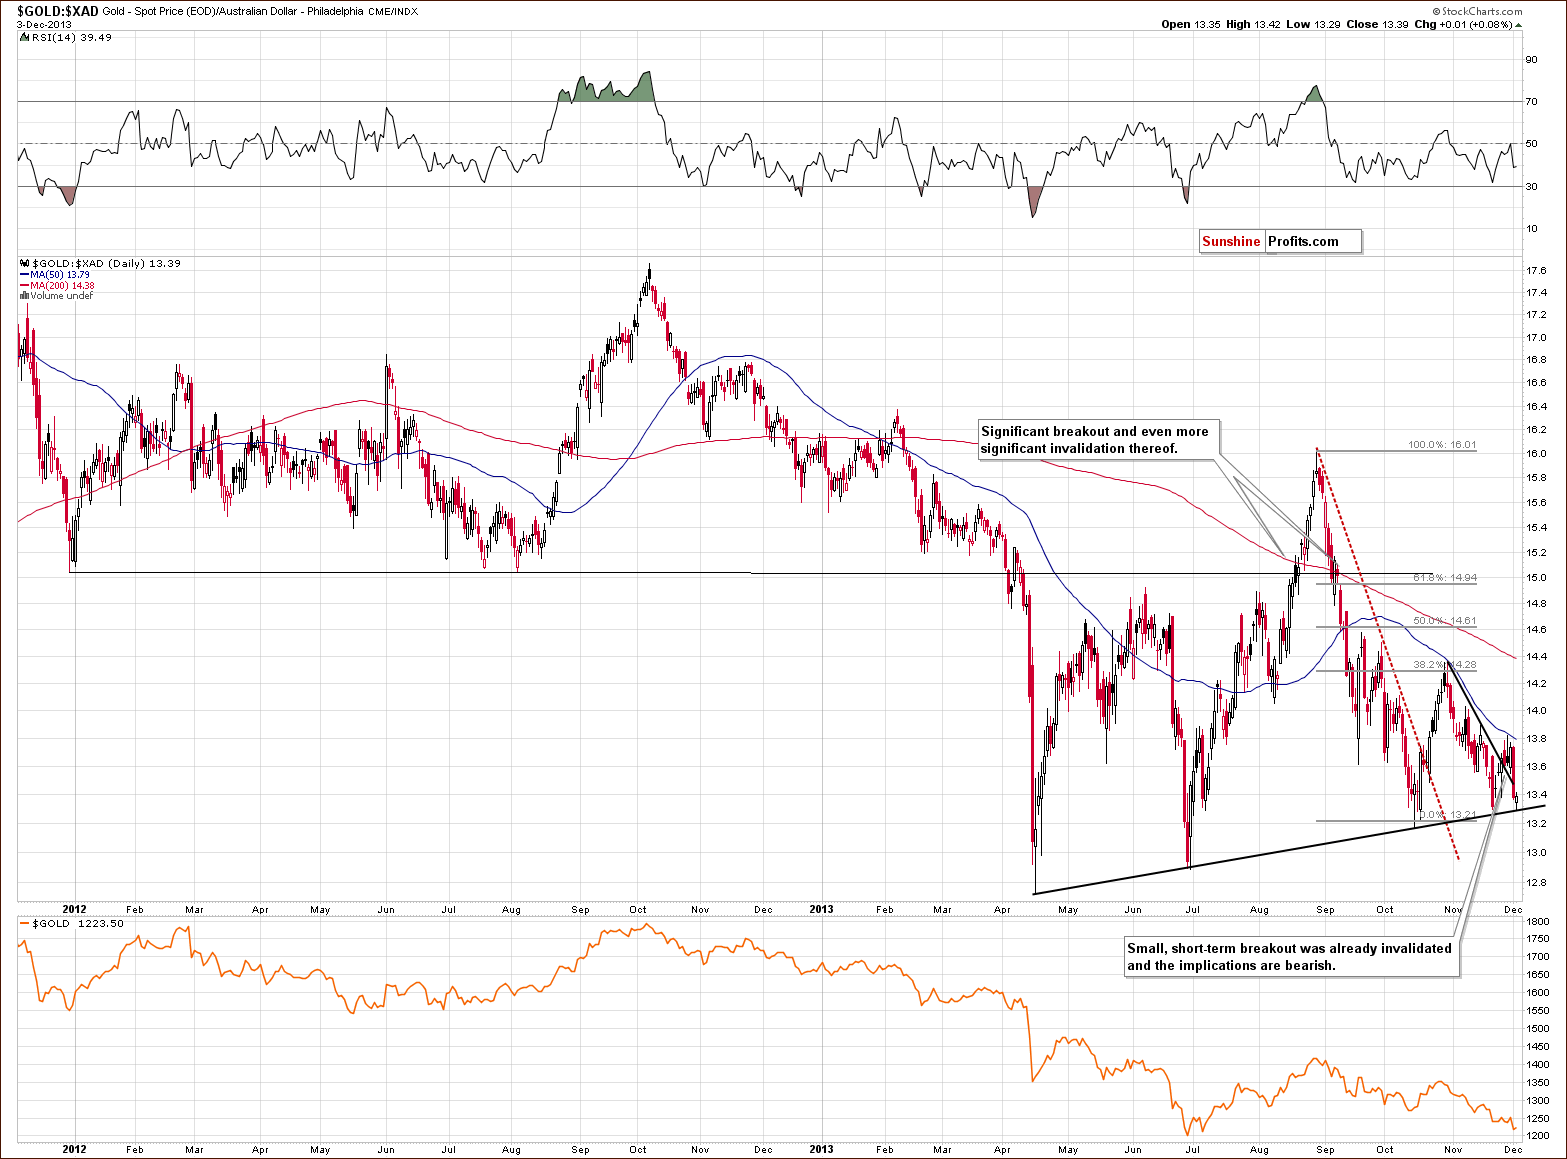
Last week we commented on the breakout in gold priced in the Australian dollar. We wrote that the breakout is not visible from other perspectives, so its bullish implications are limited. This breakout was invalidated this week and implications are bearish.
The bearish picture will be much stronger if we see a confirmed move below the neck level of the head and shoulders formation that’s been underway since mid-April. If we see the above, we will be expecting another decline similar to the one seen in September and early October (the size of the “head” of the pattern). In the USD terms, a repeat of this pattern, could mean a slide to the $1,000 level or so.
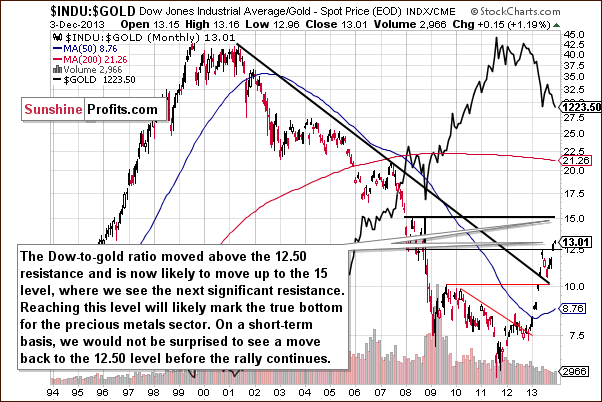
Last but definitely not least, we would like to discuss the Dow to gold ratio. That’s one of the most important and useful ratios there are as far as long- and medium-term trends are concerned. In particular, the big price moves can be detected before they happen (note the breakout in the first months of the year that heralded declines in gold).
We saw a breakout above the 12.5 level 2 weeks ago and shortly thereafter we wrote that with the ratio even higher today, we have a good possibility that the breakout will be confirmed and that we will see a big drop in the price of gold in the coming weeks or months.
The ratio moved even higher last week and this and it’s already at 13.03. However given the sharpness of the most recent move up, we wouldn’t be surprised to see a correction to the previously broken 12.50 level before the upswing continues. It does not have to happen, though. Please note that at the beginning of the year, the breakout above the declining resistance line was not followed by a verification – the ratio soared without it.
Summing up, the medium-term outlook for gold remains bearish and it seems that we might see another sizable downswing shortly as the situation deteriorated this week.
We saw a series of breakdowns on the gold market and this also pushed the risk/reward ratio toward opening short positions in this part of the precious metals sector.
Silver
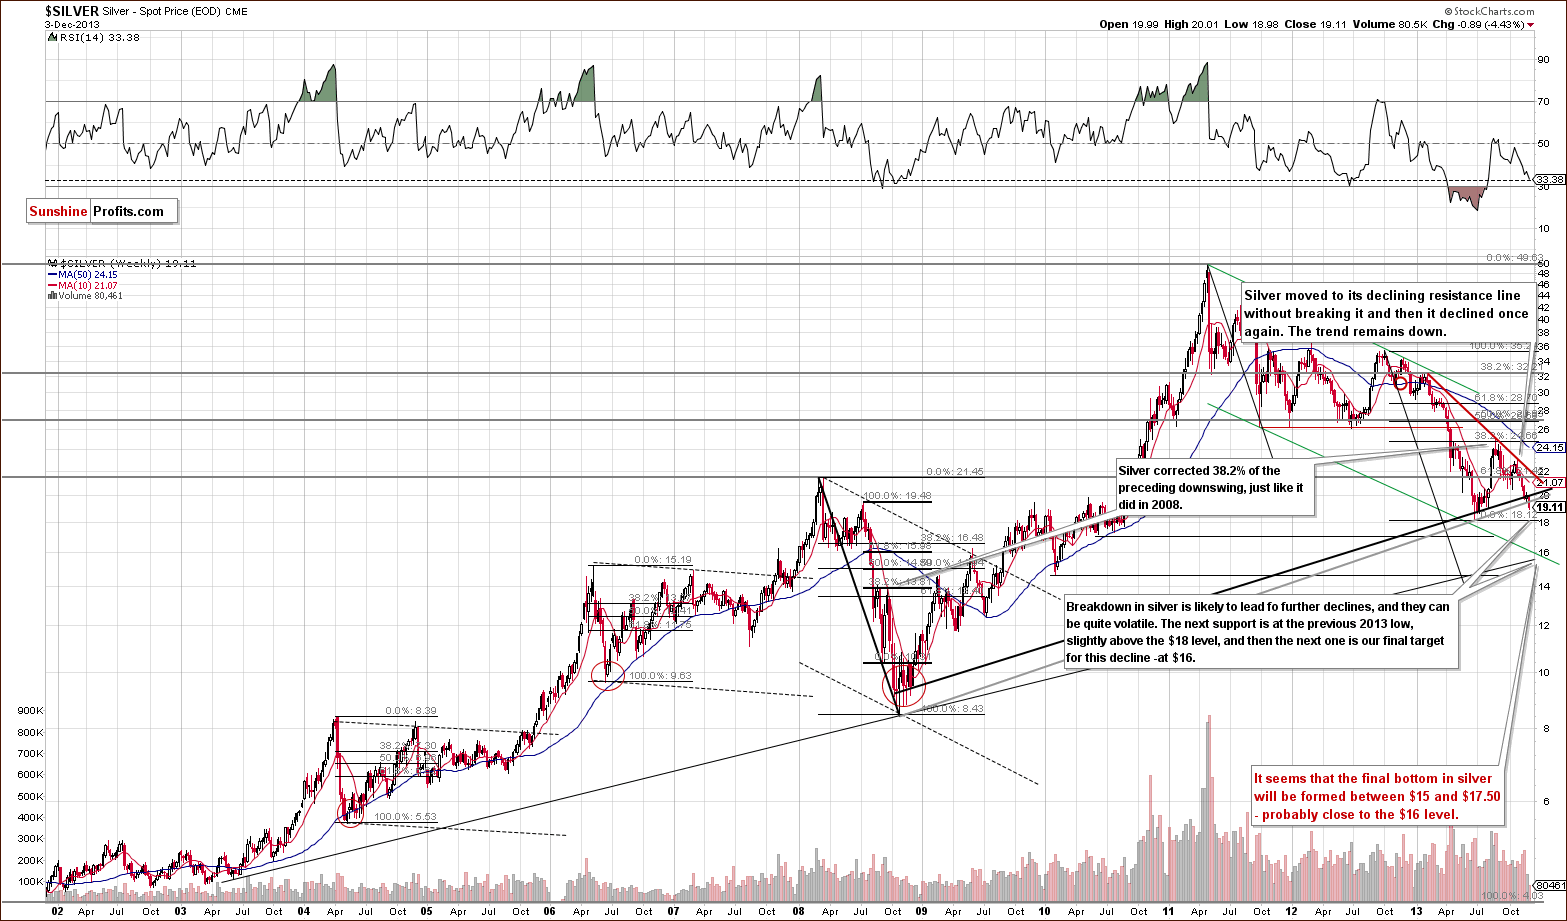
Gold declined above its rising long-term support line and we are not that surprised to be reporting analogous developments on the silver market. The white metal moved and closed for 2 consecutive trading days visibly below both rising support lines (black and grey ones). The implications are naturally bearish and they will be even more bearish if we see a third close below the lower of them. This seems very likely in our view.
The next support can be seen slightly above $18. Once we see silver below it, the next stop will likely be close to $16, which will quite likely (at least based on what we see today) mark the final bottom for the current medium-term decline.
Let’s move to the short-term chart to see the very recent price moves more clearly.
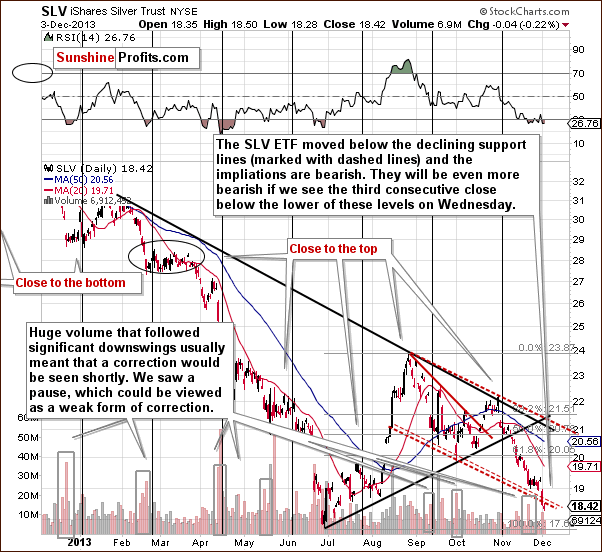
In addition to the above-mentioned long-term breakdown, we also saw a short-term one – below the declining dashed support lines. The breakdown is not confirmed yet, but it seems that it will be confirmed shortly – all we need is for SLV not to move back above the dashed line on Wednesday.
Summing up, the outlook for silver remains bearish and it has deteriorated this week. Not only did silver manage to decline below the long- and short-term support lines on Monday, but it held these levels on Tuesday even despite dollar’s decline.
Gold & Silver Mining Stocks
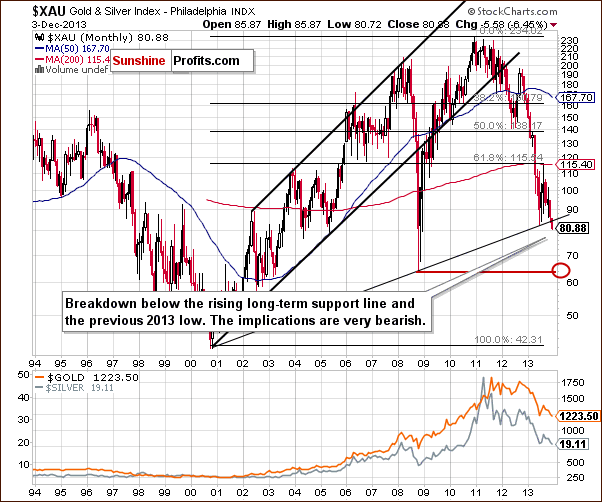
This week we will start the mining stocks section with the XAU Index chart (proxy for gold and silver mining stocks). We just saw a major breakdown below two critical support levels: the long-term rising support line and the 2013 low. The implications are clearly bearish for the coming weeks.
Quoting our last Premium Update:
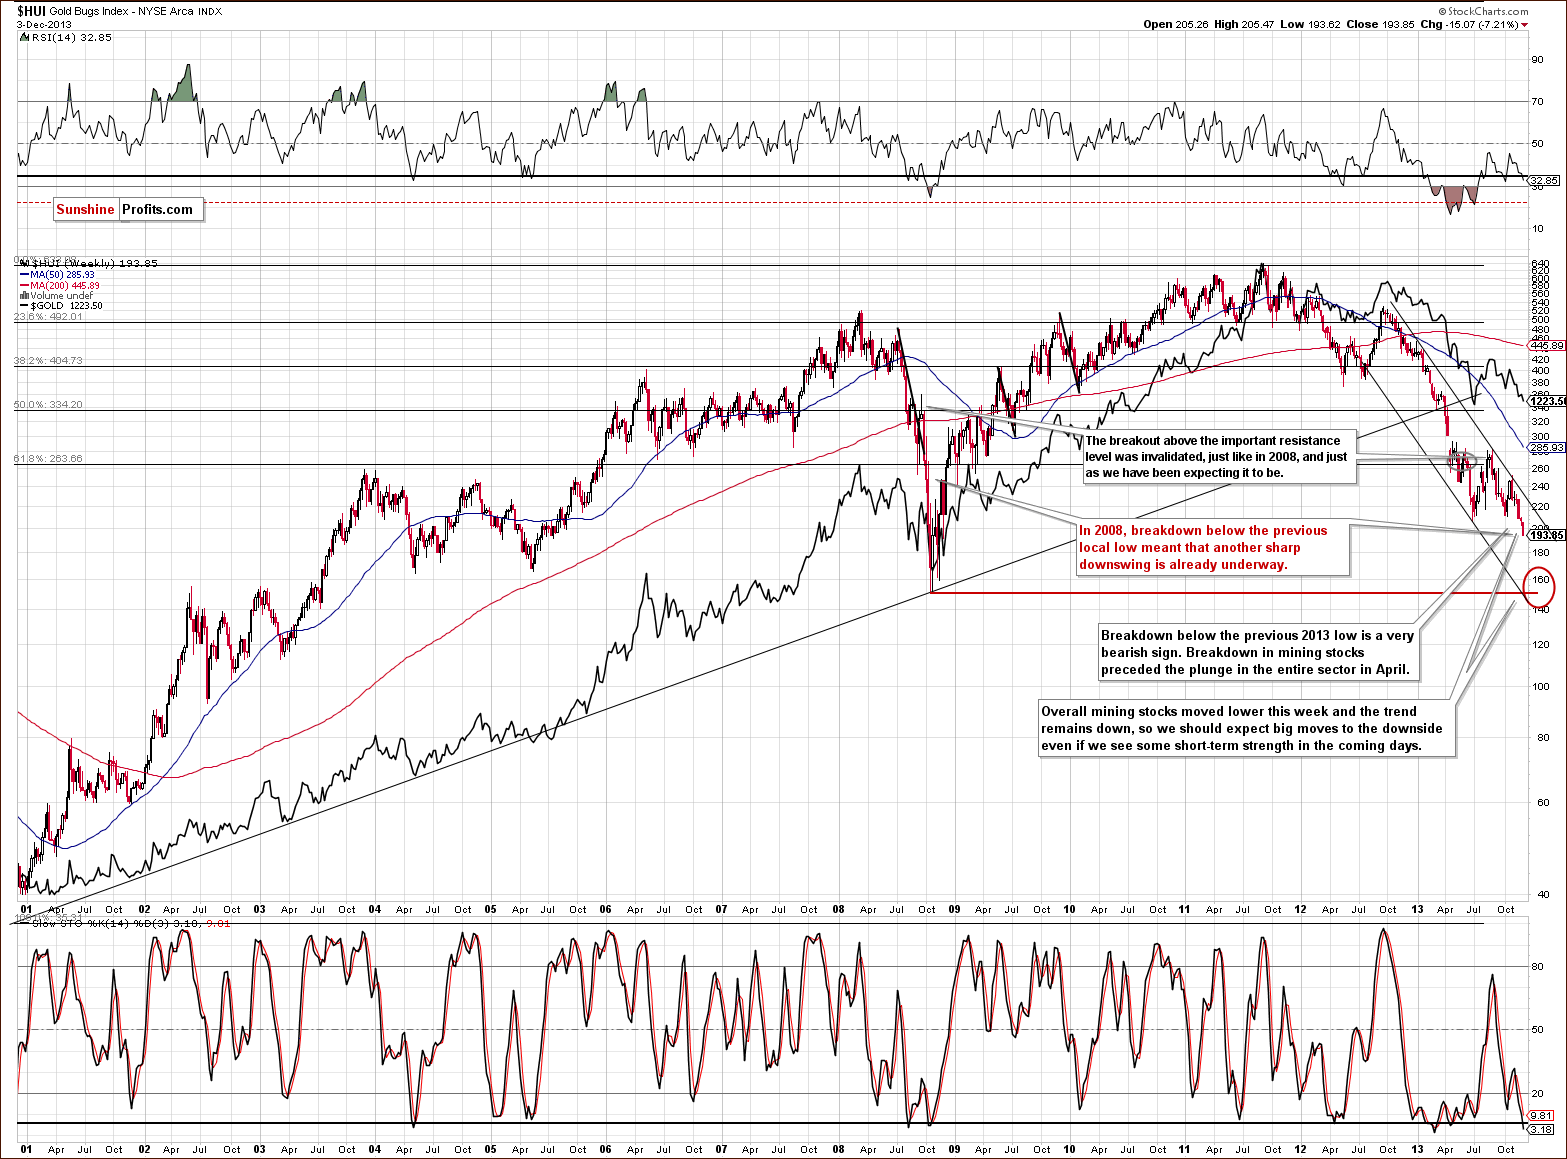
Looking at the above chart we see that the situation has deteriorated once again. This week, the HUI Index extended declines and dropped below the previous 2013 low, which is a very bearish sign. At this point it’s worth noting that a similar breakdown in mining stocks preceded the plunge in the entire precious metals sector in April.
From this perspective the trend remains down and taking the above into account, we can expect big moves to the downside in the days or weeks ahead.
We have indeed seen a big move to the downside, even though it’s been only a few days since the above was posted. This is another bearish confirmation, as back in 2008 breakdown below the previous local low meant that the final sharp downswing is already underway.
As mentioned previously, we expect the final bottom to be seen close to the 150 level.
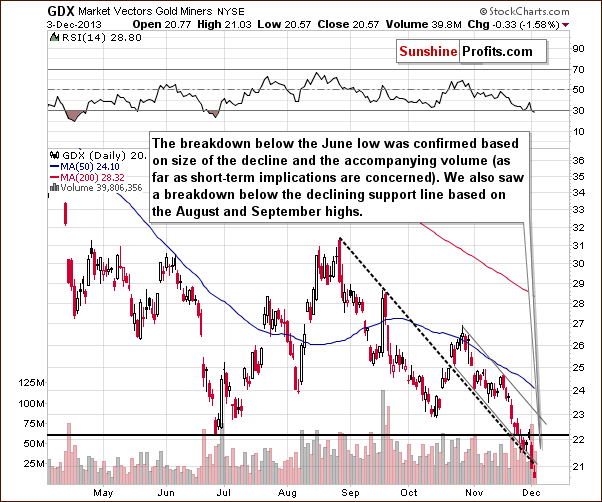
Let’s examine the short-term GDX ETF chart.
Last week we wrote the following about the above chart:
From the short-term point of view, we see that the situation has deteriorated recently. At the beginning of the week mining stocks declined below the previous 2013 low and stayed there for three consecutive trading days. This means that the breakdown is confirmed at the moment and the implications are bearish.
As you can see on the above chart, miners reached the medium-term declining support line created by the August and September high – similarly to what we saw at the beginning of the month. Back then, this line triggered a consolidation (just like now); however, as it turned out it was just a pause within a short-term decline.
Taking this fact into account and combining it with the confirmed breakdown below the previous 2013 low, the current decline could become a major, medium-term decline.
It seems that we indeed see mining stocks in a major medium-term term decline as they dropped significantly this week.
There was even another breakdown - below the declining support line based on the August and September highs. The implications of the above chart remain bearish.
Finally, we would like to discuss the current situation on the gold stocks to gold ratio.
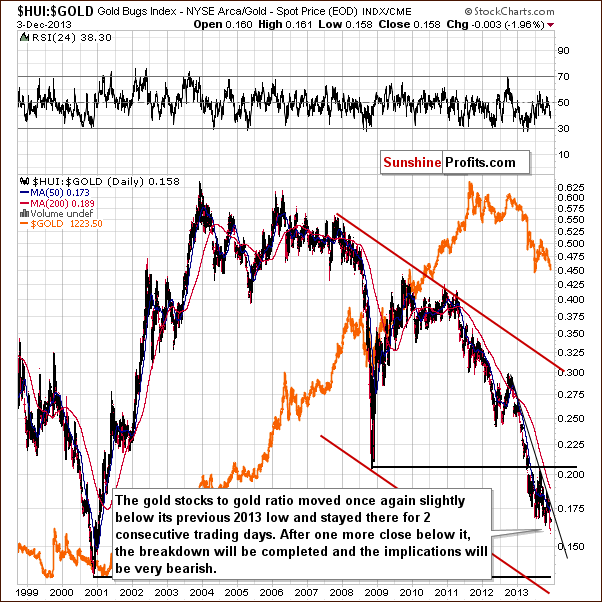
On the above chart we clearly see that the situation has again deteriorated in the recent days. On Monday the HUI to gold ratio dropped slightly below its previous 2013 low and we saw it close there on Tuesday as well. The breakdown is not confirmed at the moment but just one more daily close below the previous 2013 low will make the situation much more bearish.
Summing up, the medium-term trend remains down, the decline is quite likely to accelerate shortly and the outlook for the mining stocks sector is very bearish.
It seems that practically all markets – gold, silver, main stock indices – are going down right now (except for crude oil, where we just saw a major breakout on huge volume) and mining stocks are declining along with them; actually, the are leading the way.
Letters from Subscribers
Q: Please comment: ref DUST: given the way the fund is set up, what do you think is a reasonable time frame over which to hold this ETF? Put another way, is it a good idea to hold over a couple weeks/month when high volatility is miners is expected? Thanks.
A: The answer to this question is the same as the answer to a question about the timing of the possible bottom in the mining stock sector. Given the recent breakdown, it seems that we might expect the bottom to be in within the next 2 - 15 weeks. Yes, we realize that it's a quite wide range, but a lot depends on many factors. Our best bet is in the middle of the above range, meaning 1-2 months from now. Again, that's our best guess, not an official prediction.
Generally, the biggest problem with ETFs / ETNs is that they may not provide gains in precious-metals-related assets in case of severe financial turmoil. Funds can go bankrupt, while physical gold and silver bars can't. In case of betting on lower prices, the risk is limited, because we expect any significant turmoil to be seen along with very high precious metals prices. Consequently, in general, ETFs / ETNs are ok for trading even taking several months into account, but not that useful in case of long-term investments, however, when betting on lower prices of gold/silver/mining stocks, the disadvantage of ETFs / ETNs is limited and very small.
Q: Could you maybe elaborate on this a little bit. It seems like a big change if we are selling our long term holdings on miners. Where do you see the GDX bottoming?? How long might this take???? And above all are we looking at the best buying opportunity in a lifetime or the end of the bull market???
A: We see GDX bottoming close to its 2008 high - the $16 level (analogous level to HUI's 150). This might take 2 - 15 weeks, probably 1-2 months. We think we are looking at a great buying opportunity. The systemic risk is increasing as monetary authorities decide to keep pumping money in the economies, and so is the likelihood of higher precious metals prices in the coming years. When the mainstream media will be screaming that gold is worthless, it's not a hedge against anything and that it's a very bad investment - it will be when we will have great buying opportunity. It seems that we will see one in the not too distant future.
Summary
Even though just a few days have passed since we posted our previous Premium Update, we saw more important developments that we usually see in a full week (or a month in some cases). We saw multiple breakdowns in gold, silver, and mining stocks. Some of them are already confirmed, and some are almost confirmed.
Gold, silver, and mining stocks have showed weakness once again by failing to rally higher on Tuesday when USD index moved lower. Since USD is likely to rally, the decline in the precious metals sector is likely to accelerate even based on this link alone.
Since we saw the above-mentioned breakdowns, the outlook is even more bearish. The key question at this time is whether the outlook is bearish enough to keep the short position intact and whether being partly invested in gold, silver, platinum and mining stocks is justified.
We think that keeping the speculative short positions opened is justified.
We also think that being out of the precious metals sector (meaning gold, silver, platinum, and mining stocks) is also a good idea at this time, because of the combination of multiple bearish factors. This means hedging / selling gold, silver, and platinum holdings.
Actually, before seeing today’s pre-market action, we were leaning toward keeping the holdings in metals intact, but the situation became even more bearish once we saw another example of gold’s excessive weakness given the moves in the USD Index – just a little move higher in the US Dollar means a big drop in gold, and a move back down in the USD Index, doesn’t mean anything or it’s implications are limited. This is a very bearish sign, especially after a breakdown below long-term support level.
Naturally, we do not suggest selling gold and silver that you have in your insurance part of the portfolio (meaning that you should still own some “just in case”).
To summarize:
Trading – PR: Short position in gold, silver, and mining stocks. Extra position.
Trading – SP Indicators: No positions: SP Indicators suggest long positions, but the new self-similarity-based tool suggests short ones for the precious metals sector. We think that overall they cancel each other out.
Long-term investments: No positions.
| Portfolio's Part | Position | Stop-loss / Expiry Date |
|---|---|---|
| Trading: Mining stocks | Short | HUI: 214, GDX: $22.80 |
| Trading: Gold | Short | $1,262 |
| Trading: Silver | Short | $19.80 |
| Long-term investments: Gold | None | - |
| Long-term investments: Silver | None | - |
| Long-term investments: Platinum | None | - |
| Long-term investments: Mining Stocks | None | - |
This completes this week’s Premium Update. Our next Premium Update is scheduled for Friday Dec 13, 2013 (hopefully it won’t be unlucky). We will continue to send out Market Alerts on a daily basis (except for when Premium Updates are posted) and we will send additional Market Alerts whenever appropriate.
Thank you for using the Premium Service.
Sincerely,
Przemyslaw Radomski, CFA

