
- Euro & USD Indices
- General Stock Market
- Correlation Matrix
- Gold
- Platinum
- Silver
- Mining Stocks
- Letters from Subscribers
- Gold needs a new story
- Seizing Gold deposits and Bitcoin
- Dollar and gold miners link
- Summary
Cyprus lawmakers this week rejected a controversial euro bailout package which would have set a dangerous precedent by taxing ordinary bank depositors to pay part of the bill.
But the genie has been let out of the bottle. The fact that a democratic government could propose such a plan is a game changer. Ordinary people everywhere now know that putting their savings into insured bank accounts is no longer a guarantee of a good night’s sleep. When governments are in desperate financial straits they will not hesitate to plunder the accounts of ordinary savers and investors. And that make gold all the more attractive.
At issue was a plan for a one-time tax of 6.75% on bank deposits of less than 100,000 euros even though deposits are guaranteed (insured) up to that amount in Cyprus and in most other European countries. In addition, the government wanted to levy a 9.9% tax on Cyprus bank accounts with more than 100,000 euros many of which contain Russian money. Russian banks and businesses have been flooding Cyprus for years taking advantage of low taxes and loose regulations, setting the laundering dial on the fast spin cycle. This decision would have penalized small depositors who are not responsible for the bubble and would have let off the hook the bankers, shareholders and bondholders who supposedly assumed the risks. Worried investors everywhere finally got the point that gold is one of the few safe havens and gold went up $22.8 (1.43%) this week. On Tuesday, for the first time since February 6th, gold was added to the trust for the SPDR Gold Shares ETF (GLD).
Cyprus, like Iceland before it, has an outsized banking sector eight times the size of its economy, which indicates that money flows into its banks without any connection to the local economy. (In other words, possibly some tax evasion and a bit of money laundering.) Just for comparison, U.K. banks are only three times larger than the British economy and London is considered to be a global financial center. Cyprus banks were heavily damaged by exposure to Greece and now Cyprus' entire banking system needs to be capitalized.
Even by just having considered shaving the top of bank deposits, a psychological Rubicon has been crossed raising some serious questions and issues.
The first is why bother having a deposit guarantee if governments can expropriate your deposits? Even though policy makers claimed this would be a one-time event, how can one be sure? If this were to happen in Cyprus, could it not happen anywhere else in the euro zone, Greece, Spain, etc.? Already there is a similar proposal being considered in New Zealand. Without credible deposit insurance it’s every person for himself, all bets are off and it’s a matter of how fast you can queue up to withdraw your money. With such low interest rates paid on deposits, isn’t it safer to stuff the money into the mattress or under the floorboard? And if that’s the case, instead of paper money which loses value, wouldn’t it be smarter to hold gold? Without the public’s trust in the banking system the economy cannot function.
Of the nearly 100 banking crises that have taken place internationally during the last 20 years, all were resolved by bailouts at taxpayer expense, so that everyone shoulders the burden (other than those that caused it in the first place, bank managers and shareholders.) This would have been the first time that small depositors would have had to pay for the risks taken by bankers. This is known by economists as “moral hazard,” the tendency to take a risk knowing that the costs or losses will be borne by others. There are no incentives to prevent risky behavior by bankers.
There are two examples of small nations whose banks got into trouble during the 2008 economic meltdown. Ireland responded to the global banking crisis by guaranteeing all bank deposits, in spite of the high cost to the Irish tax payers. Ireland later needed an EU-led bailout. Iceland, on the other hand, let its banks fail leaving the United Kingdom and the Netherlands to bail out their own citizens. Iceland is on a fast track to recovery.
A similar situation took place in Israel in 1985 when the Israeli economy was in hyperinflation mode and a plan was on the table to impose a 10% tax on the public’s financial assets including bank deposits, pension plans, stocks and bonds. Then Prime Minister Shimon Peres nixed the plan and instead introduced sharp government spending cuts, devalued the currency, raised interest rates and froze prices for three months. The Israeli economy recovered.
Cyprus is a small country of less than a million people. It joined the Eurozone on January 1, 2008. That decision, to forgo sovereignty of its own currency, sealed its fate. Even though Cyprus backed down from the plan to tax deposits, just bringing it up as a possibility, might have killed its status as an offshore tax haven. But that’s what got it into trouble in the first place.
No one knows what will happen next, but none of the options is pretty. Cyprus debt-to-GDP ratio pushed to 127% in the third quarter of 2012. Only Greece (at 153%) has a higher level. It is politically difficult to persuade German taxpayers to finance a bailout of an off-shore money heaven for shady deposits, and can you blame them?
So either Russia will come to the rescue with a fat check, or EU officials will relent when faced with the prospect of a Cypriot exit from the eurozone. Another possibility might be that the Cypriots tax the big accounts and spare the small, mostly local savers. Cyprus has no central bank to prop up its banks like a non-eurozone country does. So the last option is for Cyprus to exit the eurozone and to start printing its own currency.
Without a doubt, the Cyprus crisis is putting a spotlight on the general disillusionment with the European unification project.
On another subject this week, central banks are cutting back on U.S. dollars and the euro and buying more gold, Japanese yen and Chinese yuan, according to a recent report from the World Gold Council (WGC). Gold purchases in the fourth quarter of 2012 marked the eighth straight quarter of net purchases by the official sector and the highest level since 1964. Gold’s percentage of total central reserve holdings remained constant at 13% between 2000 and 2012.
While official reserves of the global central banks grew by more than $10 trillion from 2000 to 2012, the U.S. dollar’s share of total reserves fell from 62% to 54% in that same time period. The share of “other” currencies in reserves has tripled in absolute terms since 2008, according to the report.
Gold has a deep and liquid market with no credit risk, making it one of the most attractive assets for central banks to consider as they diversify away from the U.S. dollar and euro, said Ashish Bhatia, manager for government affairs at the WGC.
We’ll begin this week's technical part with the analysis of the US Dollar Index. We will start with the short-term chart (charts courtesy by http://stockcharts.com.)
USD and Euro Indices
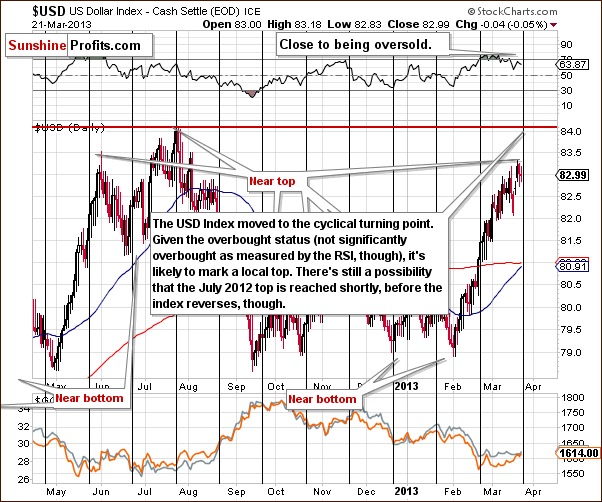
On the above chart we see that the index is at a cyclical turning point and is likely to reverse direction soon, although it is not extremely oversold based on RSI levels. The size of the rally since February 1 without a meaningful correction implies an overbought situation, anyway.
A very short-term move to the upside, possibly to the 84 level, could still be seen. If such a move is seen, this would likely be the final top, and a sharp decline would then probably be seen. The move to the upside may happen, but then again may not, as the index could be oversold enough already, and the cyclical turning point is upon us.
Higher values in the US Index have had no impact on precious metals’ prices recently, though lower index values have been a positive factor for the precious metals. At this time, therefore, the situation in the USD Index continues to be a bullish factor for gold, silver and the gold and silver mining stocks and you can see that directly on the above chart – compare what the USD did in the past few weeks with the performance of gold and silver that you can see in the lower part of the chart.
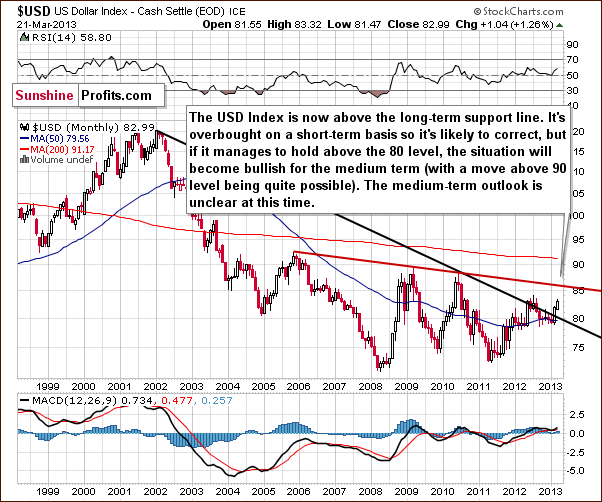
In the very long-term USD Index chart, comments made in last week’s Premium Update remain current:
The breakout here is now quite significant, and we must consider the possibility that the USD Index might move higher in the medium term. The situation in the short term, however, is overbought, so it is likely that we will see the index decline soon and then we’ll see what happens next.
If the correction stops at the declining support line, around the 80 level, then the breakout will be confirmed, and a rally will likely follow. If however, the correction takes the index below the 80 level, the whole breakout will be invalided, and lower values would probably follow. At this time, the medium term and long-term outlooks are somewhat unclear based on this chart alone.
We received a question this week regarding whether the USD Index could move much higher and gold prices significantly lower in the coming months. We feel this is a possibility, especially if the USD Index declines to 80 or 81 and then moves higher once again. In such a scenario, gold prices would almost have to decline, for higher USD Index values has normally had a bearish impact on the precious metals markets.
While such a move in the USD Index is a possibility, it does not seem probable at this time in our view. Not only is the breakout too small so far, but also gold is not reacting to dollar’s strength. We will continue to monitor the currency markets along with the precious metals and report to you accordingly. Once again, much higher values for the dollar and much lower prices for gold do not seem likely to be on the horizon at this time.
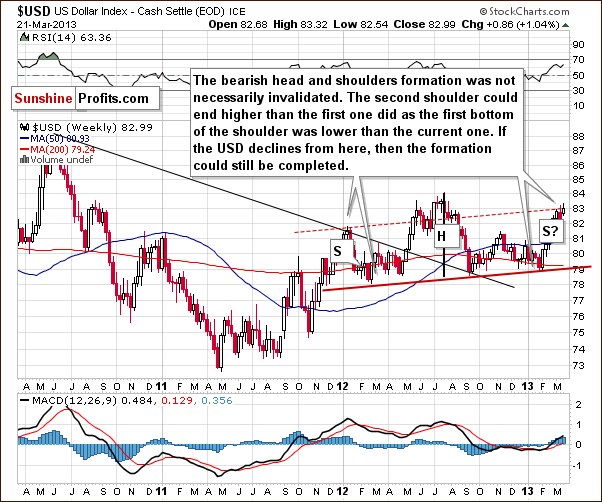
In the medium-term USD Index chart, not much changed in the past seven days, so last week's Premium Update comments remain up-to date:
...the important thing to discuss here is the head-and-shoulders formation. This trading pattern has bearish implications for the USD Index and the question now is whether the formation is still present given the recent rally. We feel the answer is “yes”, because even though the index is now higher than the level of the left shoulder, the full formation is simply a bit skewed.
Local bottoms have been a bit higher each time so it is perhaps quite natural for the second shoulder to be above the first shoulder. Consequently, the formation could still be completed - though not yet - the other should has yet to form. Declines in the index are needed for this to happen, and we feel this could still be seen.
The head-and-shoulders pattern has not yet been invalidated so completion of this trading pattern is still possible.
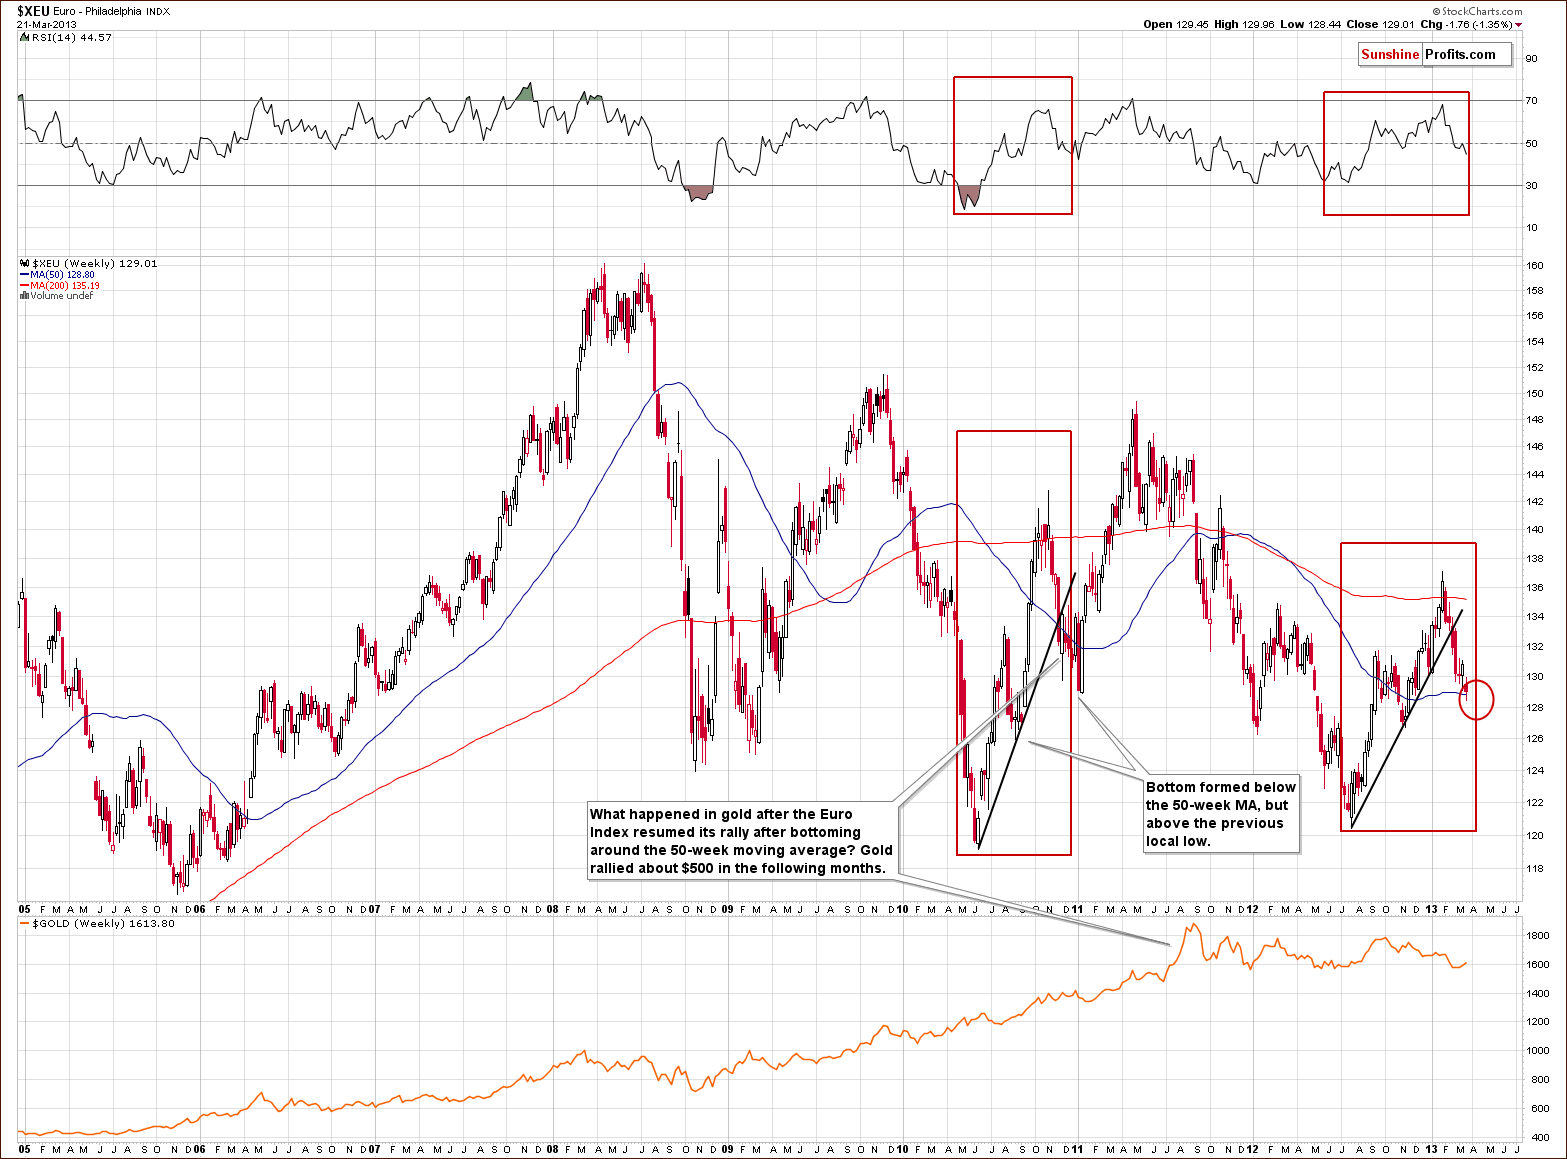
In the long-term Euro Index chart, some of the important points from last week's Premium Updateare repeated here:
The 50-week and 200-week moving averages are currently positioned quite similar to how they were in the 2010-2011 comparison period. The bottom formed around the 50-week moving average and there was some back and forth trading, but the index did not move below the previous local bottom. We can create target levels based on our analysis and we have placed a red ellipse around the 128 level in our chart. It seems unlikely that the euro will decline much further from where it is now before forming a local bottom.
The Euro Index has already moved to the target area, which we illustrated last week. It is also marked on this week’s chart as well. The implications here are just like (though in the opposite direction of) for the short-term USD Index, in that the euro could move a bit lower though not necessarily. A reversal could be seen in the Euro Index immediately just like it is the case with the USD Index.
Additionally, please take a look at the RSI levels here. When compared to those seen in 2010, they are quite similar to the situation back then when the bottom was formed.
Summing up, the local top could be in for the USD Index but some short-term strength is possible in the next several days. The medium-term implications however are positive for the precious metals, and the short-term implications are as well. This is because gold has recently responded positively to the weakness of the dollar but not negatively when the USD Index shows strength.
General Stock Market
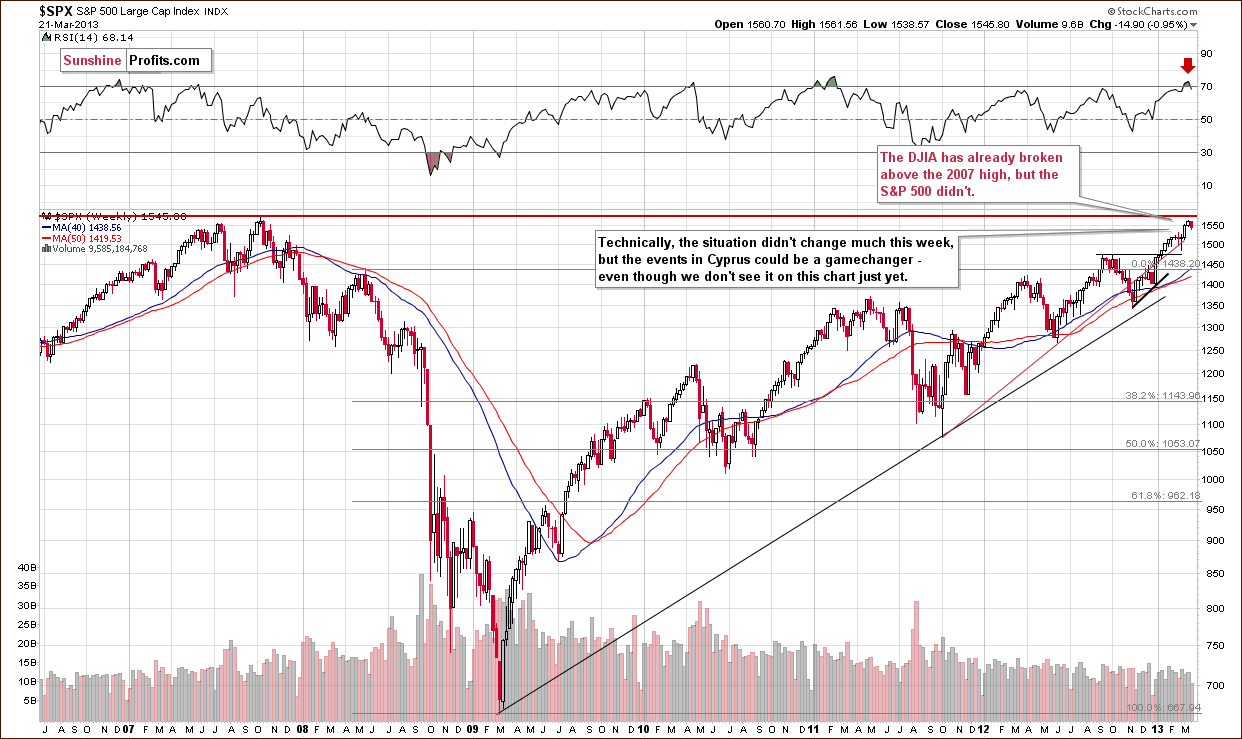
In the long-term S&P 500 Index chart, the situation is much the same as last week as there has been insignificant reaction to the situation in Cyprus. It seems that investors do not view the situation as being important but we think that it is – and we think that the true impact upon the general stock market is likely still ahead. Technically, the situation in this chart improved this week. RSI levels no longer suggest an extremely overbought condition, so higher stock prices could very well be ahead. Once again, Cyprus could be the game changer depending on what happens and how quickly the current situation is resolved.
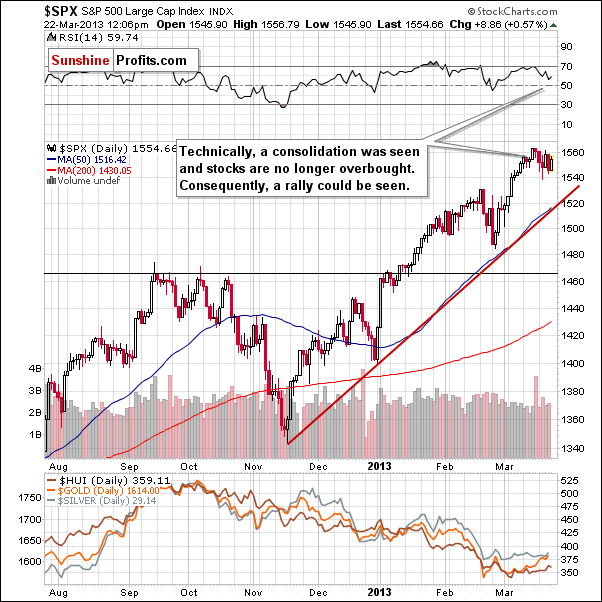
In the medium-term S&P 500 Index chart, we see that RSI levels are now clearly below 60 and some short-term consolidation has already been seen. A similar (in terms of the time that stocks consolidated) late February consolidation was all that was needed for prices to move higher once again. So the situation here actually remains bullish from a technical perspective and will remain so as long as the S&P Index remains above the rising support line (currently at 1,520).
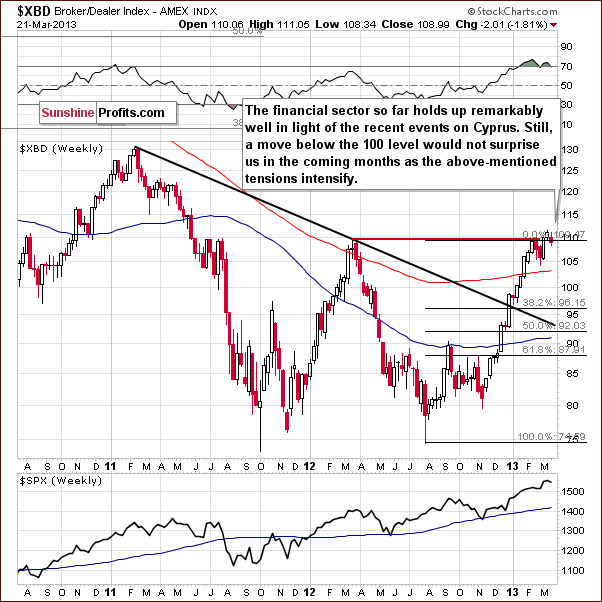
Turning now to the financial sector (Broker/Dealer Index serves as a proxy here), we see that the financials have managed to hold above the 2012 high despite the Cyprus events. This is a positive sign, but with RSI levels close to 70, further consolidation could follow anyway. If we are correct about the Cyprus’ impact still being ahead of us, then financials will likely move lower in the coming weeks.
Summing up, from a technical perspective, the situation in the general stock market improved this week. Stocks consolidated a bit and held relatively well as did the financials. From a pure technical perspective, we should be bullish here but would rather call the situation unclear, because the market appears to have not yet realized the true situation in the Mediterranean Sea.
Gold and Silver Correlations
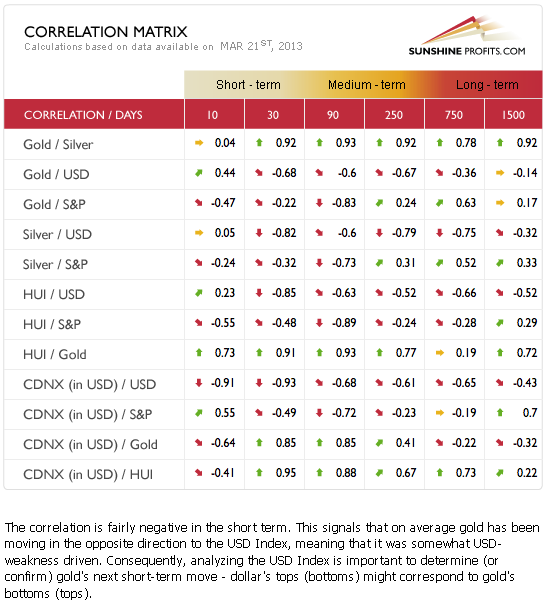
The Correlation Matrix is a tool which we have developed to analyze the impact of the currency markets and the general stock market upon the precious metals sector, (namely: gold and silver correlations). The correlations changed very little in the past week, so the comments made in last week's Premium Updateare still valid:
We have two things which we wish to comment on this week. First, the link between the USD Index and gold is negative for the short and medium term. In daily price moves, however, it seems that what happens in the USD Index has been rather irrelevant. Gold and the precious metals have simply refused to move lower when the dollar moved higher.
Our second point is the negative correlation between the precious metals and the general stock market. The link has not been as strong in the last few days, as gold and the precious metals have not declined, although stock prices were rising. When a correction is seen in the general stock market or a period of consolidation begins, the precious metals sector could respond with higher prices.
At this time it seems that the precious metals are anti-assets, just as gold is a hedge against turmoil in the stock and currency markets. As investors become more optimistic about these markets, they sell their gold. It does not mean that in the long run gold cannot rally along with stocks. For instance, both are fueled by low interest rates and quantitative easing. This tells us that a short-term consolidation in the stock market could easily have a positive impact on gold.
Gold continues to perform well even without help from the USD Index.
Gold
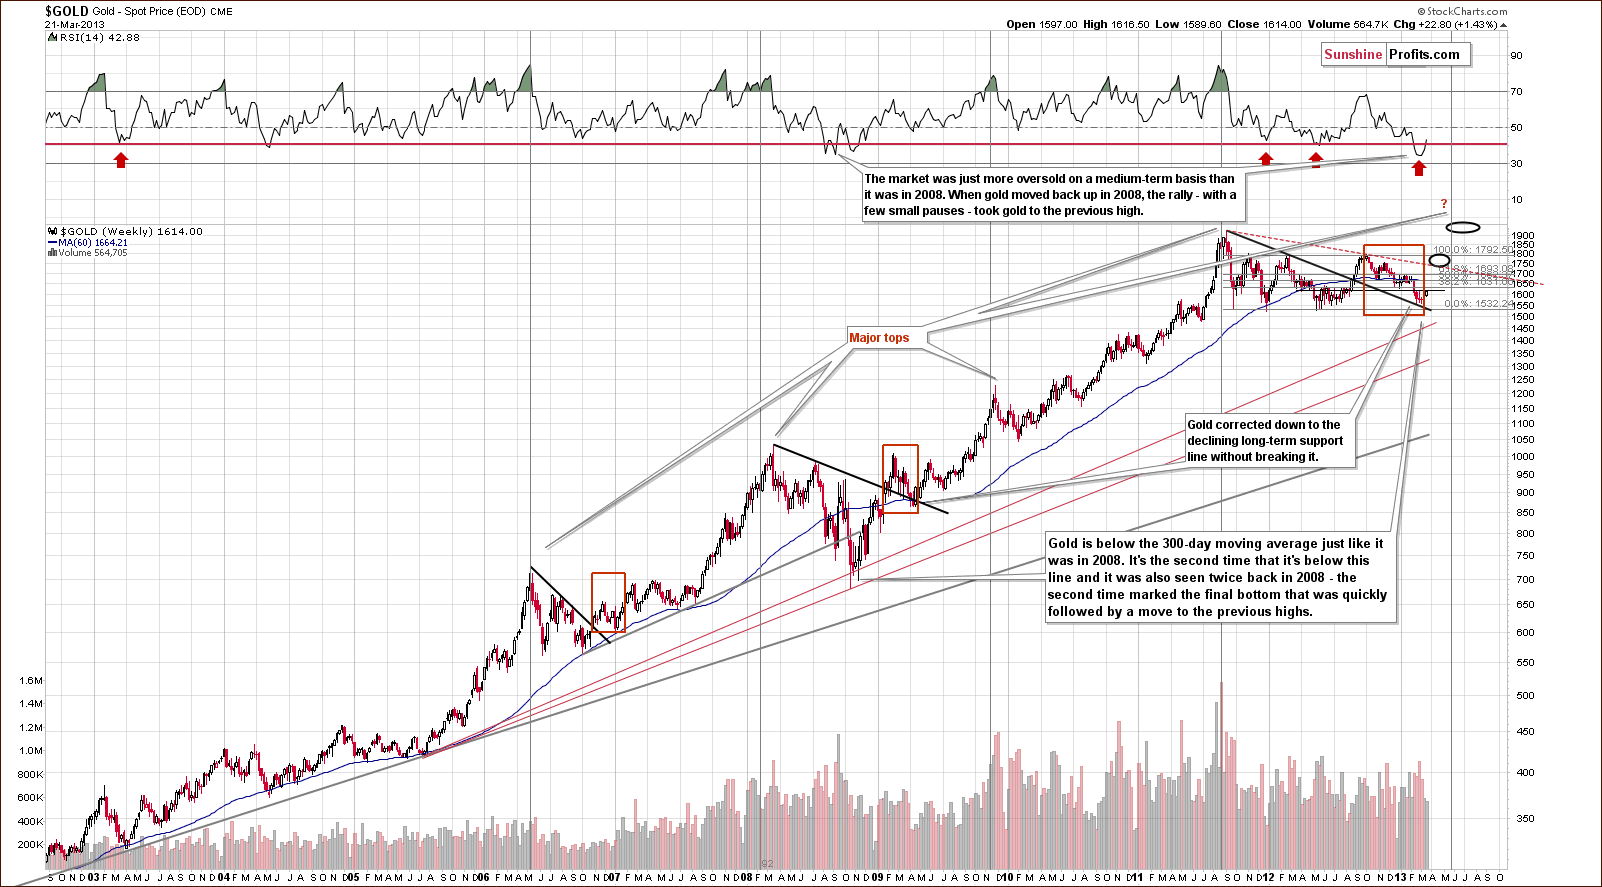
In this week’s very long-term gold chart, we see that gold’s rally is finally visible here, and the RSI levels (based on weekly closing prices) reflect this as well. This indicator is back above the horizontal red line after staying below it for several weeks. This same action was seen back in 2008 and was quickly followed by a significant rally in gold prices. Back then, after the final bottom formed, gold moved to its previous high shortly.
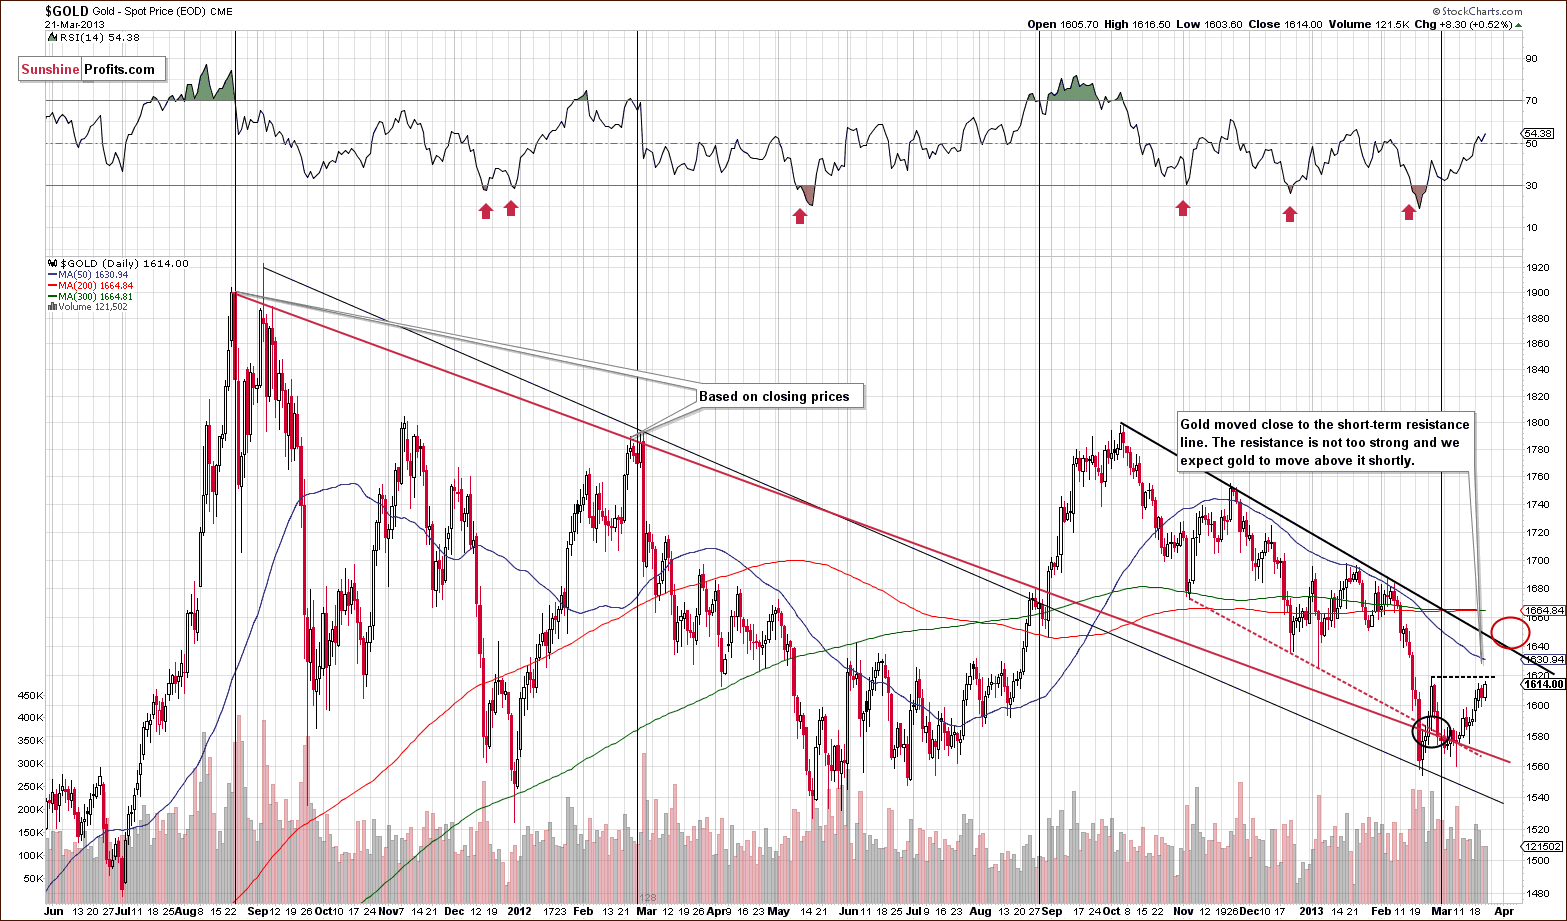
In the medium-term GLD ETF chart, we see that gold is close to its February high. We expect this resistance to be surpassed shortly. If however, we see sideways trading here, a bullish cup-and-handle formation will develop. We continue to expect gold to break above the declining resistance line, move to $1,640 or so, and then consolidate. Afterwards, it seems that another rally is likely.
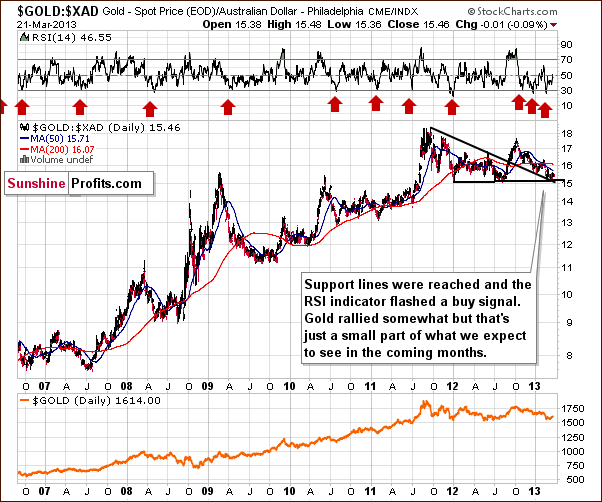
In this week’s chart of gold from the Australian dollar perspective, there are no big changes to speak of, but keeping in mind that gold’s price is still above the medium-term declining support line and above the level of the 2012 bottoms, the outlook here remains bullish.
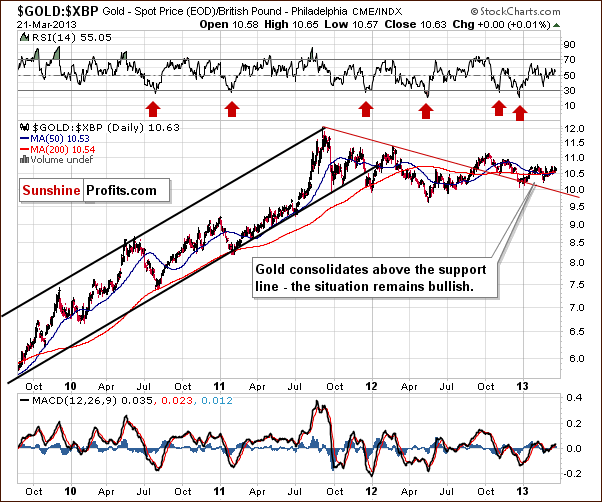
In this week’s chart of gold from the British pound perspective, the outlook also remains bullish. Recently, consolidation has been seen at price levels close to the 50-day and 200-day moving averages and gold help up well.
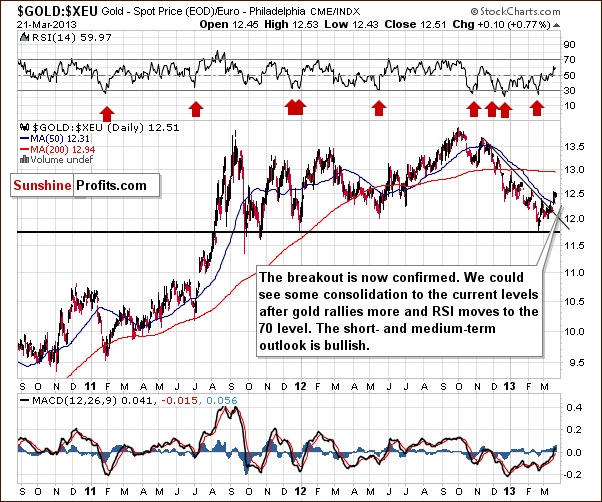
In this week’s chart of gold from the euro perspective, this week saw a break above the declining resistance line early this week. The breakout has been confirmed in terms of range and time. Prices moved high enough to be visible in the long-term perspective and stayed above this line for three consecutive trading days. The situation here is very bullish.
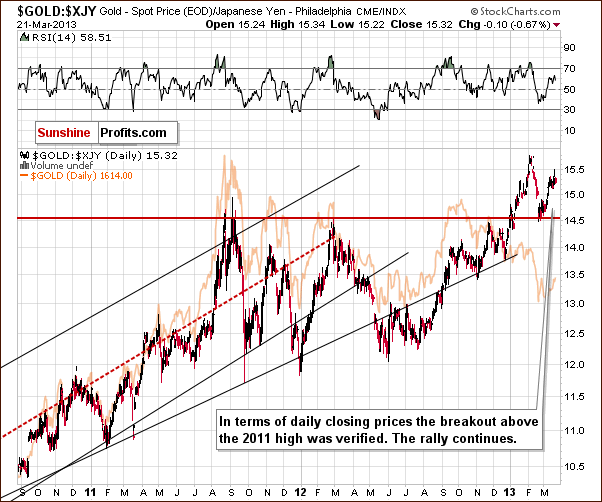
In this week’s chart of gold from the perspective of the Japanese yen, we see yet another bullish chart for gold. The breakout here was clearly verified as we discussed last week, and prices have moved higher once again. From this perspective, gold priced in yen is likely to move above its early February high.
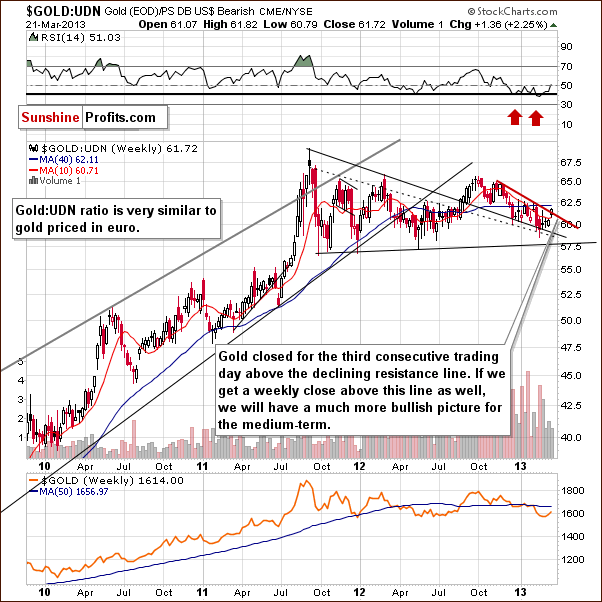
In this week’s chart of gold from the non-USD perspective, we see what amounts to a small breakout so far. Prices are close to but slightly above the declining resistance line and have been for three consecutive trading days. Since this is a long-term chart however, we prefer to see at least one weekly close above this line to say that the breakout is confirmed. This could actually happen today. In any case, the outlook has improved this week from a non-USD perspective.
Summing up, the outlook for gold has improved this week, and if it improves even more in the coming days, we may suggest doubling long positions in the yellow metal.
Platinum
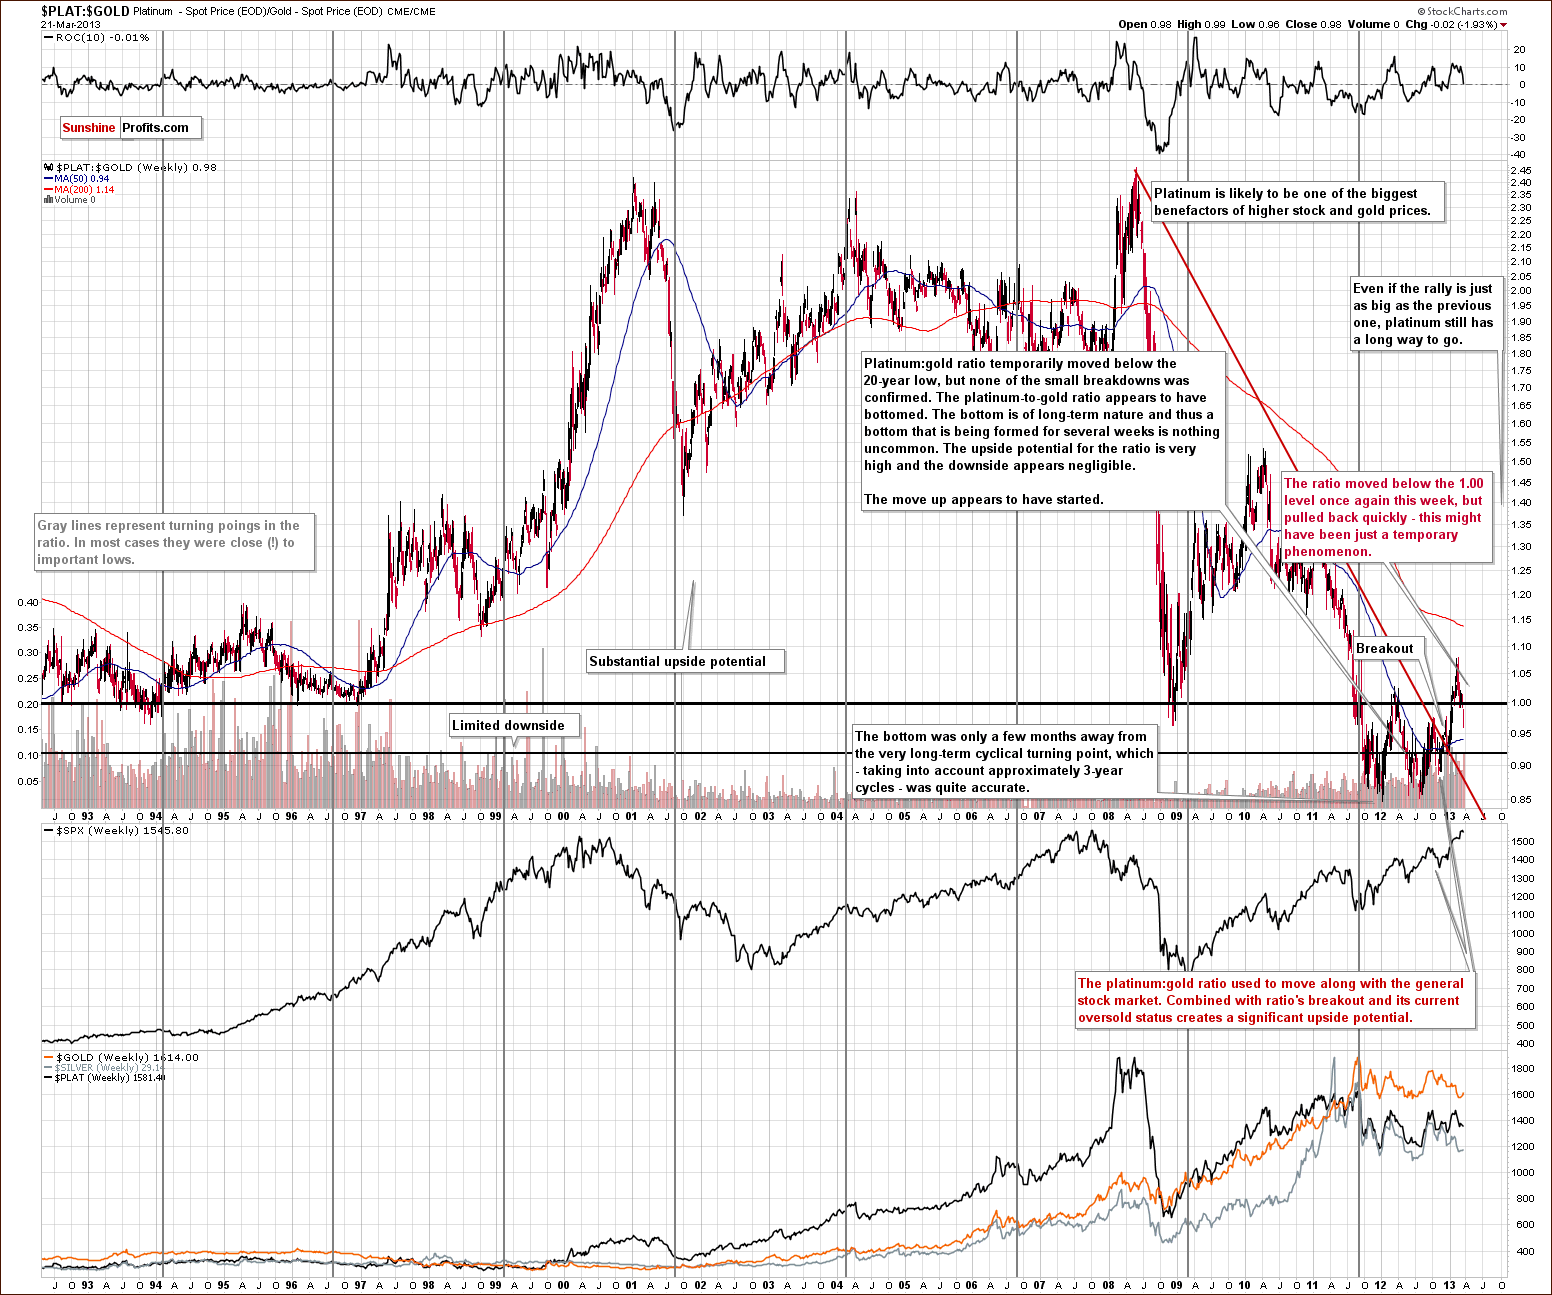
On the above platinum to gold ratio chart, we see that the ratio moved below 1.0 this week but reversed almost immediately. It is now quite close to this very important support-resistance line. At this time, we view this recent move as a rather insignificant phenomenon, but we will continue to monitor the situation here closely, for if stock prices decline, the platinum market could be vulnerable. The outlook for this ratio still appears to be positive at this time, but the comments made in Wednesday’s Market Alert should be kept in mind:
The situation does look concerning for the platinum market as the platinum:gold ratio moves closely in tune with the general stock market - and the positive outlook on the stock market was one of the factors that made us suggest moving from gold to platinum in the previous months. However, Cyprus could be a game changer. It's too early to tell if this should impact your platinum-gold selection, because there's not enough data and because of the plain fact that platinum is one again priced lower than gold which is a 20+ year anomaly.
Silver
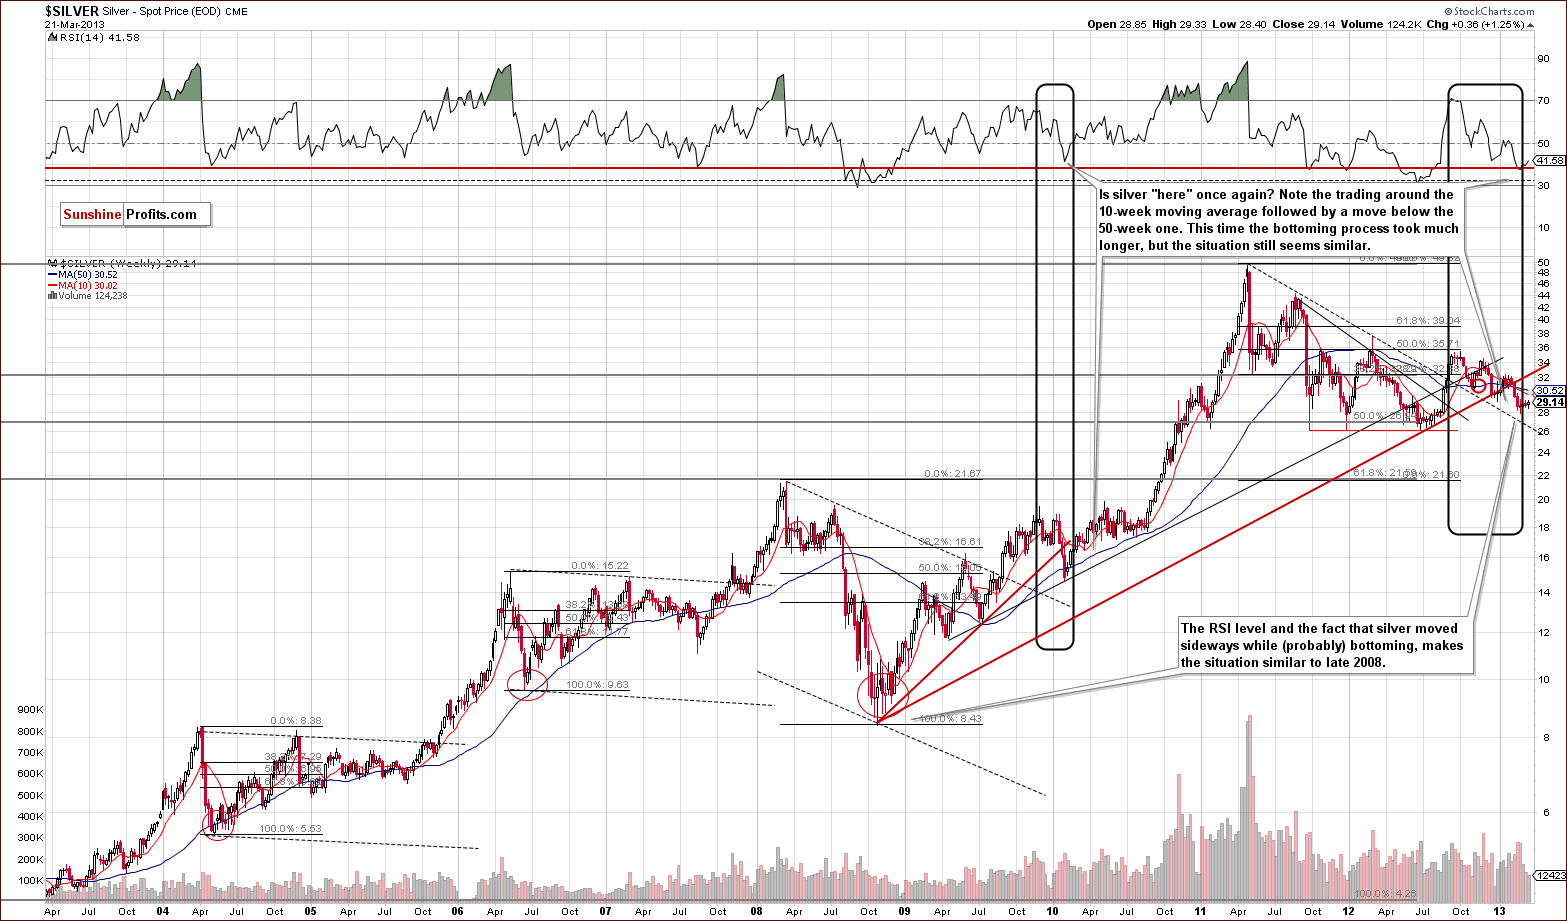
In this week’s very long-term silver chart, silver prices moved higher this week though rather insignificantly from this perspective. The bottom, which appears to have formed, is really more similar to 2008 than 2010. In recent Premium Updates, we have emphasized many reasons as to why the current situation is similar to the 2008 bottom. The shape of the bottom here now is one more of these similarities.
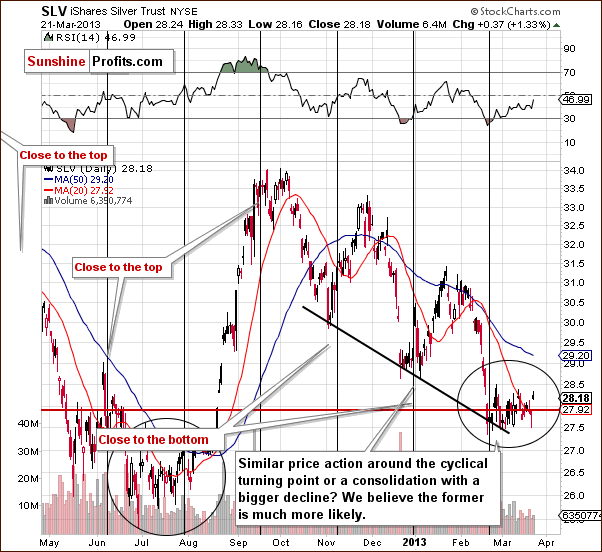
In the medium-term SLV ETF chart, we see another similarity to a previous local bottom. With the current sideways trading pattern, there is a strong resemblance to last July. Back then, when silver prices began to rise, they did so in a very sharp and volatile manner. It may have been difficult to get on the long side of the move as prices rose very quickly. Being long in silver now seems to be a good idea even though the white metal has done little so far this month.
Summing up, the silver market seems to be bottoming and it’s quite possible that once prices begin to rise, they will do so with a vengeance. Being prepared now for a possible strong rally appears to be a good idea.
Gold and Silver Mining Stocks
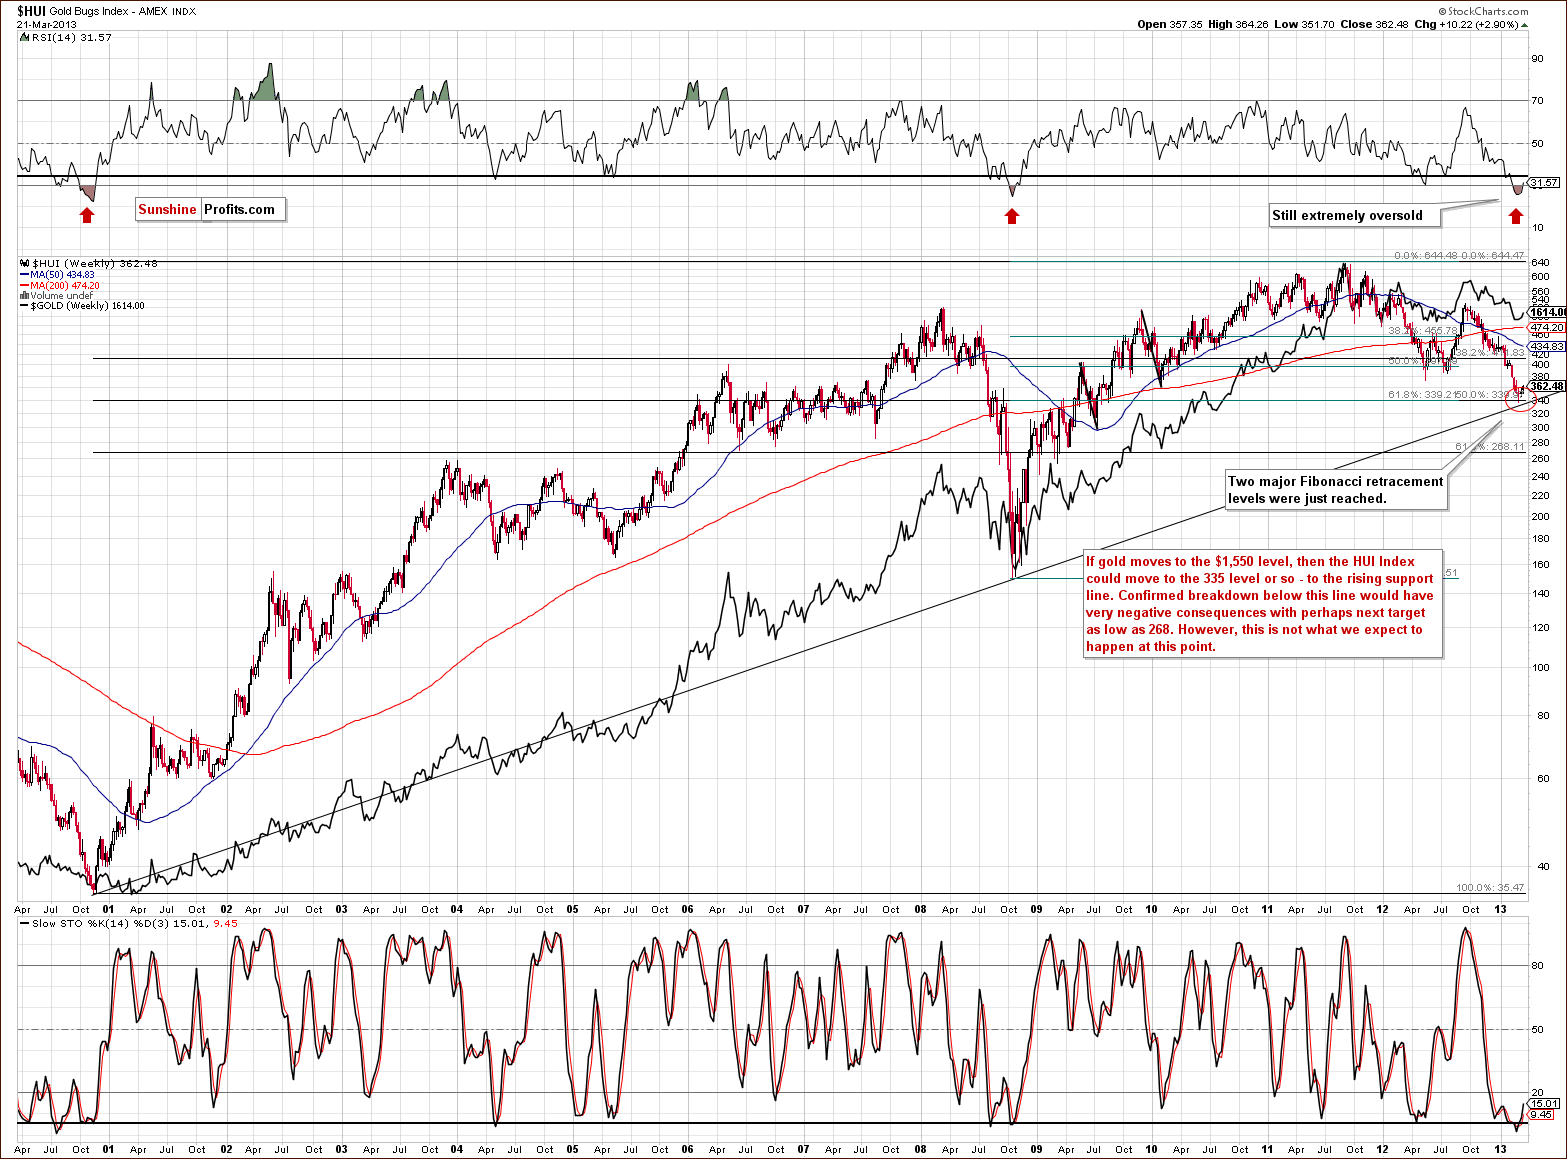
In this week’s very long-term HUI index chart, RSI levels are still significantly oversold even though they are now moving higher. We see only two cases in the past 13 years where gold stocks were so oversold: in 2000 and in 2008. In both cases, when RSI levels began to rise, the following rally in mining stock prices was sharp and took the gold stocks much higher very quickly. At this time, it seems that we could see a retest of the very long-term rising support line here, but as long as the index remains above this line (currently at 335), the situation will remain positive – and the above-mentioned, sharp rally will remain likely.
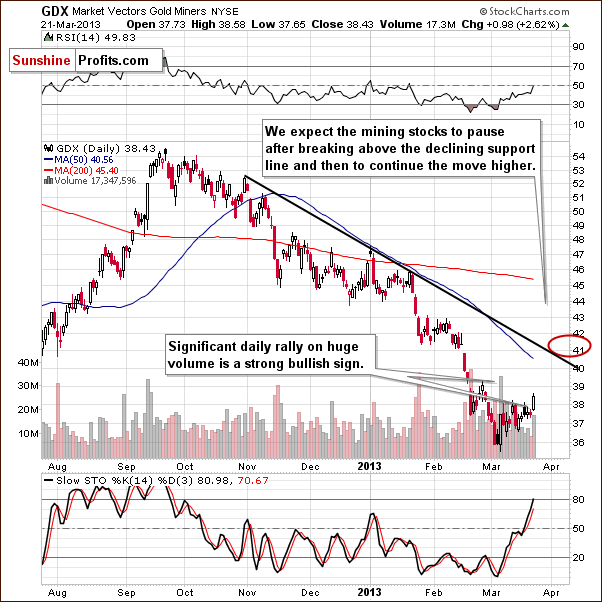
In this week’s GDX ETF chart, we see that RSI levels are no longer oversold and are in fact in the middle of the trading range. This is a bit of a test for the sector as previously, RSI values around 50 have coincided with local tops (most recently in January and last November) and lower prices followed.
Given the analysis of this week’s long-term HUI Index and the relationship between gold prices and the USD Index, it seems that higher mining stocks prices are likely ahead. On Thursday, the GDX ETF rose on relatively high volume and this is a bullish sign for the short term. Quoting from last week's Premium Update, when gold stocks [miners] finally rally, we expect some consolidation around the $41 level, when the declining resistance line is breached, followed by higher prices once again.
Summing up, the outlook for gold and silver mining stocks is bullish at this time.
Letters from Subscribers
Q: Hello, "The fundamentals, such as open-ended QE, have been factored into prices. So ‘higher gold’ needs a new story. Investors are no longer excited about the QE story. If there is no other bullish story (how can a story be more bullish than open-ended QE?), the price of gold price will likely go lower." Could you please comment on this? Thanks! Regards.
A: Yes.
The fundamentals, such as open-ended QE, have been factored into prices.
Yes, we can agree with that. The information has been around for a while, people are aware of that.
So, ‘higher gold’ needs a new story.
Here we disagree. If a story as bullish as open-ended QE doesn't make gold go higher, then what story could? Maybe it's not a new story that is necessary?
Investors are no longer excited about the QE story
Exactly. Investors are no longer excited (!) and that's the whole point. Open-ended QE and other fundamental factors are positive. All that is missing is this "excitement." This is another way of saying that the situation looks good but people just don't want to buy because they are afraid of losing money. Is the fear really rational? If we agree that the fundamentals are positive, then it's not rational - it's purely emotional and caused by extensive consolidation.
If there is no other bullish story (how can a story be more bullish than open-ended QE?), the price of gold will likely go lower.
When the sentiment becomes extreme enough (extremely negative that is), we will see a turnaround even without an additional story. The fundamentals are already great. Now, a great story (Cyprus-led bank run?) could trigger the rally faster, but it's not required for the gold market to move higher in our view.
Q: In light of the action in Cyprus I would also note that gold, like bank deposits, can be seized. Seizing Bitcoin is considerably more difficult. On the other hand, Bitcoin is un-spendable if the internet is not working.
A: Actually, seizing bitcoins would require shutting down a couple of websites (wallets, exchanges). Governments can push some buttons like in the WikiLeaks case.
Having at least some of your gold/silver holdings in physical form (physical gold & silver bullion) and having it diversified geographically, should minimize this risk.
Q: “In the situation when a rally in the dollar means nothing for metals and a decline in the dollar means a rally for metals, staying long metals is a great idea, in our opinion.”
With all due respect, the rally in the dollar is doing a good job on the miners. It's one thing to buy “when there's blood in the streets” - except that here, once again, you are using the fundamentals to justify bucking the trend - instead of working with it.
A: Yes, fundamentally the rising USD might be a good factor for gold miners, but indirect impact seems more important. By that we mean that gold's decline associated with the dollar's short- and medium-term moves can be amplified in the case of mining stocks. (Even though miners didn't provide decent leverage to gold in the past few years, they still do on a short-term basis).
Please take a look at the 1500-trading-day column in our Correlation Matrix on the HUI-USD verse. With a value of -0.52, that's one of the strongest links in that column and the strongest out of the negative ones. Only the relationships between gold-silver, gold-HUI, and junior-miners-general-stock-market are stronger.
Regarding "buying when there's blood on the streets," that's not really a fundamental analysis. That's a generally profitable rule that works well in the case of fundamentals and in the case of technicals.
In the case of fundamentals, you can speak of something dramatically undervalued relative to its theoretical value calculated based on financial statements, economic and financial projections and most of all, cash flow analysis. In the case of the technical analysis, you can see the extreme situations when a stock price is very far from its long-term moving average, and/or multiple indicators are/ have been oversold for some time. You can also conduct an analysis that doesn't fall into any of the above categories, for instance by looking at Google web searches (almost pure sentiment analysis), checking how many times people mention "gold declined" on Twitter and similar.
With all of the above, the point is to isolate moments when "there's blood in the streets" and take advantage of the panic by taking long positions. That's what we think is currently the case with the precious metals market.
Summary
The USD Index is likely to decline in the coming weeks although a very short-term rally could be seen first. This alone makes the outlook bullish for the precious metals as we still have a situation in which gold responds positively to the dollar’s weakness and has little reaction to rallies in the USD Index. The situation in the general stock market is positive from a technical perspective. Taking the Cyprus situation into account however, in our view, makes the overall outlook at least unclear.
Gold recently broke above important resistance lines so when viewed from the euro perspective or when non-USD averages are taken into account, an already bullish situation has improved even further. Overall, the outlook remains bullish for gold, silver and the gold and silver mining stocks, even though silver and the mining stocks have not performed well in recent weeks. Comparing silver’s bottoming process with previous similar cases provides us with a bullish outlook as very sharply rising silver prices are a real possibility. On Thursday, a rally on significant volume for the GDX ETF was seen, and this is short term bullish sign for the sector.
Just before posting (& sending out the notification email) today's Update, we saw gold moving $10 lower and silver moving $0.40 lower. This does not invalidate points made in this update - please note that metals remain well above our stop-loss levels.
Trading – PR: Long position in gold, silver and mining stocks.
Trading – SP Indicators: Long position in gold, silver and mining stocks
Long-term investments: Remain in the market with your precious metals holdings
| Portfolio's Part | Position | Stop-loss / Expiry Date |
|---|---|---|
| Trading: Mining stocks | Long (full) | 328 (HUI) / Mar 29, 2013 (half) |
| Trading: Gold | Long (full) | $1,534 / Mar 29, 2013 (half) |
| Trading: Silver | Long (full) | $27.80 / Mar 29 2013 (half) |
| Long-term investments | Long | - |
This completes this week’s Premium Update. There will be no Premium Update next week due to markets being closed for Good Friday and the Easter holiday. Our next Premium Update is scheduled for April 5, 2013, but we will keep you informed via daily Market Alerts anyway.
We will continue to send out daily Market Alerts through the end of April (at least) and this will keep you updated should our views on the market change.
Thank you for using the Premium Service. Have a great weekend!
Sincerely,
Przemyslaw Radomski, CFA

