

Trading position (short-term; our opinion): No positions are justified from the risk/reward perspective.
Although the last sessions have been pumping oil for new peaks, the major resistance lines stopped the rally to the north once again during yesterday's session. In addition, oil bears have gained one more potential ally. Will they use its interesting possibilities in the coming days?
Let's take a closer look at the charts below (charts courtesy of http://stockcharts.com).
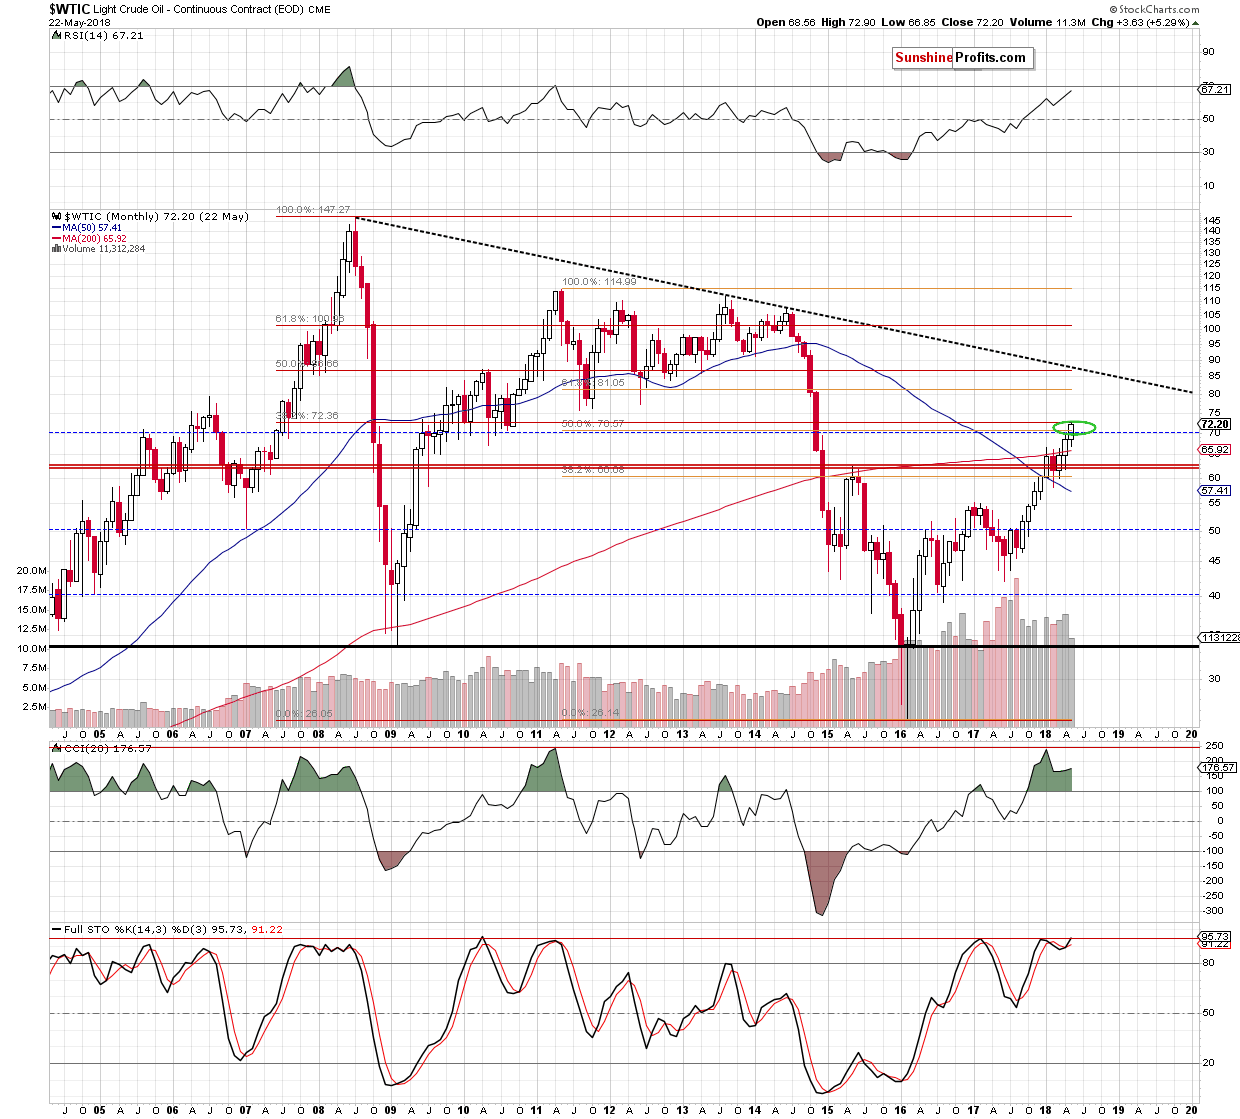
Looking at the above chart, we see that the overall situation in the long term remains unchanged, which means that what we wrote yesterday is up-to-date:
(…) crude oil extended gains and climbed to the upper border of the major resistance zone created by the 50% Fibonacci retracement based on the 2011-2016 downward move and the 38.2% Fibonacci retracement based on the entire 2008-2016 decline (we marked it with the green ellipse on the long-term chart below).
As you see, this area continues to keep gains in check since the beginning of the month, which significantly increases the probability of reversal – especially when we factor in the short-term picture of black gold.
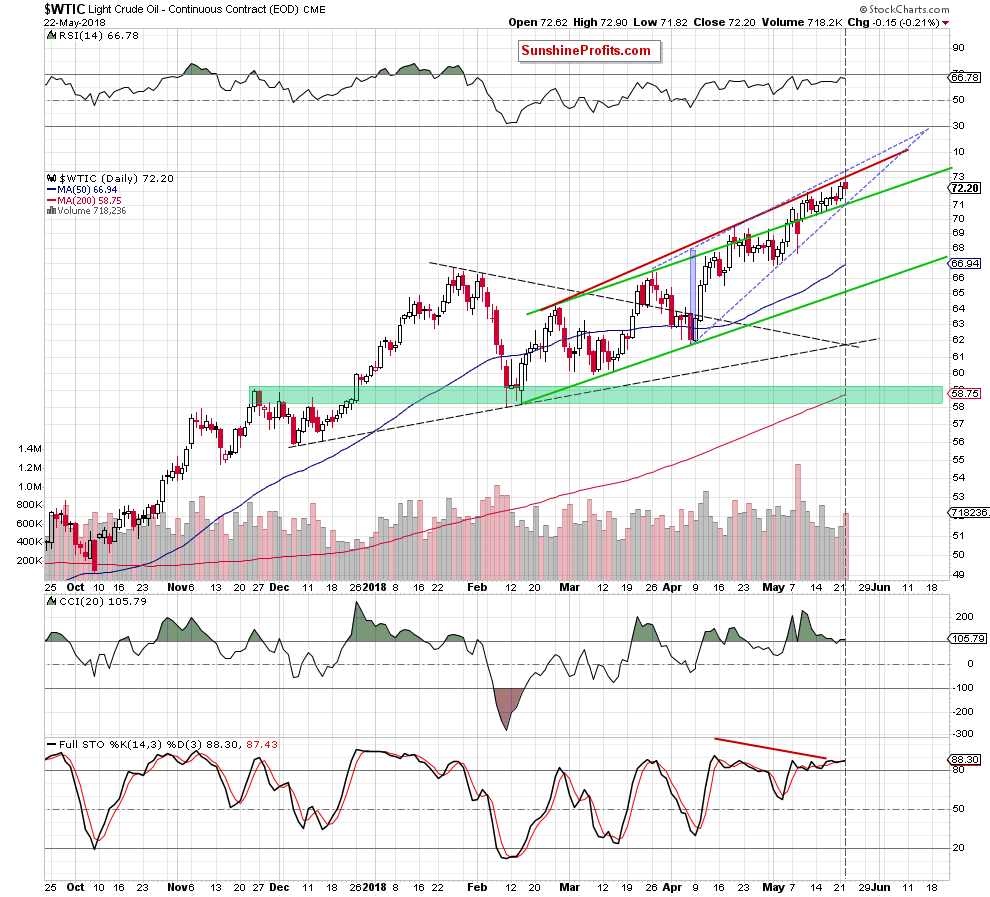
What do we mean by that? Let’s take a look at the daily chart below.
In our last commentary, we wrote the following:
(…) although crude oil moved higher yesterday, the commodity is still trading under the upper border of the blue rising wedge and the red rising resistance line based on the previous highs
Therefore, despite yesterday’s improvement, we continue to believe that as long as there is no breakout above the upper border of the formation or a breakdown below the line of the wedge, another bigger move is not likely to be seen.
On the above chart, you can see that the situation developed in line with the above scenario. Why? Because although black gold went higher a bit during yesterday’s session, the combination of major short-term resistances withstood the buying pressure, triggering a pullback.
Additionally, this drop materialized on the highest volume since May 15, which raises some hopes that oil bears finally are getting stronger, which could result in a breakthrough and solve this stalemate situation that has been tormenting us for almost two weeks.
On top of that, when we take a closer look at the daily chart, we can notice a potential Triangle Apex Reversal Pattern as the intersection of the triangle lines (we marked them with grey dashed lines on the daily chart) takes place currently (in other words, the probability of a reversal increased even more).
Nevertheless, as we mentioned earlier, as long as we don’t see a breakout/breakdown no positions are justified from the risk/reward perspective. As always, we will keep you – our subscribers - informed should anything change, or should we see a confirmation/invalidation of the above.
Thank you.
Nadia Simmons
Forex & Oil Trading Strategist
Przemyslaw Radomski, CFA
Founder, Editor-in-chief, Gold & Silver Fund Manager
Gold & Silver Trading Alerts
Forex Trading Alerts
Oil Investment Updates
Oil Trading Alerts

