

Please note that due to market volatility, some of the key levels may have already been reached and scenarios played out.
Trading position (short-term, our opinion; next support for the dollar index’s continuous futures contract): 91.980-92.200
As we expected last week in our Aug. 24 article, a significant correction of the dollar index (DXY) happened. What does this mean for commodities?
Chart Analysis
Given that the U.S. dollar just broke its three-week low, we may expect a deeper dive for the greenback, which could be finding its next support level (yellow rectangle) around 91.980-92.200 (Fig.1).
The ChikouSpan (lagging line) also clearly broke below the Kumo in 4H. However, in the daily chart, it may encounter some resistance at the daily KijunSen (Fig.2) before crossing through 93.350.
This confirms the current bullish condition for commodities.
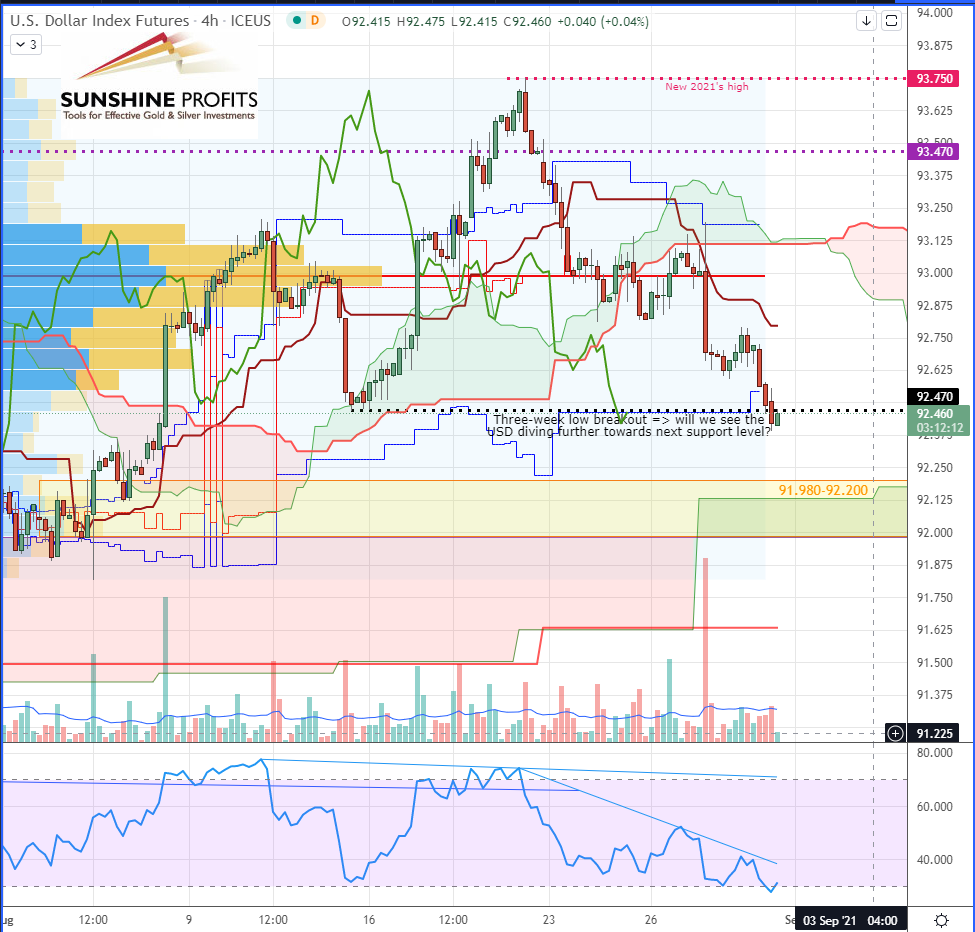
Figure 1 – Dollar Index (DXY) Futures (Continuous contract, 4H)
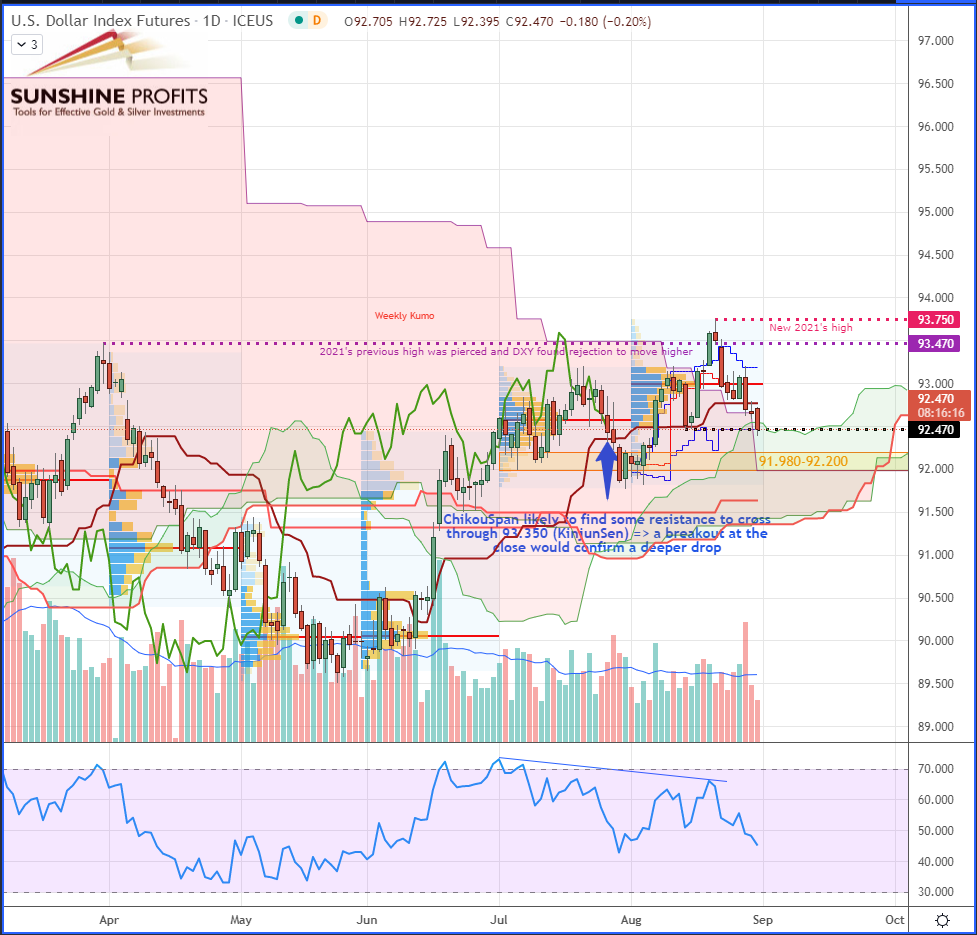
Figure 2 – Dollar Index (DXY) Futures (Continuous contract, daily)
In summary, taking a look at the U.S. dollar gave us some confirmation of a bullish cycle for commodities.
As always, we’ll keep you, our subscribers well informed.
Please note that due to market volatility, some of the key levels may have already been reached and scenarios played out.
Trading position (short-term, our opinion; next support for the dollar index’s continuous futures contract): 91.980-92.200.
Thank you.
Sebastien Bischeri
Oil & Gas Trading Strategist

