

Trading position (short-term; our opinion): No positions are justified from the risk/reward perspective.
On Monday, crude oil moved higher and invalidated earlier breakdown under Fibonacci retracement. Will this positive event encourage oil bulls to push the commodity higher in the coming days?
Let’s jump into the charts and try to find out (charts courtesy of http://stockcharts.com).
Yesterday, we wrote the following:
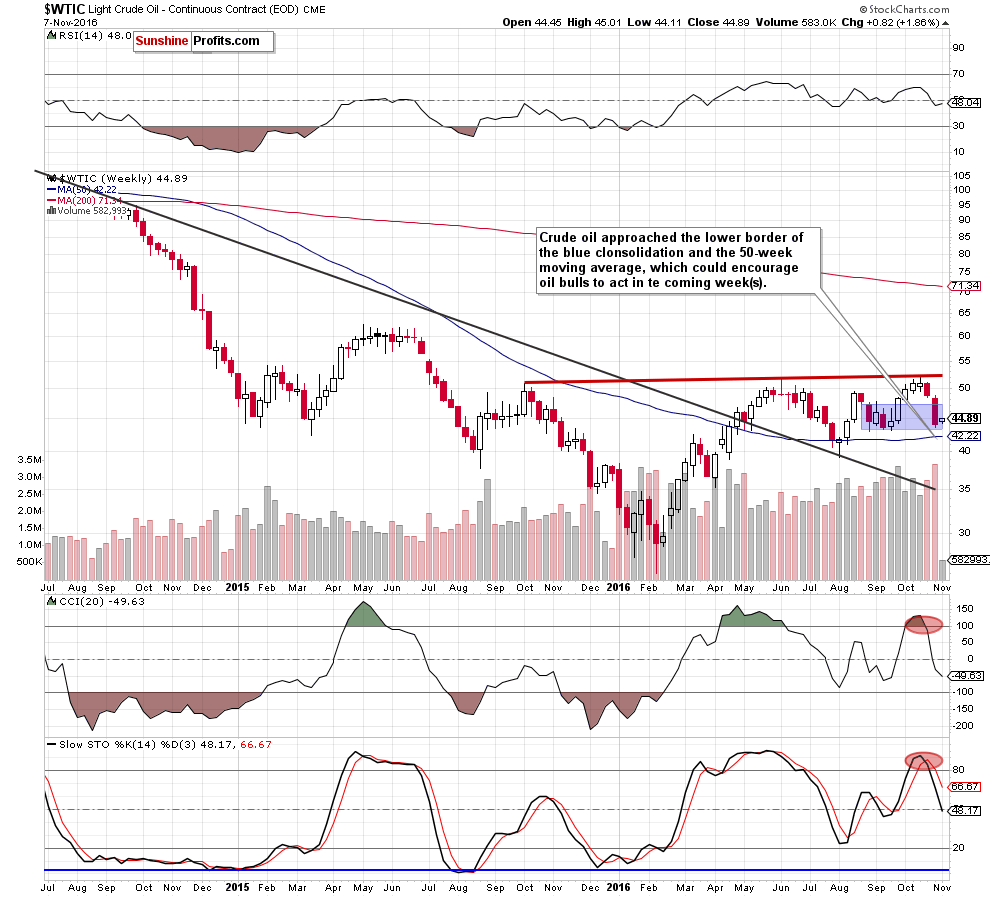
(…) crude oil approached the lower border of the blue consolidation and the 50-week moving average, which could encourage oil bulls to act and trigger a rebound in the coming week.
On the above chart, we see that the situation developed in line with the above scenario and the commodity moved little higher yesterday. How did this increase affect the very short-term chart? Let’s take a look below and find out.
On Friday, we wrote the following:
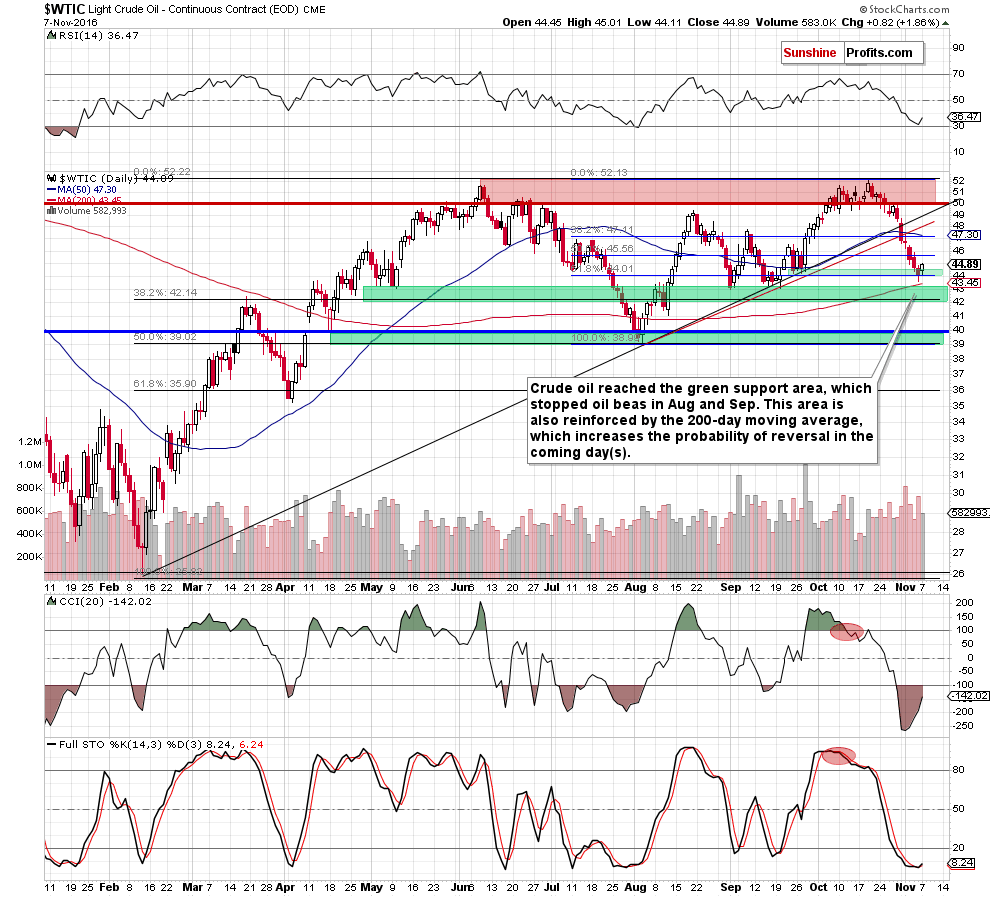
(…) taking into account the fact that there are still no buy signals at the moment, it seems that crude oil could decline even to the next (and much stronger) support zone created by the 38.2% Fibonacci retracement (based on the entire Feb-Oct upward move), late Apr and early May lows, early Aug highs and Sep lows. This area is also supported by the 200-day moving average, which increases the probability of reversal and bigger rebound (in our opinion, to around the previously-broken red and black support/resistance lines) in the coming week.
(…) it’s worth keep in mind that there is a negative divergence between the CCI and the price, while the Stochastic Oscillator dropped to its lowest level since early Aug. Back then similar situation encouraged oil bulls to act, which resulted in a rally above $49.
From today’s point of view, we see that the proximity to the above-mentioned important support zone encouraged oil bulls to act, which resulted in an increase above $44 and the previously-broken 61.8% Fibonacci retracement. In this way, light crude invalidated earlier breakdown below this level, which in combination with a buy signal generated by the Stochastic Oscillator suggests further improvement in the coming days.
This pro-growth scenario is also reinforced by the current picture of the oil-to-stocks ratio.
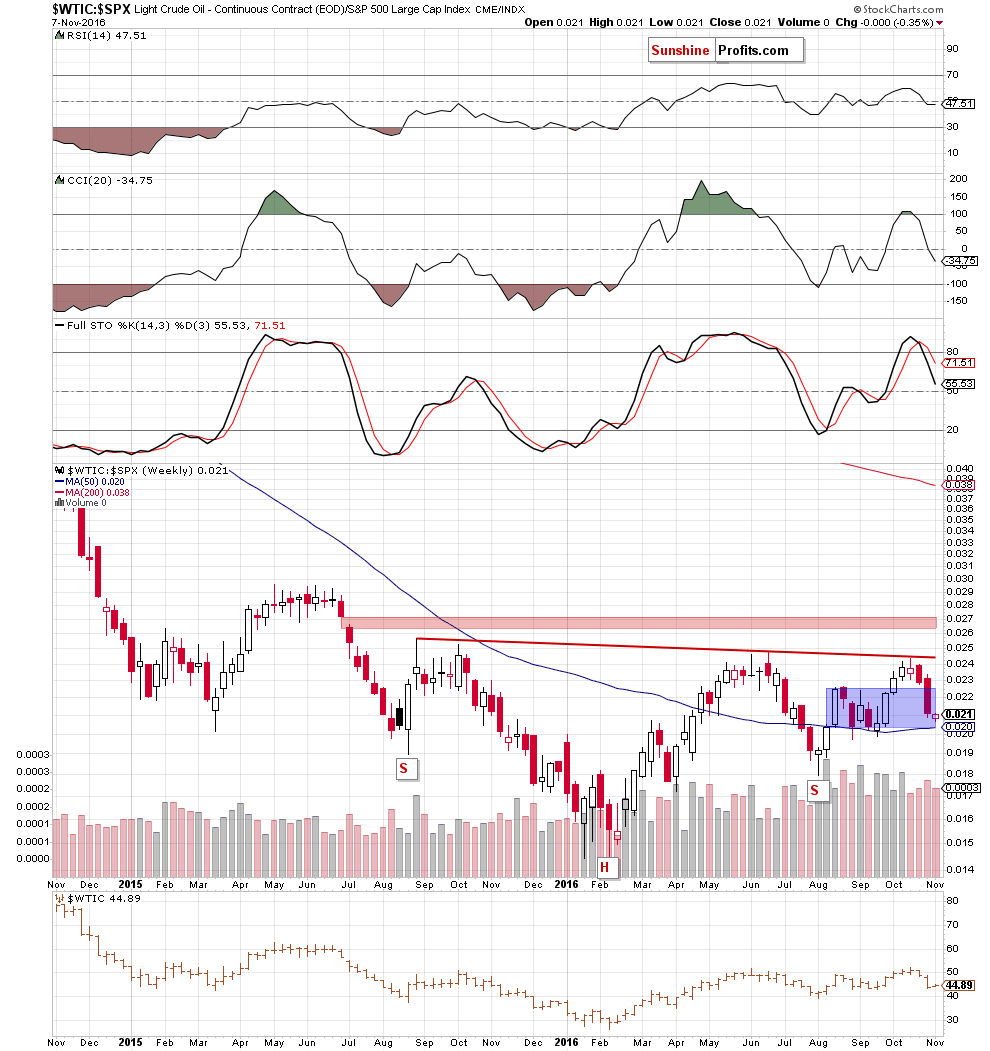
On the weekly chart, we see that the red resistance line based on the Aug 2015 and Jun 2016 highs triggered a decline, which approached the ratio to the lower border of the blue consolidation (an invalidation of a breakout, which is a negative signal) and the 50-week moving average.
What impact did this drop have on the very short-term chart? Let’s check.
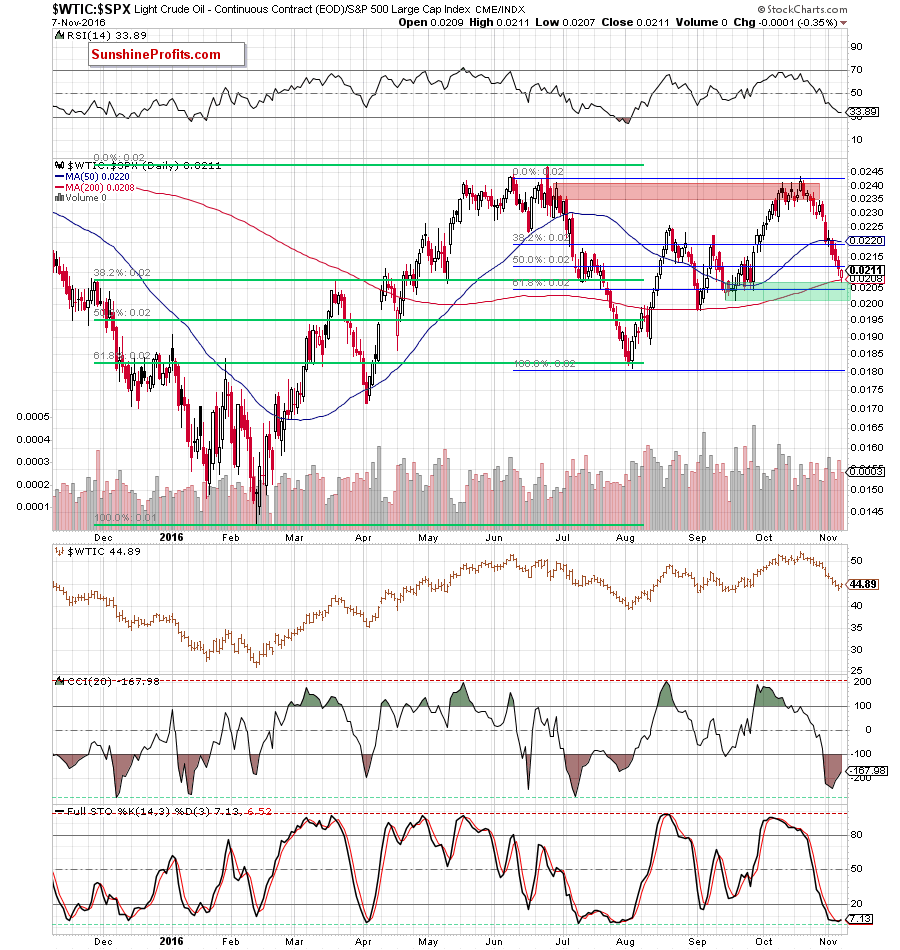
From the daily perspective, we see that the red resistance zone in combination with sell signals generated by the indicators and the medium-term picture encouraged bears to act, which resulted in a decline to the 50% Fibonacci retracement. Thanks to this drop, the ratio approached the green support zone created by the Sep lows and reinforced by the 200-day moving average and the 61.8% retracement, which suggests that the space for declines may be limited – especially when we factor in the current position of the indicators (a positive divergence between the CCI and the ratio, the RSI slightly above the level of 30 and the Stochastic Oscillator at its lowest level since months). Taking all the above into account, we think that higher values of the ratio (and also crude oil as strong positive correlation remains in cards) should not surprise us in the coming week(s).
Nevertheless, finishing today’s alert, please keep in mind that the size of rebound is quite small, the Stochastic Oscillator remains well below the level of 20 and the CCI is still oversold, which means that a re-test of yesterday’s low and the 200-day moving average can’t be ruled out.
Summing up, crude oil moved higher and invalidated earlier breakdown under the 61.8% Fibonacci retracement, which in combination with the current picture of the oil-to-stocks ratio and a buy signal generated by the daily Stochastic Oscillator suggests that higher prices of the black gold are just around the corner.
Very short-term outlook: mixed
Short-term outlook: mixed with bullish bias
MT outlook: mixed
LT outlook: mixed
Trading position (short-term; our opinion): No positions are justified from the risk/reward perspective. We will keep you – our subscribers – informed should anything change.
Thank you.
Nadia Simmons
Forex & Oil Trading Strategist
Przemyslaw Radomski, CFA
Founder, Editor-in-chief, Gold & Silver Fund Manager
Gold & Silver Trading Alerts
Forex Trading Alerts
Oil Investment Updates
Oil Trading Alerts

