

Trading position (short-term; our opinion): No positions are justified from the risk/reward perspective.
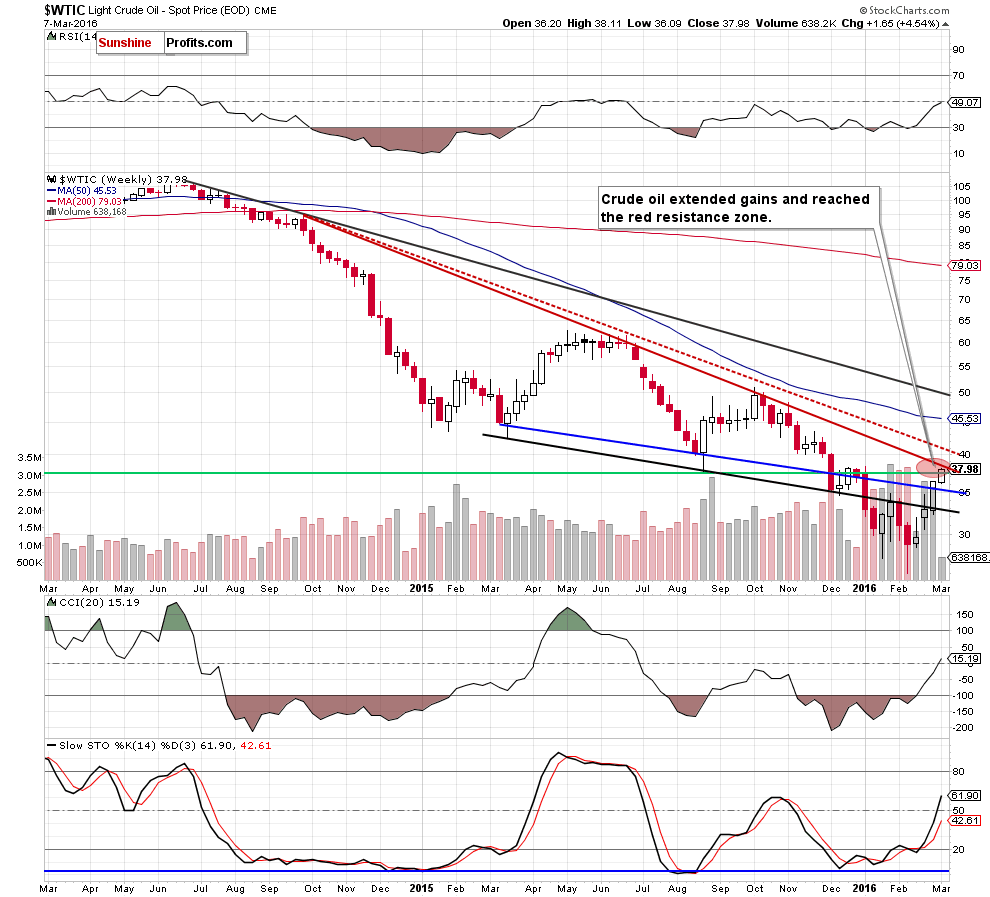
On Monday, crude oil gained 4.54% after rumors that OPEC producers are going to stabilize the price of the commodity at $50 per barrel. In this environment, light crude climbed to an intraday high of $38.11, reaching an important resistance zone. Will it withstand the buying pressure in the coming days?
Let’s take a look at the charts and find out (charts courtesy of http://stockcharts.com).
Yesterday, we wrote the following:
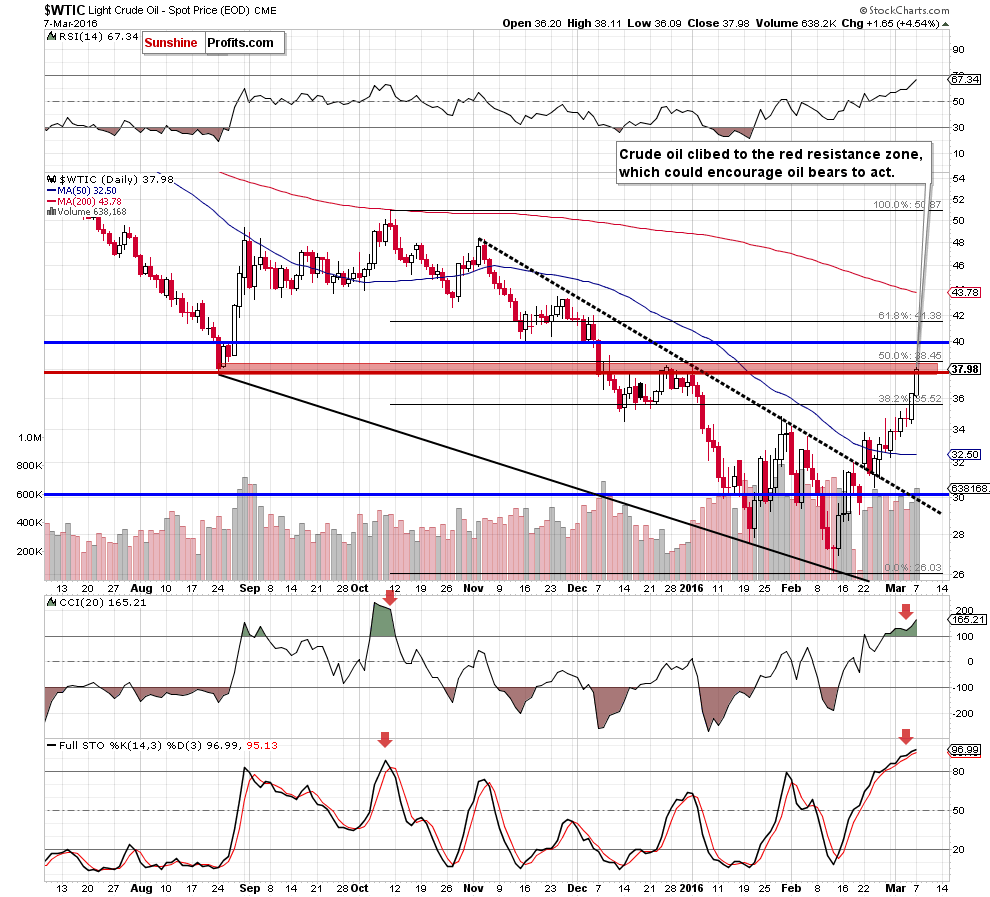
(…) crude oil extended gains and climbed above the 38.2% Fibonacci retracement on Friday. With this move, light crude also increased above the Dec low, invalidating earlier breakdown, which suggests further improvement in the coming days. How high could the commodity go? As you see on the above chart, the initial upside target would be around $37.75-$38.45, where the red horizontal line (based on the Aug low), the late Dec and Jan highs and the 50% Fibonacci retracement (based on the Oct-Feb downward move) are.
Looking at the charts, we see that the situation developed in line with the above scenario and crude oil reached the red resistance zone yesterday. Taking this fact into account and combining it with the current position of the indicators (they climbed to the highest levels since Oct and the Stochastic Oscillator is very close to generating a sell signal), we think that reversal and lower values of the commodity are just around the corner (even if we see an increase to the 50% Fibonacci retracement at $38.45). Nevertheless, such price action would be more reliable if light crude declines under the Aug low once again.
Finishing today’s Oil Trading Alert, let’s take a look at the current picture of DWTI.
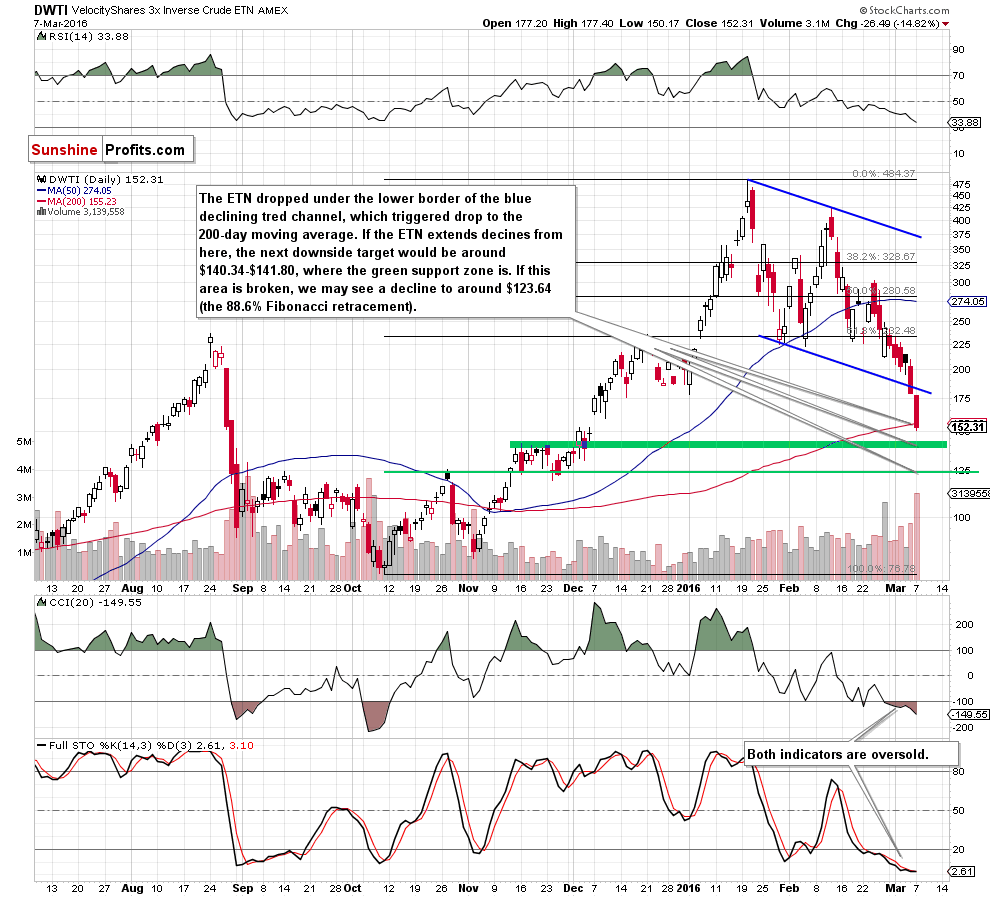
Looking at the daily chart, we see that the ETN declined under the lower border of the blue declining trend channel, which resulted in a drop slightly below the 200-day moving average. If the ETN extends declines from here, the next downside target would be around $140-$141.80, where the green support zone based on the Nov highs is. At this point it is worth noting that the CCI and Stochastic Oscillator are overbought, while the RSI approached the level of 30, which suggests that a reversal might be just around the corner.
Having said the above, let’s examine the weekly chart and find out what impact did the recent declines have on the medium-term picture.
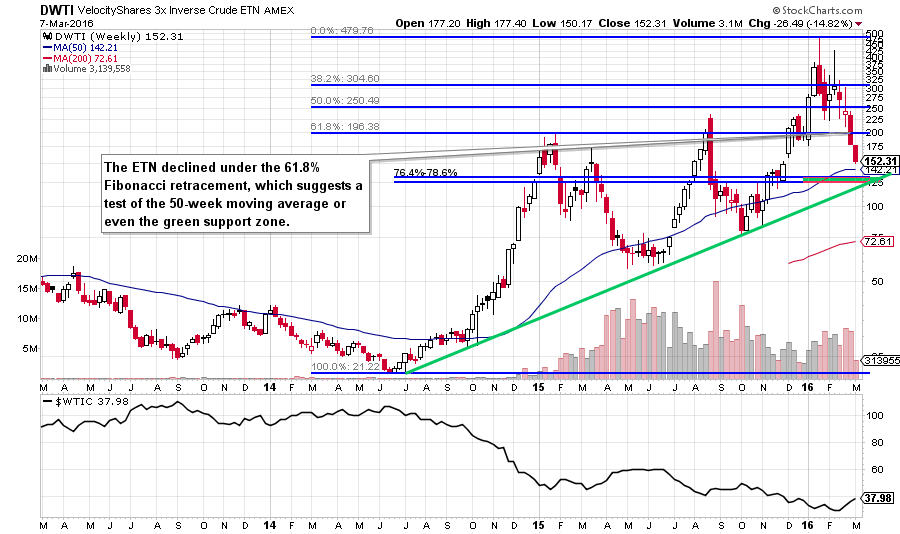
From this perspective, we see that the ETN declined under the 61.8% Fibonacci retracement, which suggests a test of the 50-week moving average (currently at $142.21, which reinforces the green support zone marked on the daily chart) in the coming days. Nevertheless, even if we see a drop under this support, the space for declines seems limited as the green support zone (based on the 76.4% and 78.6% Fibonacci retracement levels) and the long-term rising green support line are quite close.
Summing up, crude oil extended gains and reached the first important resistance zone (created by the Aug low, the late Dec and Jan highs and the 50% Fibonacci retracement), which could encourage oil bears to act and trigger a reversal in the very near future.
Very short-term outlook: mixed with bearish bias
Short-term outlook: mixed with bearish bias
MT outlook: mixed
LT outlook: mixed
Trading position (short-term; our opinion): No positions are justified from the risk/reward perspective. We will keep you – our subscribers – informed should anything change.
Thank you.
Nadia Simmons
Forex & Oil Trading Strategist
Przemyslaw Radomski, CFA
Founder, Editor-in-chief
Gold & Silver Trading Alerts
Forex Trading Alerts
Oil Investment Updates
Oil Trading Alerts

