

Trading position (short-term; our opinion): No positions are justified from the risk/reward perspective.
On Friday, crude oil extended gains as the combination of a weaker greenback and another drop in U.S. oil rigs encouraged investors to buy. As a result, light crude climbed above important resistance line and closed the day above $36. What’s next?
On Friday, the U.S. Labor Department reported that average hourly earnings dropped by 0.1% in the previous month, which was the first monthly decline in more than a year. These disappointing numbers pushed the USD Index to an intraday low of 97.03, making crude oil less expensive for buyers holding other currencies. Additionally, the Baker Hughes report showed that U.S. oil rigs dropped by 8 to 392 for the week ending on Feb. 26, posting the 11th consecutive week of declines. This drop pushed the rig count to its lowest level since Dec. 4, 2009, which supported the price of the commodity. As a result, light crude climbed above important resistance line and closed the day above $36. What’s next? Let’s take a look at the charts and find out (charts courtesy of http://stockcharts.com).
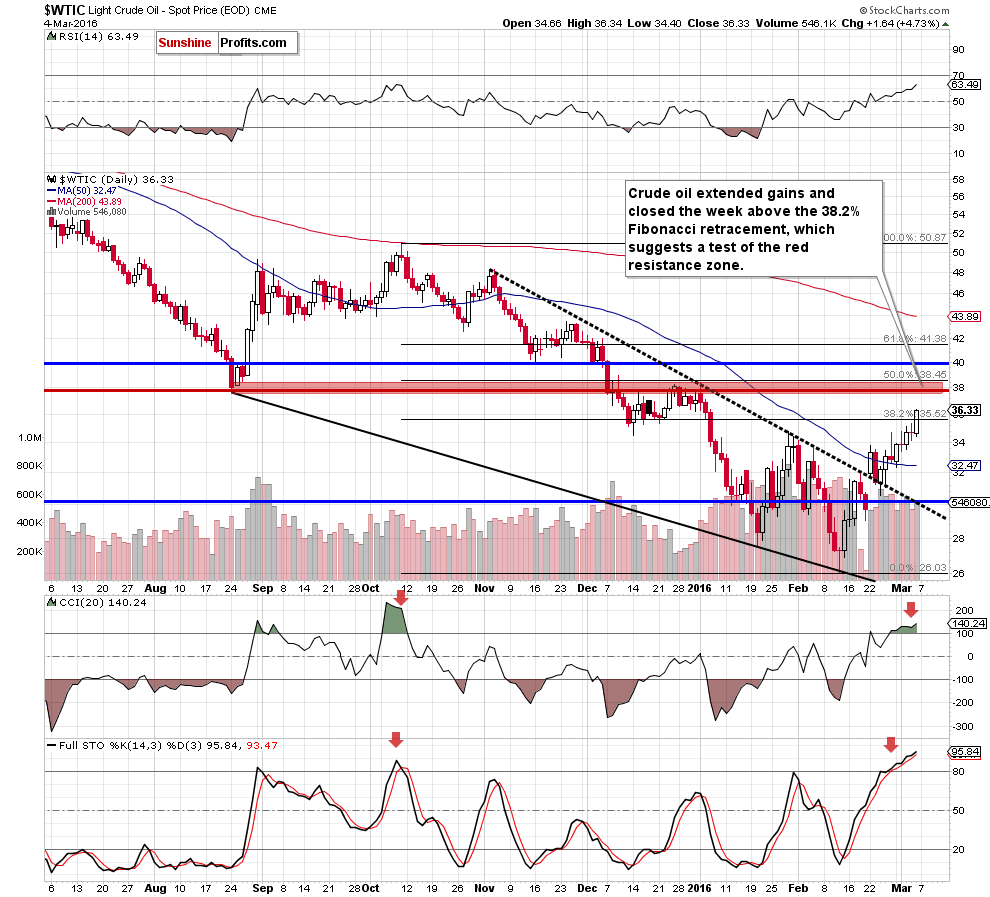
Looking at the daily chart, we see that crude oil extended gains and climbed above the 38.2% Fibonacci retracement on Friday. With this move, light crude also increased above the Dec low, invalidating earlier breakdown, which suggests further improvement in the coming days. How high could the commodity go? As you see on the above chart, the initial upside target would be around $37.75-$38.45, where the red horizontal line (based on the Aug low) , the late Dec and Jan highs and the 50% Fibonacci retracement (based on the Oct-Feb downward move) are.
How did this increase affect the medium-term picture? Let’s check.
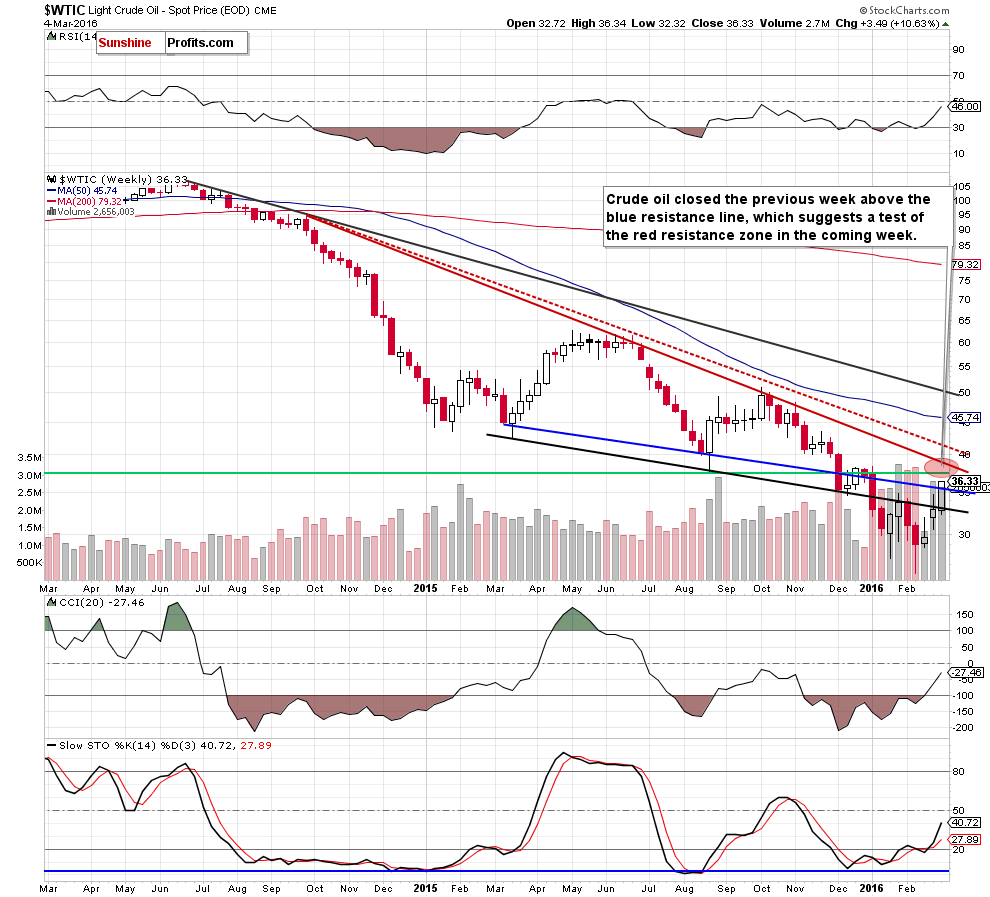
The first thing that catches the eye on the above chart is a breakout above the blue resistance line. This is a positive signal, which suggests that we’ll see a test of the red resistance zone (created by the Aug lo and the red declining resistance line) in the coming week.
Summing up, on Friday, crude oil moved sharply higher, breaking above the 38.2% Fibonacci retracement and the medium-term resistance line, which suggests further improvement in the coming days. Nevertheless, the space for further gains seems limited as the nearest resistance zone is quite close.
Very short-term outlook: mixed
Short-term outlook: mixed
MT outlook: mixed
LT outlook: mixed
Trading position (short-term; our opinion): No positions are justified from the risk/reward perspective. We will keep you informed should anything change, or should we see a confirmation/invalidation of the above.
We will keep you – our subscribers – informed should anything change.
As a reminder – “initial target price” means exactly that – an “initial” one, it’s not a price level at which we suggest closing positions. If this becomes the case (like it did in the previous trade) we will refer to these levels as levels of exit orders (exactly as we’ve done previously). Stop-loss levels, however, are naturally not “initial”, but something that, in our opinion, might be entered as an order.
Since it is impossible to synchronize target prices and stop-loss levels for all the ETFs and ETNs with the main market that we provide this level for (crude oil), the stop-loss level and target price for popular ETN and ETF (among other: USO, DWTI, UWTI) are provided as supplementary, and not as “final”. This means that if a stop-loss or a target level is reached for any of the “additional instruments” (DWTI for instance), but not for the “main instrument” (crude oil in this case), we will view positions in both crude oil and DWTI as still open and the stop-loss for DWTI would have to be moved lower. On the other hand, if crude oil moves to a stop-loss level but DWTI doesn’t, then we will view both positions (in crude oil and DWTI) as closed. In other words, since it’s not possible to be 100% certain that each related instrument moves to a given level when the underlying instrument does, we can’t provide levels that would be binding. The levels that we do provide are our best estimate of the levels that will correspond to the levels in the underlying assets, but it will be the underlying assets that one will need to focus on regarding the sings pointing to closing a given position or keeping it open. We might adjust the levels in the “additional instruments” without adjusting the levels in the “main instruments”, which will simply mean that we have improved our estimation of these levels, not that we changed our outlook on the markets.
Thank you.
Nadia Simmons
Forex & Oil Trading Strategist
Przemyslaw Radomski, CFA
Founder, Editor-in-chief
Gold & Silver Trading Alerts
Forex Trading Alerts
Oil Investment Updates
Oil Trading Alerts

