

Trading position (short-term; our opinion): Short positions (with a stop-loss order at $35.63 and a price target at $25.63) are justified from the risk/reward perspective.
On Thursday, crude oil gained 4.85% as rumors of OPEC output cuts and a weaker U.S. dollar supported the price. As a result, light crude climbed to the mid-Dec low and important medium-term resistance line. Verification of breakdowns or further rally?
Ongoing rumors that OPEC could meet with members outside the cartel to cut production and reduce the supply glut on the oil market continued to support the price of the commodity yesterday. Additionally, mixed U.S. data weakened the greenback and pushed it below the level of 99, making crude oil more attractive for buyers holding other currencies. Thanks to these circumstances, light crude climbed to the mid-Dec low and important medium-term resistance line. Despite this improvement, the commodity gave up some gains and slipped under $34. Does this price action suggest a verification of breakdowns and reversal? Let’s examine charts and find out (charts courtesy of http://stockcharts.com).
Yesterday, we wrote the following:
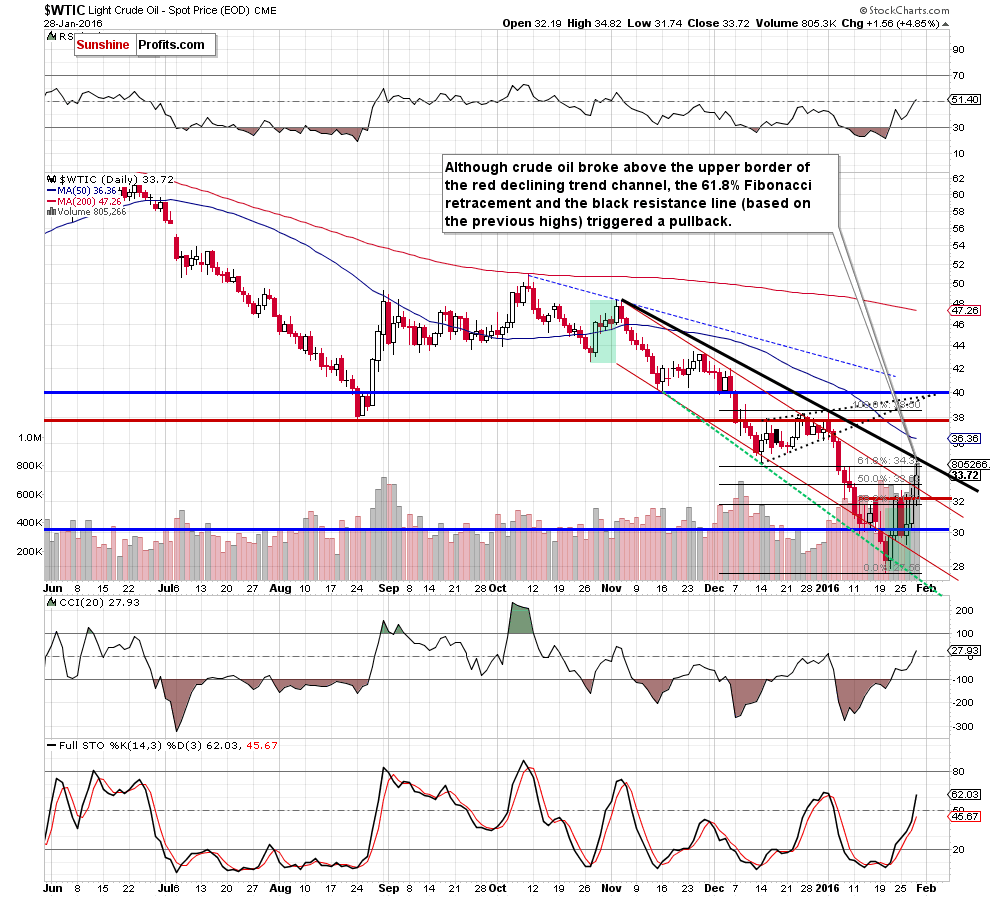
(…) If (…) light crude breaks above the upper border of the red declining trend channel, the next target for oil bulls would be the 61.8% Fibonacci retracement or even the mid-Dec low of $34.53.
On the daily chart, we see that the situation developed in line with the above scenario and crude oil climbed not only to the Fibonacci retracement, but also reached our next upside target, hitting an intraday high of $34.82. Despite this improvement, oil bulls didn’t manage to hold gained levels, which resulted in a pullback. In our opinion, such price action looks like a verification of the breakdown below the mid-Dec low, which is a negative signal that suggests further deterioration. When we take a closer look at the daily chart, we notice that yesterday’s drop invalidated earlier breakout above the 61.8% Fibonacci retracement, which suggests that oil bears will probably use this fact to push the price lower. Additionally, when we compare the size of both upswings (increase from the Jan 20 low to Jan 25 high and the move from the Jan 26 low to yesterday’s high), we see that they are quite similar, which in combination with the black resistance line (based on the Nov and Jan highs), which serves as the key short-term resistance increases the probability of the reversal in the coming day.
Having said that, let’s check how the recent increase affected the medium-term perspective.
Quoting our Monday’s alert:
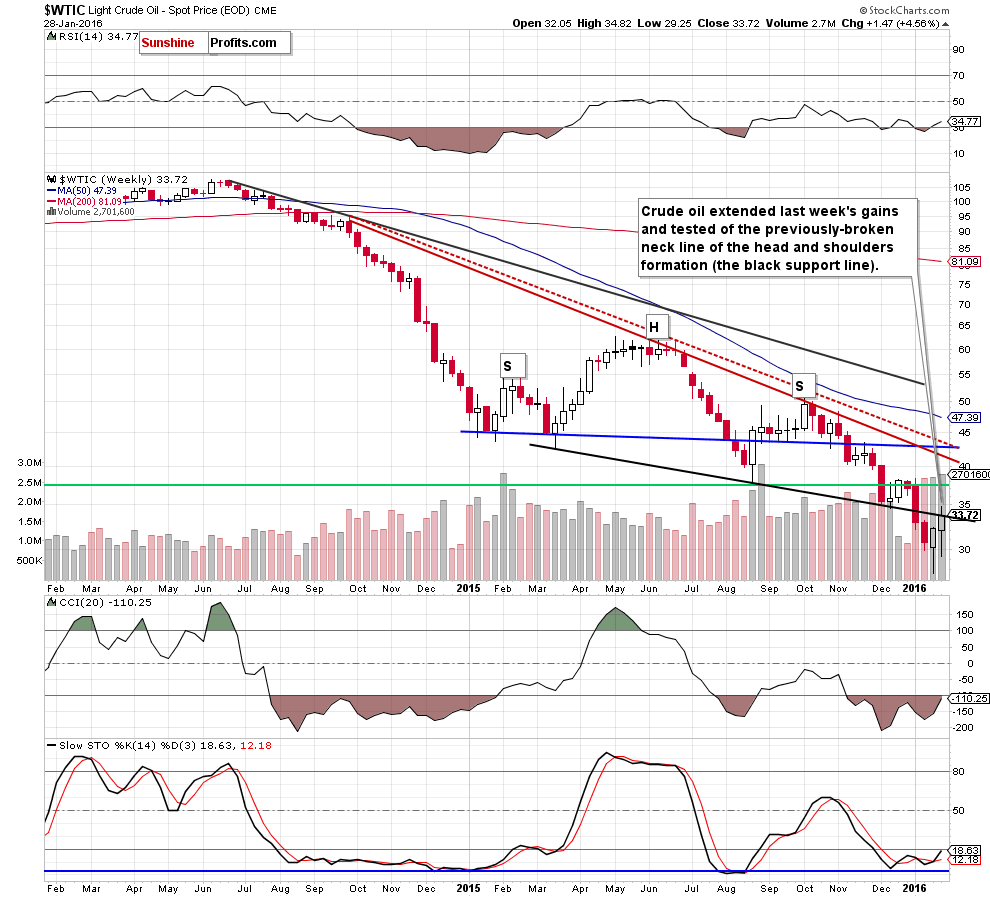
(…) the first upside target for oil bulls would be (…) the previously-broken neck line of the head and shoulders formation
As you see on the chart, although oil bulls pushed light crude higher (as we had expected), crude oil gave up some gains and slipped under the neck line of the head and shoulders formation. With this move, the commodity verified the breakdown under this important resistance line, which is another negative signal that increases the probability of reversal.
Nevertheless, to have a more complete picture of the oil market, we decided to examine the current situation in oil stocks.
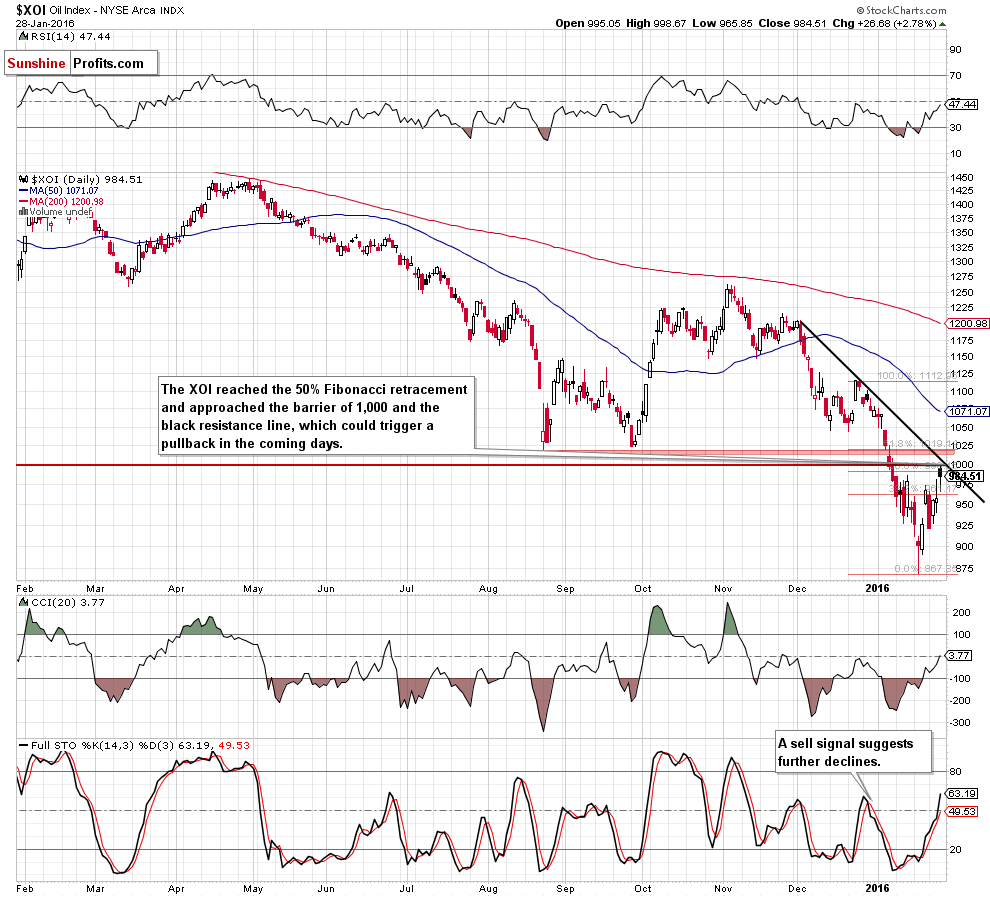
Looking at the above chart, we see that the recent rebound took the XOI to important resistance zone created by the 50% Fibonacci retracement (based on the Dec-Jan decline), the barrier of 1,000 and the black resistance line (based on the Dec highs). In our opinion, although buy signals remain in place, this solid resistance area would be strong enough to stop oil bulls (especially when we factor in the proximity to the next resistance zone based on the Aug and Sep lows around 1,015-1,024) and trigger a pullback from here in the coming days.
Finishing today’s Oil Trading Alert, we would like to draw your attention to the relationship between crude oil and gold.
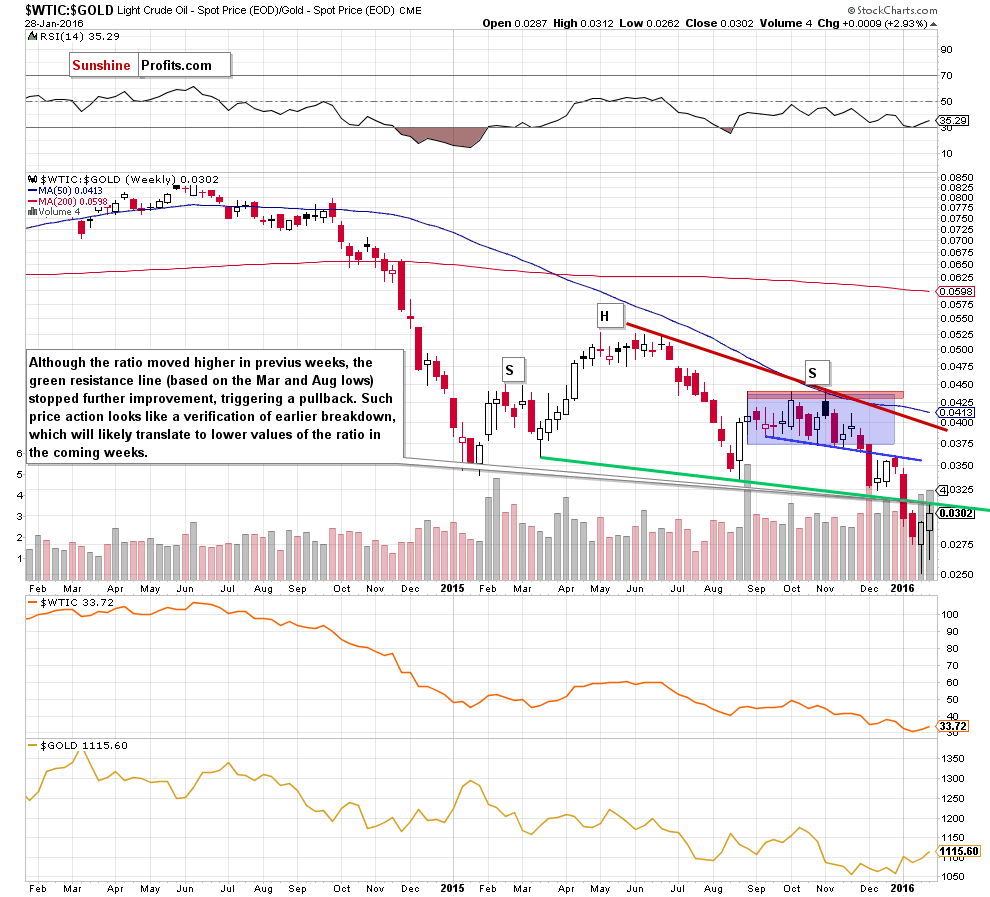
From the medium-term perspective, we see that although the ratio moved higher in recent weeks, the green resistance line (the neck line of the head and shoulders formation) stopped further improvement, triggering a pullback. Such price action looks like a verification of earlier breakdown, which will likely translate to lower values of the ratio in the coming weeks. What does it mean for crude oil? As you see on the chart, the ratio moves in line with the commodity, which means that further declines in the ratio will translate into further drops in light crude.
Summing up, crude oil moved higher and verified the breakdown under the mid-Dec low and the neck line of the head and shoulders formation (marked on the weekly chart). Yesterday’s price action invalidated small breakout above the 61.8% Fibonacci retracement, which in combination with the black resistance line (the key short-term resistance) and the current situation in oil stocks and the oil-to-gold ratio suggests a reversal in the coming day. Therefore, re-opening short positions (with a stop-loss order at $35.63 and a price target at $25.63) is justified from the risk/reward perspective.
Last week, on Friday, when crude oil rallied sharply and was trading at about $31.7, we wrote the following:
On an intra-day basis, we’re likely to see lower prices on Monday, but that’s only something that day-traders might want to take advantage of - we are not writing about it as a general trade idea.
It might be tempting to wait out the current position (actually, that would have been “the easy way out” for us as it would imply no losing trade) but we think the odds are that we will be able to get back on the short side of the crude oil market at even higher prices, which will make profits from the short trade bigger than they would be if we had kept the position intact. Our focus is not and will never be on what’s “easy” - only on what’s likely to be profitable over the long run, because we care way more about your profits and portfolios than about “never being wrong” or “never taking a loss”.
Please note that this small trade is just a small correction in profits that we have been generating to you in the past weeks and months. In fact, if you examine the second trade that is described on the above page, you’ll see that we’ve done a similar thing (exiting a trade at a small loss in order to increase the overall profitability) in the past and it was well worth it. We will keep monitoring the market and will report to you once the risk to reward ratio once again favors opening a position in crude oil. This will probably take place at higher prices and it will probably once again be a short position, but this may change as the situation develops
The situation developed exactly as we had outlined. Crude oil declined on Monday (and day-traders have likely profited on that) and then moved higher, allowing us to re-enter short positions about $2 higher (the price is $33.5 at the moment of writing these words). If we are correct about the medium-term decline, then closing the short position earlier and re-entering is likely to have increased the profits by about $2.
Very short-term outlook: bearish
Short-term outlook: bearish
MT outlook: bearish
LT outlook: mixed with bearish bias
Trading position (short-term; our opinion): Short positions (with a stop-loss order at $35.63 and the price target at $25.63) are justified from the risk/reward perspective. The analogous levels for USO ETF and DWTI ETN are:
- USO initial target price: $6.67; USO stop-loss: $10.25
- DWTI initial target price: $513.31; DWTI stop-loss: $165.84
We will keep you – our subscribers – informed should anything change.
As a reminder – “initial target price” means exactly that – an “initial” one, it’s not a price level at which we suggest closing positions. If this becomes the case (like it did in the previous trade) we will refer to these levels as levels of exit orders (exactly as we’ve done previously). Stop-loss levels, however, are naturally not “initial”, but something that, in our opinion, might be entered as an order.
Since it is impossible to synchronize target prices and stop-loss levels for all the ETFs and ETNs with the main market that we provide this level for (crude oil), the stop-loss level and target price for popular ETN and ETF (among other: USO, DWTI, UWTI) are provided as supplementary, and not as “final”. This means that if a stop-loss or a target level is reached for any of the “additional instruments” (DWTI for instance), but not for the “main instrument” (crude oil in this case), we will view positions in both crude oil and DWTI as still open and the stop-loss for DWTI would have to be moved lower. On the other hand, if crude oil moves to a stop-loss level but DWTI doesn’t, then we will view both positions (in crude oil and DWTI) as closed. In other words, since it’s not possible to be 100% certain that each related instrument moves to a given level when the underlying instrument does, we can’t provide levels that would be binding. The levels that we do provide are our best estimate of the levels that will correspond to the levels in the underlying assets, but it will be the underlying assets that one will need to focus on regarding the sings pointing to closing a given position or keeping it open. We might adjust the levels in the “additional instruments” without adjusting the levels in the “main instruments”, which will simply mean that we have improved our estimation of these levels, not that we changed our outlook on the markets.
Thank you.
Nadia Simmons
Forex & Oil Trading Strategist
Przemyslaw Radomski, CFA
Founder, Editor-in-chief
Gold & Silver Trading Alerts
Forex Trading Alerts
Oil Investment Updates
Oil Trading Alerts

