

Trading position (short-term; our opinion): Short positions with a stop-loss order at $65.23 are justified from the risk/reward perspective.
On Thursday, crude oil lost 2.85% as a stronger U.S. dollar and worries over the return of Iranian oil into the market weighed on the price. Because of these circumstances, light crude reversed and declined sharply, invalidating earlier breakouts above important resistance levels. Does it mean that correction of the recent rally is just around the corner?
Yesterday, the U.S. Department of Labor reported that the number of individuals filing for initial jobless benefits in the week ending May 2 rose only by 3,000 to 265,000, missing analysts’ expectations for an 18,000 rise. This smaller-than-expected increase eased worries over the strength of the U.S. job market (after disappointing ADP report, which showed that U.S. non-farm private employment rose by 169,000 last month, well below expectations for an increase of 200,000) and pushed the U.S. dollar higher, making crude oil less attractive for buyers holding other currencies.
On top of that, Iranian oil minister Bijan Zanganeh said at an Energy Security Summit in Berlin that Iran's production could reach "three to four million barrels per day" within eight months if a nuclear pact with Western powers is reached. His commentary fuelled fears over supply glut and watered down the price of the commodity. As a result, light crude invalidated earlier breakouts above important resistance levels and closed the day below $59. How low could crude oil go in the coming week? (charts courtesy of http://stockcharts.com).
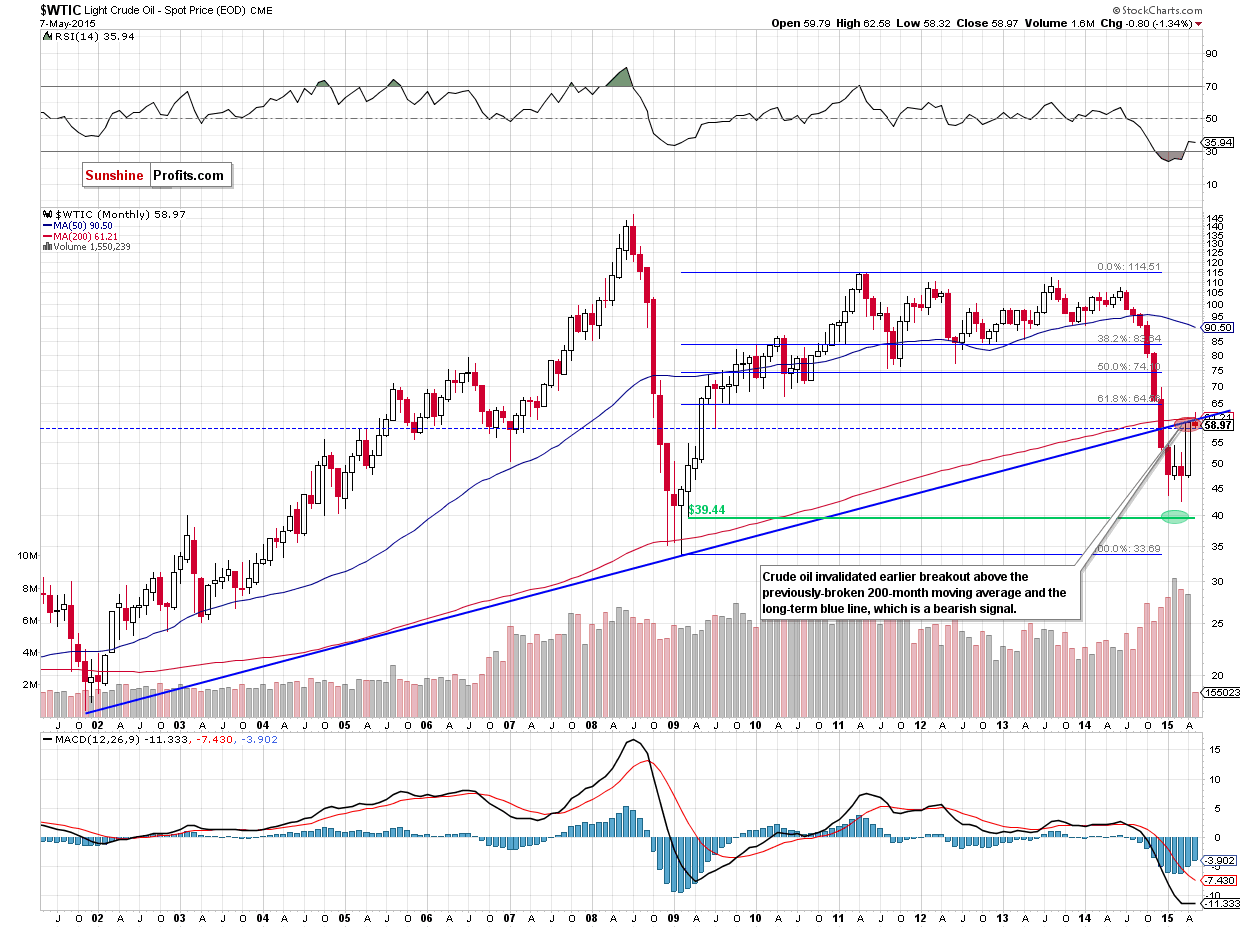
On the long-term chart we see that crude oil invalidated earlier breakout above the 200-month moving average and the long-term blue line, which is a bearish signal that suggests further deterioration.
Are there any other technical factors that could encourage oil bears to act? Let’s examine the weekly chart and find out.
On Monday, we wrote the following:
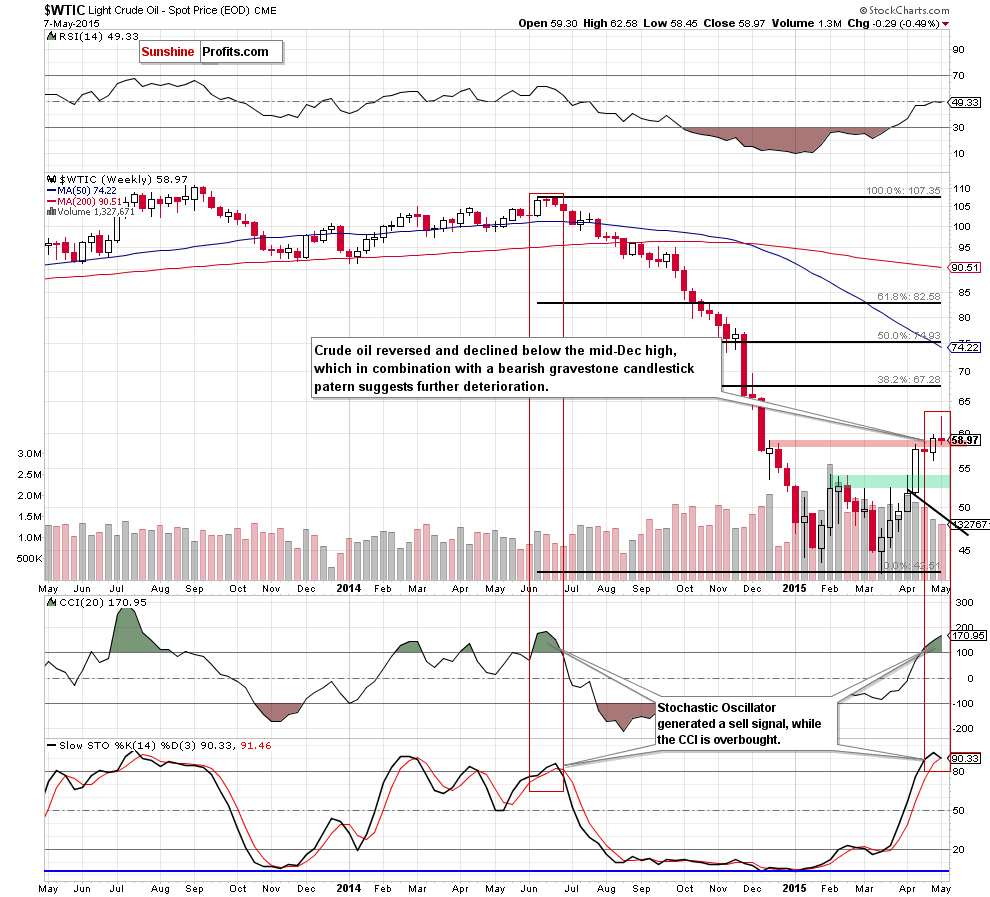
(…) when we take a closer look at the chart, we notice that the size of volume that accompanied last week’s upward move wasn’t huge (compared to what we saw at the beginning of the month). This means that oil bulls might not be as strong as it seems at the first sight. On top of that, the current position of the indicators (the CCI and Stochastic Oscillator are overbought) suggests that reversal is just around the corner (even if oil bulls try to push light crude higher and test the barrier of $60 once again).
Looking at the weekly chart, we see that the situation developed in line with the above scenario as crude oil reversed and declined after a climb above $60. With this downswing, light crude invalidated earlier breakout above the mid-Dec high and created a bearish gravestone candlestick pattern, which together suggests lower values of the commodity in the coming week. Additionally, it is worth noting that the Stochastic Oscillator generated a sell signal, supporting the bearish case.
How yesterday’s downswing affect the very short-term picture? Let’s examine the daily chart and find out.
Quoting our previous Oil Trading Alert:
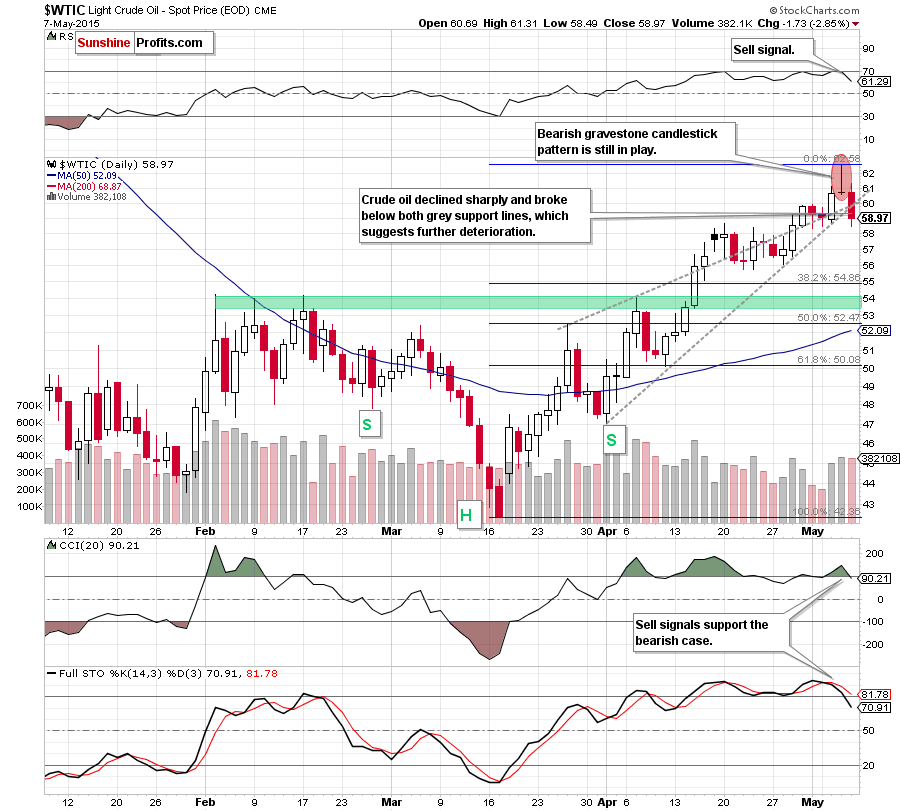
(…) the commodity reversed and erased almost all earlier gains creating a gravestone candlestick pattern on the daily chart (please note that this is a common reversal pattern, which suggests that a bullish rally or trend is about to reverse). Taking this fact into account, and combining it with the size of volume (only slightly higher than the day before), position of the indicators and the long-term picture, we believe that the probability of reversal is increasing. If this is the case, and the commodity moves lower, the initial downside target would be around $60, where the previously-broken grey support lines are.
As you see on the daily chart the commodity moved lower and broke below both grey support lines as we expected. Additionally, yesterday’s downswing materialized on quite high volume (compared to what we saw during earlier upswings), which confirms oil bears’ strength. On top of that, sell signals generated by the indicators are still in play, supporting further deterioration.
Taking all the above into account, we think that the commodity will extend declines and the initial downside target would be around $55, where the 38.2% Fibonacci retracement based on the entire Mar-May rally is. If it is broken, the next target would be the green support zone created by the Feb highs ($54-$54.24). Please note that if this area is broken, the next targets would be around: $52.40 (the 50% Fibonacci retracement based on the entire Mar-May rally), $50 (the 61.8% retracement) or we might see a test of the Apr low of $47.
Summing up, in our opinion, further deterioration is more likely than not and short positions are justified from the risk/reward perspective because crude oil invalidated earlier breakout above the long-term blue line (marked on the monthly chart), the mid-Dec high and both grey support lines (marked on the daily chart), which is a strong bearish signal. Additionally, there are two reversal patterns (on weekly and daily chart) and the weekly Stochastic Oscillator generated a sell signal, while sell signals generated by all daily indicators remain in place, supporting the bearish case.
Very short-term outlook: bearish
Short-term outlook: bearish
MT outlook: mixed with bearish bias
LT outlook: mixed
Trading position (short-term; our opinion): Short positions with a stop-loss order at $65.23 are justified from the risk/reward perspective. We will keep you – our subscribers – informed should anything change.
Thank you.
Nadia Simmons
Forex & Oil Trading Strategist
Przemyslaw Radomski, CFA
Founder, Editor-in-chief
Gold & Silver Trading Alerts
Forex Trading Alerts
Oil Investment Updates
Oil Trading Alerts

