

Please note that due to market volatility, some of the key levels may have already been reached and scenarios played out.
Trading positions
- Natural Gas [NGH22] Long around $ 3.846-3.886 support (yellow band) with targets at $4.442 (already hit!) & 4.818 and stop just below $ 3.629 (lifted up following our risk management guidelines – See charts
Did you miss my last article about biofuels to diversify your portfolio? No problem, you can have a look at my selection through the dynamic stock watchlist.
Are you interested in geopolitics? I published an alternative reading of the Ukrainian crisis.
Natural Gas flight passed 1st destination – Here is a roadmap to 2nd target…

Trade Plan
We all love it when a trade plan comes together! The market has to cope with stronger demand to fuel increasing industrial activity after being surprised by the warming mid-February weather forecast. Therefore, you can see that the rebounding floor (support) provided was ideal for the Henry Hub, which is also supported by unyielding global demand for US Liquefied Natural Gas (LNG) to turn its momentum back up. The recommended objective of $4.442 was almost hit yesterday. However, it was achieved this morning (during the European session) and the $4.818 level is now the next goal.
As I explained in more detail in my last risk-management-related article to secure profits, my recommended stop, which was located just below the $ 3.629 level (below one-month previous swing low), was recently lifted up around the $3.886 level (around breakeven). Now it could be lifted one more time up to 4.180, which corresponds to the 50% distance between the initial entry and target 1. By doing so, the second half of the trade would become optimally managed. Alternatively, you can also use an Average True Range (ATR) multiple to determine a different level (above breakeven) that may better suit your trading style.
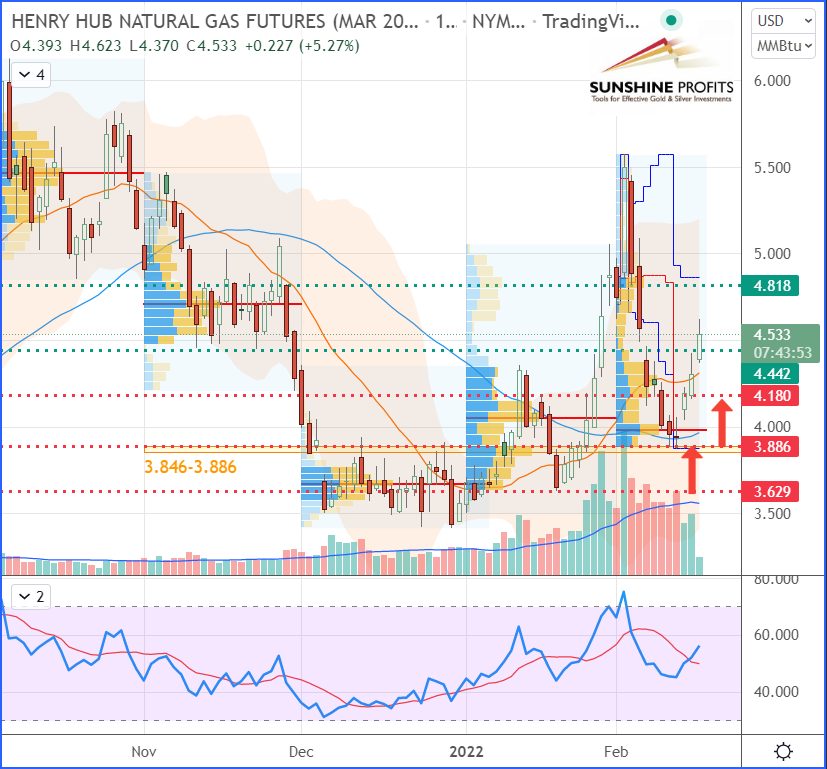
Henry Hub Natural Gas (NGH22) Futures (March contract, daily chart)
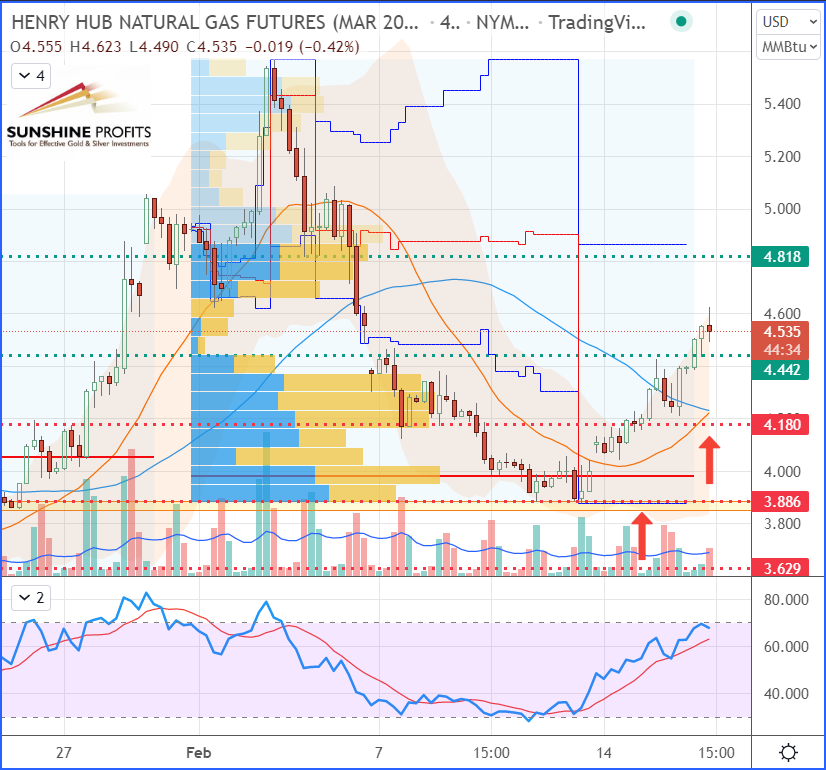
Now, let’s zoom into the 4H chart to observe the recent price action all around the abovementioned levels of our trade plan:
 D
D
Henry Hub Natural Gas (NGH22) Futures (March contract, 4H chart)
That’s all folks for today. Happy trading!
As always, we’ll keep you, our subscribers well informed.
Thank you.
Sebastien Bischeri
Oil & Gas Trading Strategist

