

Please note that due to market volatility, some of the key levels may have already been reached and scenarios played out.
Trading positions
- Natural Gas [NGJ22]
Long around the $4.490-4.550 support area (yellow band) with a stop at $4.340 and targets at $4.745 (hit on March-11 and again on March-16) & $4.860 (hit yesterday!) – More details in previous Oil Trading Alert. - RBOB Gasoline [RBJ22]
No new position justified on a risk/reward point of view. - WTI Crude Oil [CLJ22]
Long around the $89.64-92.40 support area (yellow band) with a stop at $87.06 and targets at $99.10 & $109.20. - Brent Crude Oil [BRNK22]
Long around the $92.81-95.26 support area (yellow band) with a stop at $88.24 and targets at $102.26 & $113.15.
Regarding risk management, it is always best to define your strategy according to your own risk profile. For some guidance on trade management, read one of my articles on that topic.
Did you miss my last article about biofuels to diversify your portfolio? No problem, you can have a look at my selection through the dynamic stock watchlist.
St. Patrick’s Day is historically considered one of the best trading days. Apparently, it brought some luck to natural gas this time.
If you are interested in looking at the stats, an article by Market Watch summed them up.

The second target hit – BOOM! Yesterday, on St. Patrick's Day, the opportunity to bank the extra profits from my recent Nat-Gas trade projections (provided on March 2) finally arrived. That trade plan has provided our dear subscribers with multiple bounces to trade the NYMEX Natural Gas Futures (April contract) in various ways, always depending on each one’s personal risk profile.
To get some more explanatory details on understanding the different trading ways this fly map (trading plan) could offer, I invite you to read my previous article (from March 11).
To quickly sum it up, the various trade opportunities that could be played were as follows (with the following captures taken on March 11):
The first possibility is swing trading, with the trailing stop method explained in my famous risk management article.
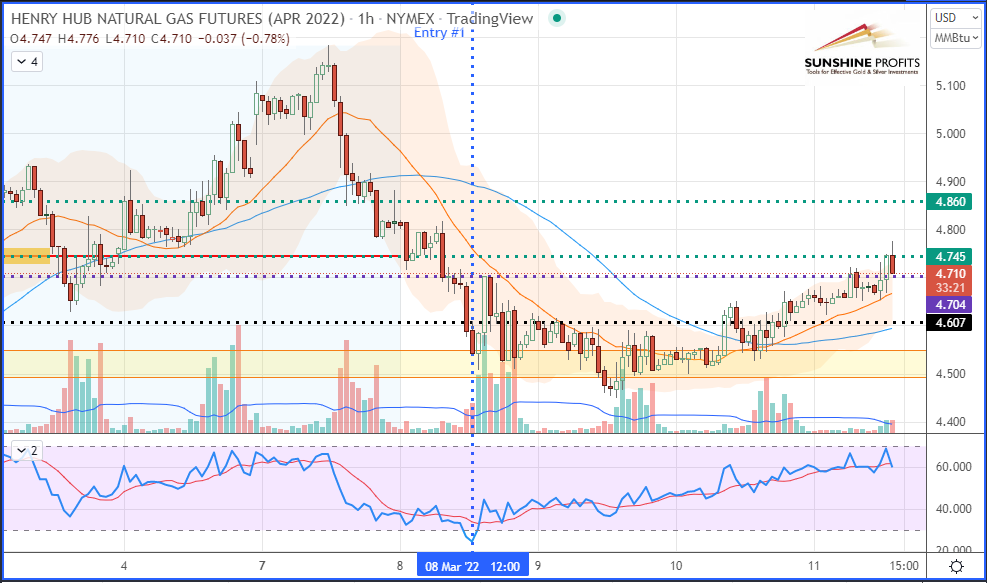 Henry Hub Natural Gas (NGJ22) Futures (April contract, hourly chart)
The second option consisted of scalping the rebounds with fixed targets (active or experienced traders). I named this method “riding the tails” (or the shadows).
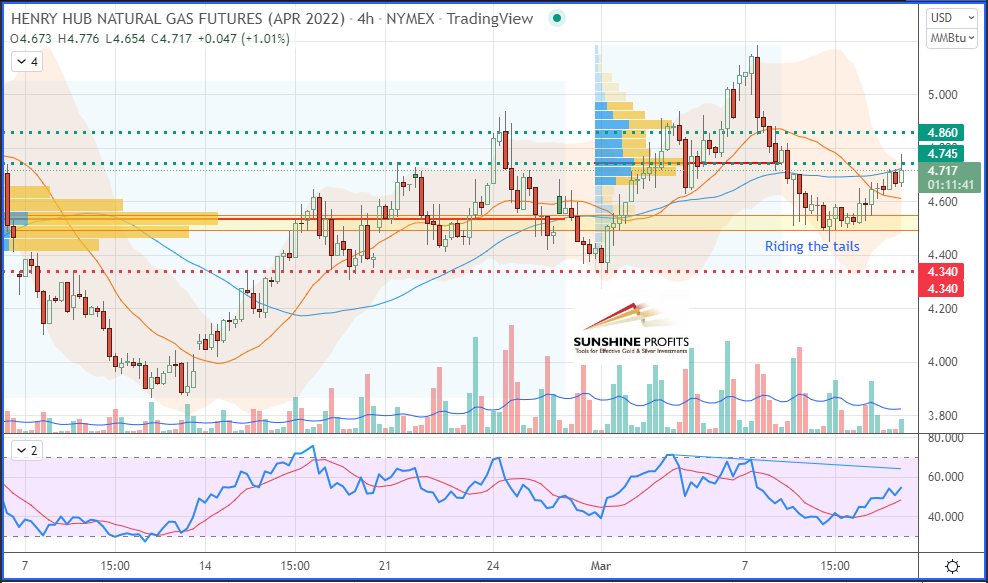 Henry Hub Natural Gas (NGJ22) Futures (April contract, 4H chart)
The third way is position trading – a more passive trading style (and usually more rewarding).
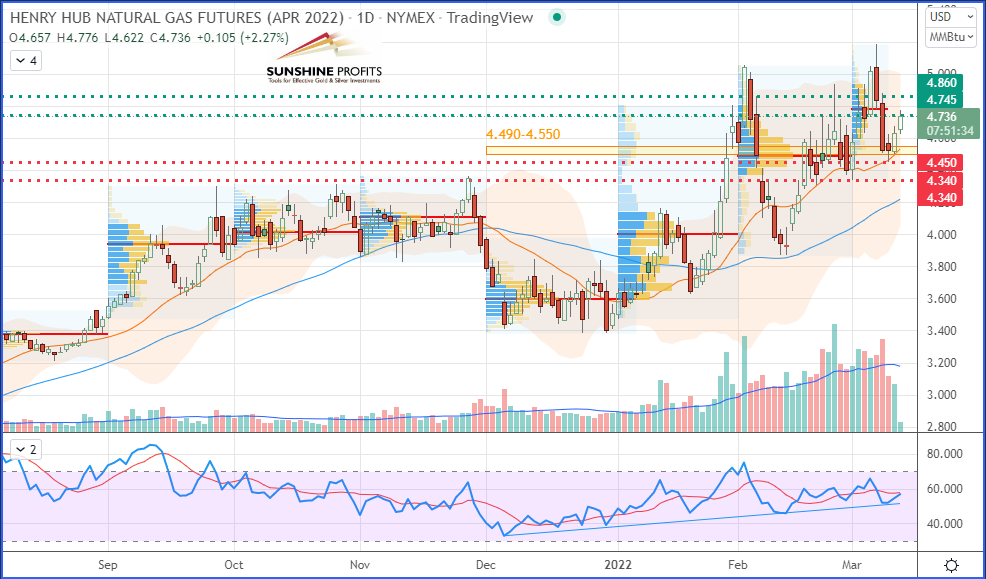
Henry Hub Natural Gas (NGJ22) Futures (April contract, daily chart)
Since we do our best at Sunshine Profits to provide the best timing for trading alerts to be executed by the vast majority of our subscribers, located all over the world and across various time zones, I have created a new chart that shows a good overall view of NYMEX Natural Gas hitting our final target, $4.860:
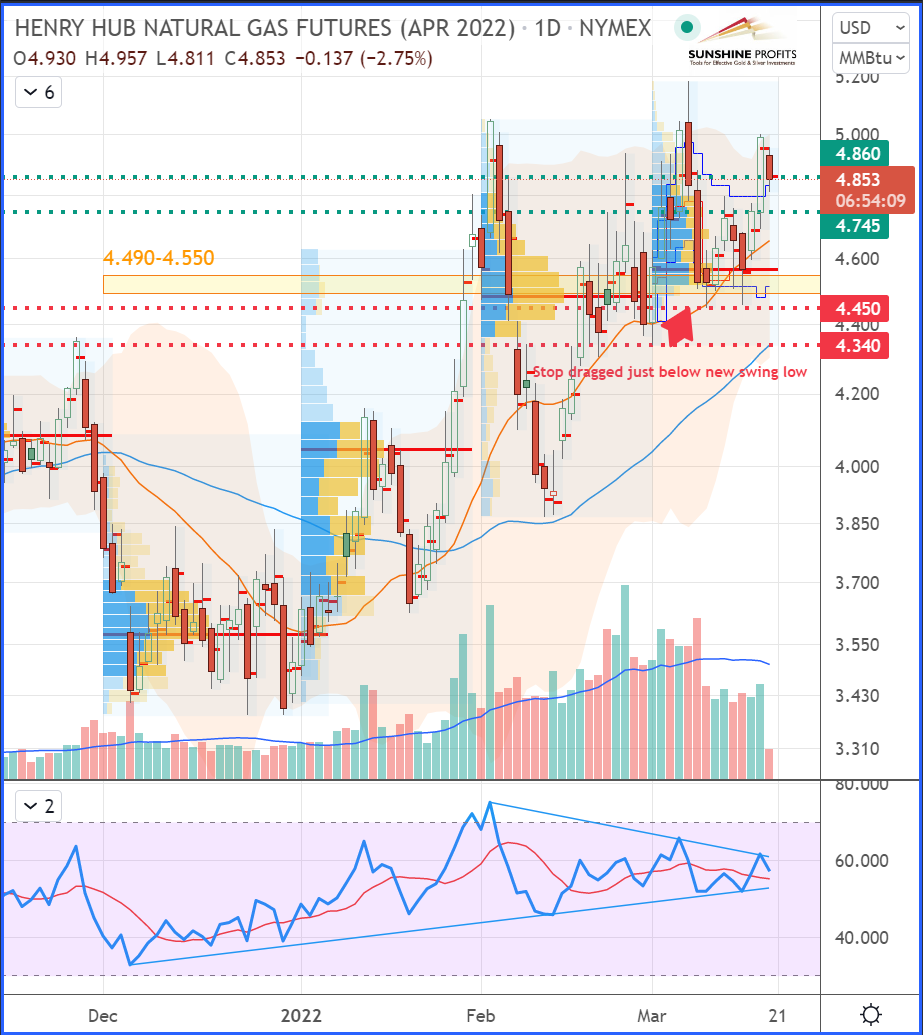 Henry Hub Natural Gas (NGJ22) Futures (April contract, daily chart)
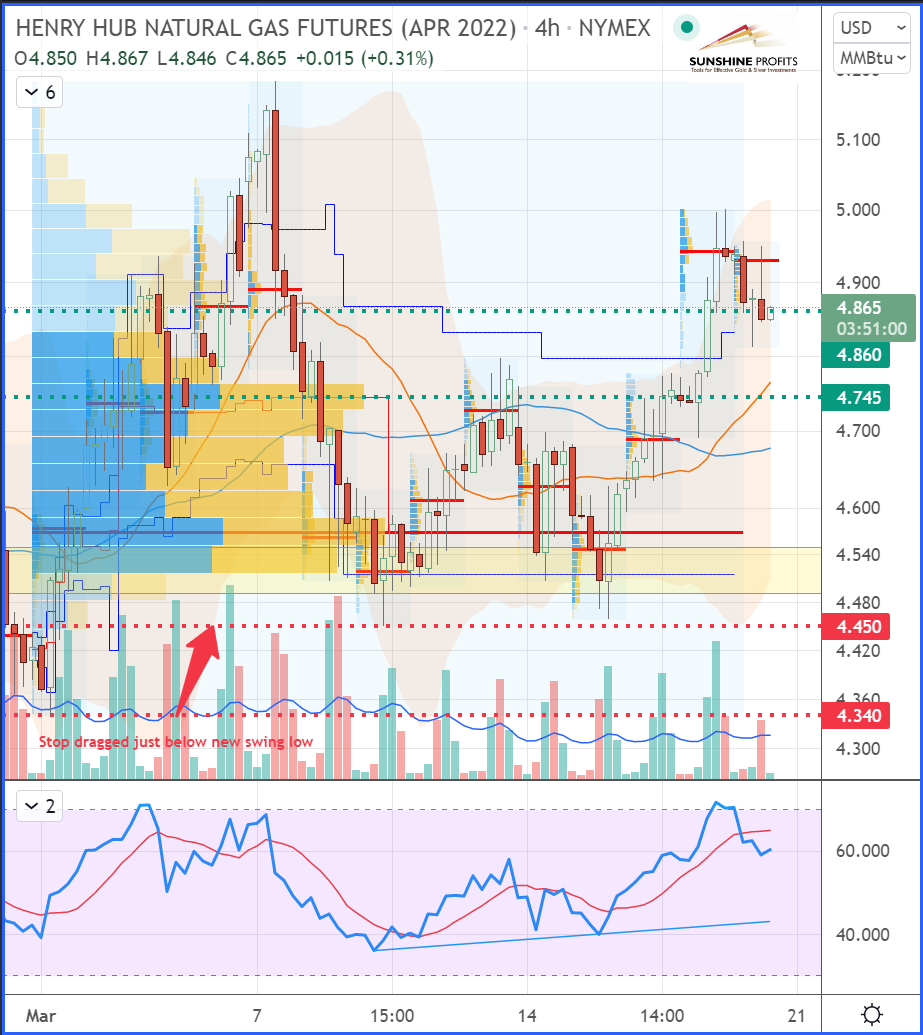
Henry Hub Natural Gas (NGJ22) Futures (April contract, 4H chart)
As you can see, the market has provided us with multiple entries into the same support zone (highlighted by the yellow band) – even after hitting our first target, you may have noticed that I maintained the entry conditions in place – after the suggestion to drag the stop up just below the new swing low ($4.450). The market, still in a bull run, got very close to that point on March 15 by making a new swing low at $4.459 (just about 10 ticks above it). Before that, it firmly rebounded once more (allowing a new/additional entry) and then extended its gains further away while consecutively hitting target 1 ($4.745) again. After that, it finally hit target 2 ($4.860)!
That’s all folks for today. It is time to succesfully close this trade. Have a great weekend!
As always, we’ll keep you, our subscribers well informed.
Thank you.
Sebastien Bischeri
Oil & Gas Trading Strategist

