

Trading position (short-term; our opinion): No positions are justified from the risk/reward perspective.
The start of the Monday session looked quite promising, when the bulls moved north and pushed the price of black gold over $ 52. Here, however, their successes ended. The clash with the closest resistance showed their weakness (for the fifth time in a row), which lured their opponents and encouraged them to fight for lower oil prices. What are the technical implications of yesterday's decline?
Let’s analyze the charts below (charts courtesy of http://stockcharts.com/).
Yesterday, we wrote the following:
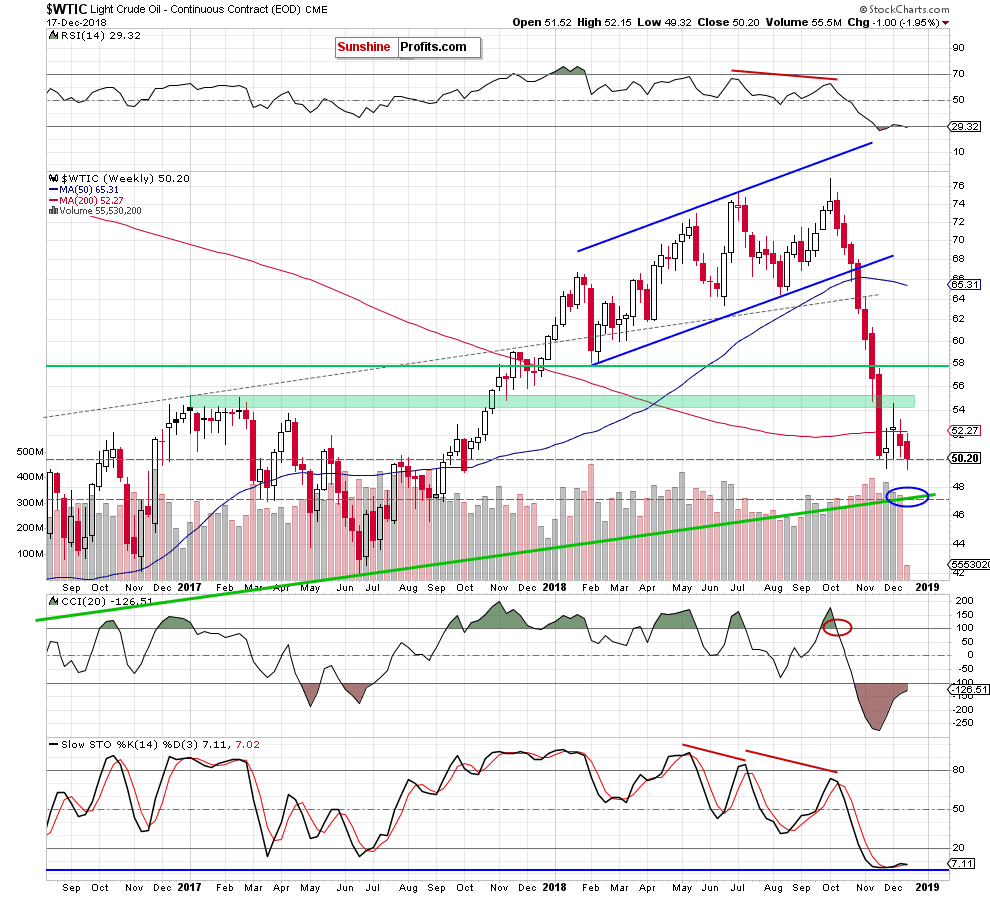
(…) although oil bulls pushed the commodity above the previously-broken 200-week moving average, they didn’t manage to hold gained levels, which caused another move to the south.
Thanks to this drop, the commodity finished the week under this resistance, invalidating the earlier small breakout, which is a bearish development that increases the likelihood of another downswing in the coming week.
Looking at the medium-term chart, we see that the situation developed in tune with our assumptions and crude oil extended losses during Monday’s session, slipping temporary below the barrier of $50 and hitting a fresh 2018 low of $49.32.
How did this drop affect the very short-term picture of the commodity? Let’s examine the daily chart to find out.
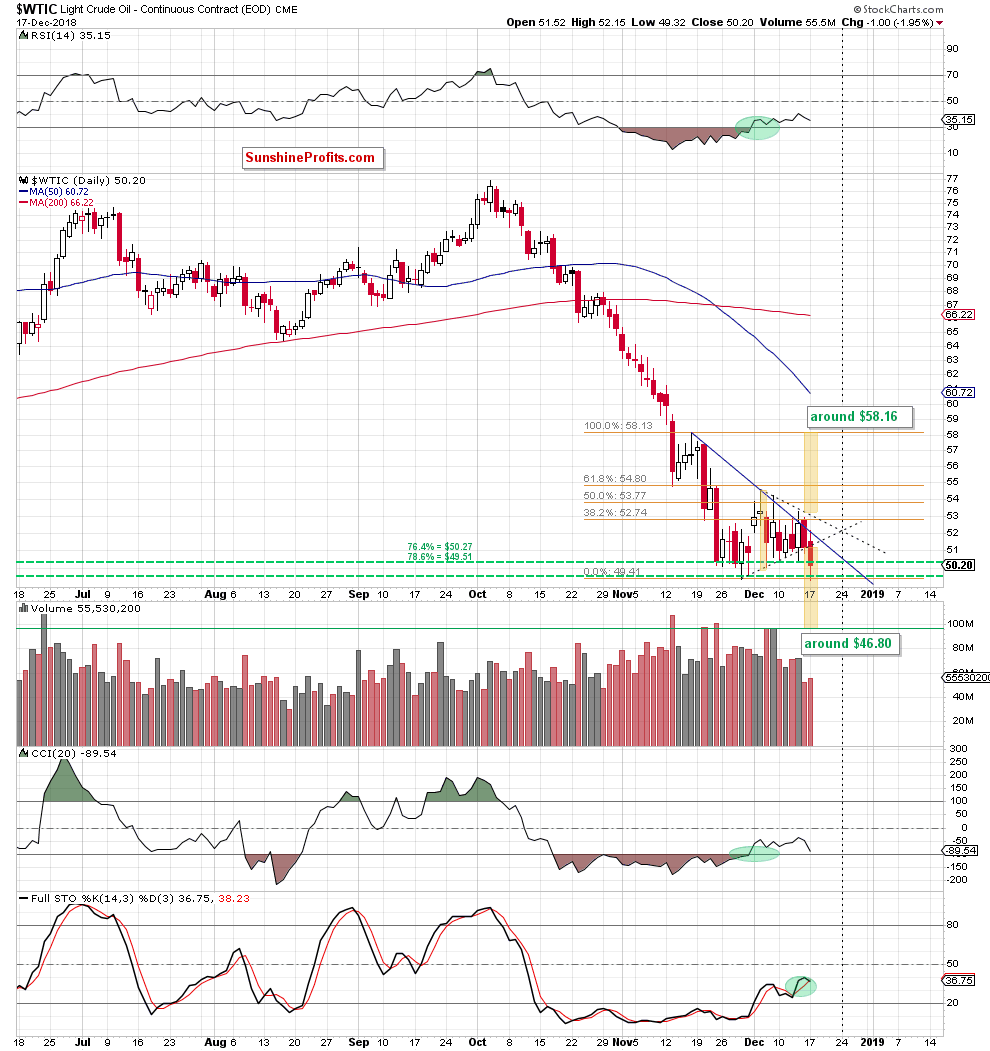
From this perspective, we see that although oil bulls took the price of crude oil higher after Monday’s session open, the blue declining resistance line stopped them quite quickly causing a reversal and a drop below the lower border of the black triangle (marked with dashed lines).
This bearish development triggered further deterioration and a decline not only below the barrier of $50, but also under the support area crated by the 76.4% and 78.6% Fibonacci retracements in the following hours.
As we mentioned earlier, thanks to these circumstances crude oil hit a fresh 2018 low, but then rebounded slightly and closed the day above the previously-broken late-November low, the barrier of $50 and the 78.6% retracement, invalidating the earlier breakdowns.
Despite the fact that these factors may look quite encouraging and positive, in our opinion we should not trust them. Why?
First, the commodity closed yesterday’s session well below the 200-week moving average, which confirms that the last week’s increase and Monday’s upswing after the market’s open were nothing more than just verifications of the previous breakdown under this important resistance level. Therefore, in our opinion, as long as there is no successful climb above it a bigger move to the upside is questionable.
Second, yesterday’s move materialized on higher volume, showing the increased involvement of sellers in the yesterday's move to the south.
Third, the Stochastic Oscillator generated a sell signal, giving oil bears one more reason to act in the very near future.
Last but not least, light crude closed Monday’s session under the lower border of the black dashed triangle, which means that as long as there is no invalidation of the breakdown under this line a pro-bearish scenario from our Friday’s alert remain in the cards:
(…) we would like to draw your attention to the above-mentioned black triangle marked with dashed lines. As you see on the daily chart, we marked with yellow two potential scenarios - depending on which side of the market wins and in which direction the breakthrough will take place.
If oil bulls (…) fail and the sellers trigger a decline below the lower border of the triangle and the recent lows, we can see not only a fresh 2018 low, but also a drop to around $46.80, where the size of the downward move will correspond to the height of the triangle.
Finishing today’s alert, we would like to add that before oil bears take the price of black gold to this level, they will have to defeat one more bulls’ ally, which we wrote about in our Oil Trading Alert published a week ago:
(…) please keep in mind that if oil bulls fail in this area and allow their opponents to push the price of black gold to a fresh low, we can see a decline even to around $47.20, where the long-term green rising support line (marked on the weekly chart (…)) based on the August 2016 and the June 2017 lows currently is.
Summing up, the very short-term situation has deteriorated after crude oil hit a fresh 2018 low and closed the day under the lower border of the black dashed tringle, increasing the probability of another move to the downside – especially when we factor in the verification of the earlier breakdown under the 200-eek moving average, yesterday’s volume and the sell signal generated by the daily Stochastic Oscillator.
Trading position (short-term; our opinion): No positions are justified from the risk/reward perspective. We will keep you informed should anything change, or should we see a confirmation/invalidation of the above.
Thank you.
Nadia Simmons
Forex & Oil Trading Strategist
Przemyslaw Radomski, CFA
Founder, Editor-in-chief, Gold & Silver Fund Manager
Gold & Silver Trading Alerts
Forex Trading Alerts
Oil Investment Updates
Oil Trading Alerts

