

Trading position (short-term; our opinion): No positions are justified from the risk/reward perspective.
Another unsuccessful attempt to move higher encouraged oil bears to act during Friday’s session. What did their actions lead to? What can be the consequences in the coming week?
Let’s analyze the charts below (charts courtesy of http://stockcharts.com).
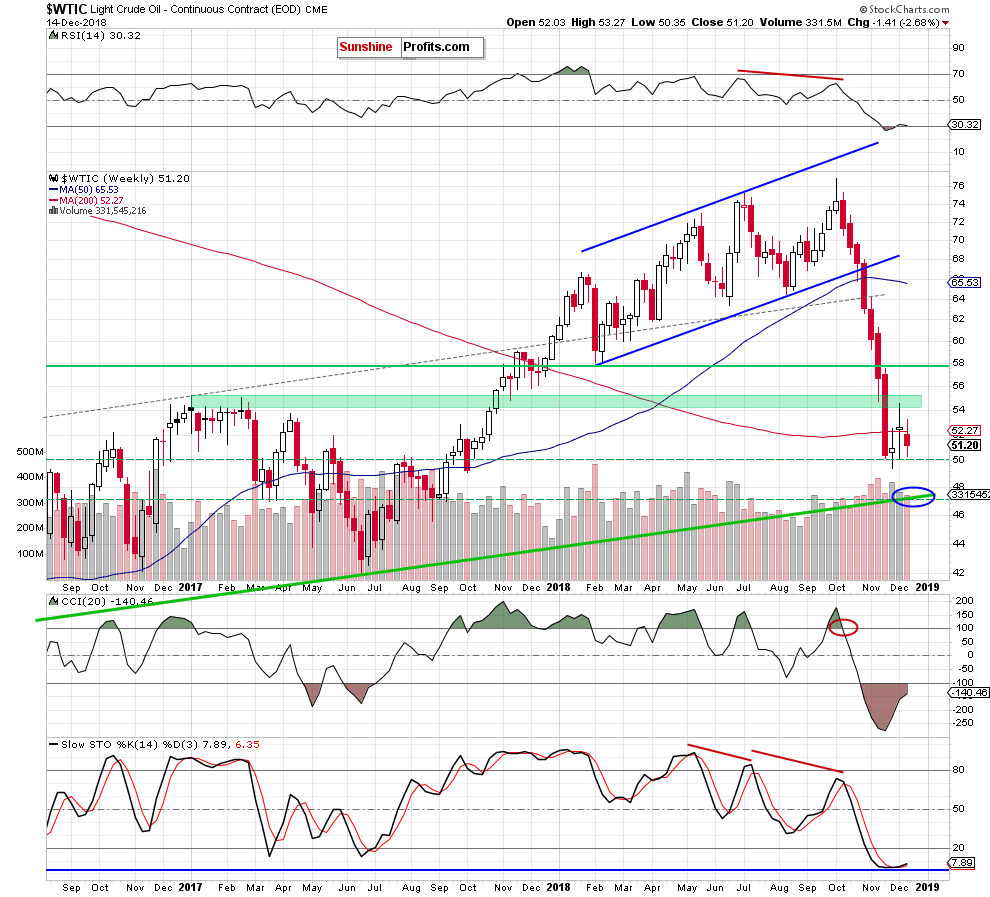
Looking at the medium-term chart, we see that although oil bulls pushed the commodity above the previously-broken 200-week moving average, they didn’t manage to hold gained levels, which caused another move to the south.
Thanks to this drop, the commodity finished the week under this resistance, invalidating the earlier small breakout, which is a bearish development that increases the likelihood of another downswing in the coming week.
But is the way to the lower prices already open?
Before we answer to this question, let’s recall the quotes from our last alert:
(…) black gold re-tested the 38.2% Fibonacci retracement and the very short-term blue resistance line based on the previous highs for a fourth time in a row. Did this upswing change anything in the very short-term picture of light crude?
Not really, because exactly the same as the day before, the buyers showed weakness and buckled under the pressure of the sellers, which resulted in another pullback and a daily closure under these resistances.
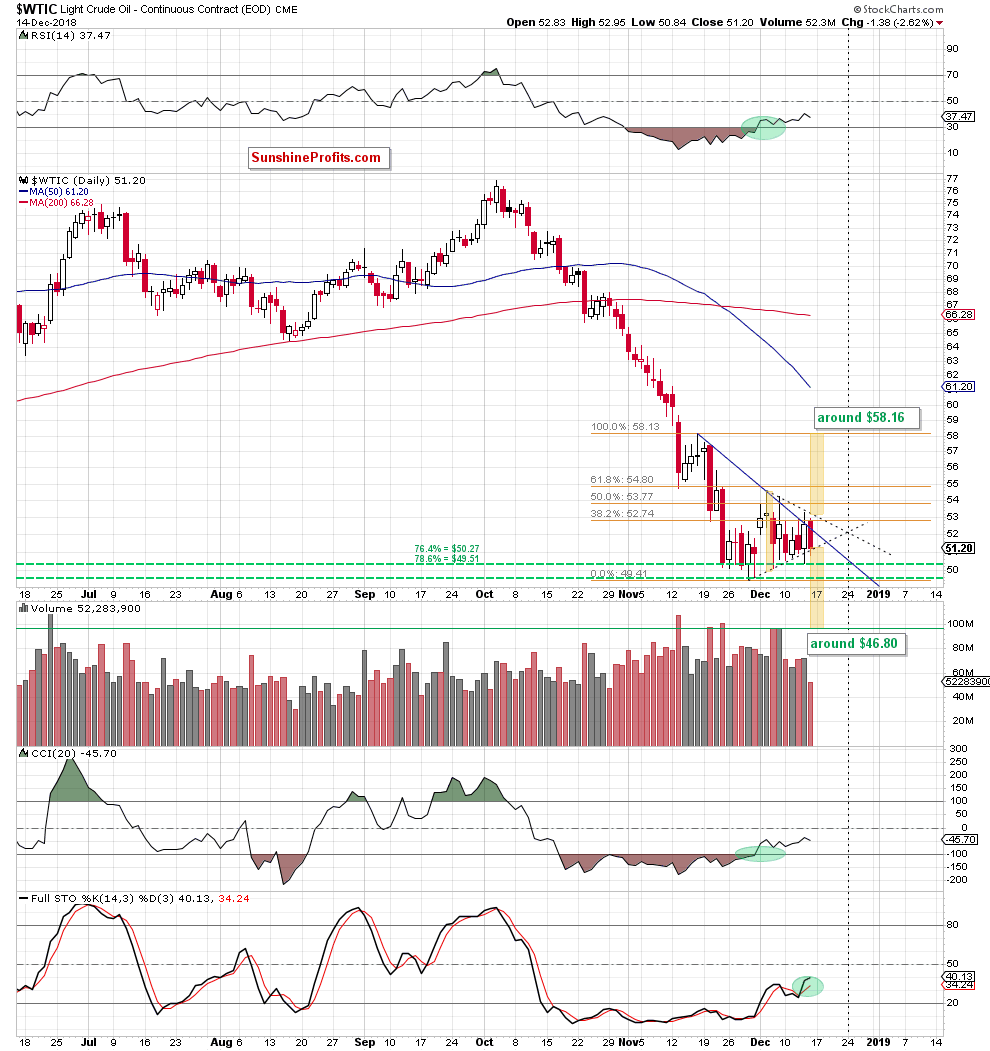
As you can see on the above chart, a similar price action we could observe at the beginning of the month (December 4 and December 7). In both cases, an unsuccessful attempt to go higher translated into a downswing on the following day, which suggests that we can see something similar later in the day.
If the situation develops in tune with the above assumption, crude oil will likely slip to at least $51.20. Why here? Because in this area you can see a black dashed line based on the previous lows, which is the lower line of the very short-term black triangle.
From today’s point of view, we see that the situation developed in tune with our assumptions as oil bears took control on the trading floor shortly after the opening of the Friday session. Thanks to their attack crude oil slipped under the previously-broken blue declining line, invalidating the earlier breakout.
This negative event attracted even more sellers, which resulted in deepening correction of Thursday upswing in the following hours. As a result, the commodity hit an intraday low of $50.84 and tested the strength of the lower border of the above-mentioned black triangle.
As you see on the chart, this support triggered a small rebound before the session closure and light crude finally finished the day on the lower line of the formation.
What’s next? On one hand, the buy signals generated by the daily indicators suggests another rebound. However, on the other hand, an invalidation of the earlier breakout above the 200-week moving average suggests anther downswing, making the overall situation in the very short term a bit unclear.
So, when an we expect a breakthrough?
We believe that the best answer to this question will be another quote from our Friday’s Oil Trading Alert:
(…) we would like to draw your attention to the above-mentioned black triangle marked with dashed lines. As you see on the daily chart, we marked with yellow two potential scenarios - depending on which side of the market wins and in which direction the breakthrough will take place.
If oil bulls show strength and successfully break above the upper line of the formation (and also above the blue declining resistance line, the Fibonacci retracements and preferably above the December high), crude oil will likely climb to around $58.16, where the size of the upward move will correspond to the height of the black triangle. Additionally, in this area is also the mid-November peak, which could attract the buyers.
On the other hand, however, if they fail and the sellers trigger a decline below the lower border of the triangle and the recent lows, we can see not only a fresh 2018 low, but also a drop to around $46.80, where the size of the downward move will correspond to the height of the triangle.
(…) Summing up, the overall situation in the short term remains almost unchanged as crude oil is trading in a narrow range between the barrier of $50 and the blue declining resistance line (…)
Trading position (short-term; our opinion): No positions are justified from the risk/reward perspective. We will keep you informed should anything change, or should we see a confirmation/invalidation of the above.
Thank you.
Nadia Simmons
Forex & Oil Trading Strategist
Przemyslaw Radomski, CFA
Founder, Editor-in-chief, Gold & Silver Fund Manager
Gold & Silver Trading Alerts
Forex Trading Alerts
Oil Investment Updates
Oil Trading Alerts

