

Trading position (short-term; our opinion): Profitable short positions with a stop-loss order at $73.10 and the initial downside target at $66 are justified from the risk/reward perspective.
Analyzing the daily chart of crude oil, it seems that the most important event of yesterday's session was the breakdown below the lower border of the very short-term rising trend channel. However, the return of black gold below $ 70 may have much more serious consequences than it might seem at first glance.
Let’s take a closer look at the charts below (charts courtesy of http://stockcharts.com).
Technical Picture of Crude Oil
In our last Oil Trading Alert, we wrote the following:
(…) yesterday’s upswing dind’t materialize on a larger volume, which may be a sign of weakening bulls. Additionally, the price of light crude is still trading inside the very short-term rising trend channel, which means that (…) we’ll likely see another reversal and another test of the lower border of the very short-term black rising trend channel marked on the daily chart in the very near future.
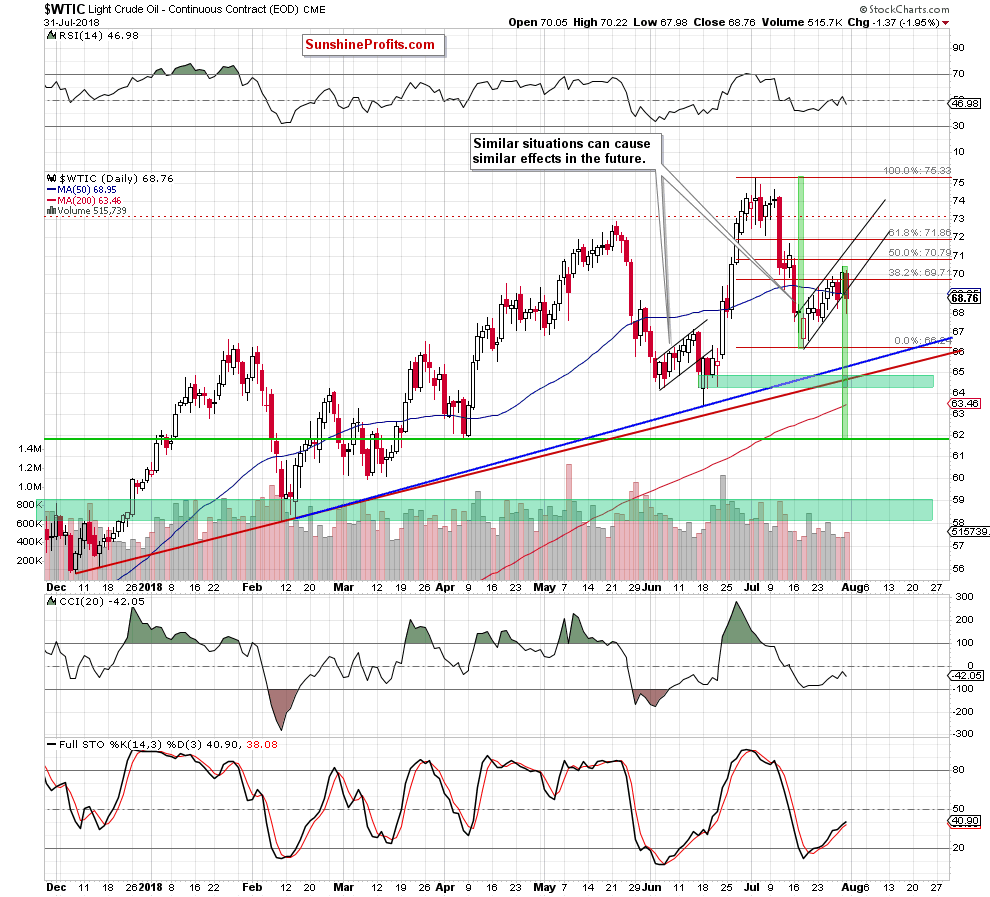
From today’s point of view, we see that the sellers not only tested the lower line of the formation, but also closed yesterday’s session below it, which is a bearish development. Additionally, the volume, which accompanied Tuesday’s downswing was bigger than day earlier, which may suggest that bears are starting to grow in strength.
On top of that, it looks like yesterday's drop started the second leg of the pro-bearish formation (the flag), about which we wrote more on Friday:
(…) what does this mean for oil?
(…) flags are continuation patterns. This means that if oil bears show their claws once again and manage to break below the lower border of the very short-term black trend channel, the next leg of the downside trend will begin, and we’ll see lower prices of crude oil.
What will be the initial target of the above-mentioned flag pattern?
(…) “the flag flutters in the middle of the flagpole”, which means to us that it occurs in the middle of the entire downward move. Therefore, to predict the forecast price level we should measure the size of the flag pole (we marked it with the first green rectangle) and then subtract it from the top of the flag.
Thanks to this method we see that crude oil could decline even to around $62 (the second green rectangle) to complete the whole formation. In this area, there is also the support zone created by April lows, which could attract oil bears like a magnet.
Back then we also added:
Nevertheless, to see black gold at this level, the sellers will have to break under the blue and red rising support lines (lower borders of the rising trend channels seen on the daily chart (…)) and the green support zone based not only on these lines, but also on June’s lows, which may not be a very easy challenge.
Why? At this point, the time has finally come to go back to the past.
(…) a similar price action to the one we are currently observing took place in the first half of June. Back then, the price of crude oil also bounced north (moving in a similar growth channel) after quite strong declines, and then fell to a fresh low. Despite that price action, oil bears didn’t manage to trigger further deterioration as the proximity to the red support line and the 61.8% retracement encouraged their opponents to act.
Taking the above into account, we believe that even if the sellers do not manage to push the commodity to around $62, we’ll see (at least) (…) a test of the nearest support zone (marked with green) in the coming week.
The pro-bearish scenario is also reinforced by the long-term chart of crude oil.
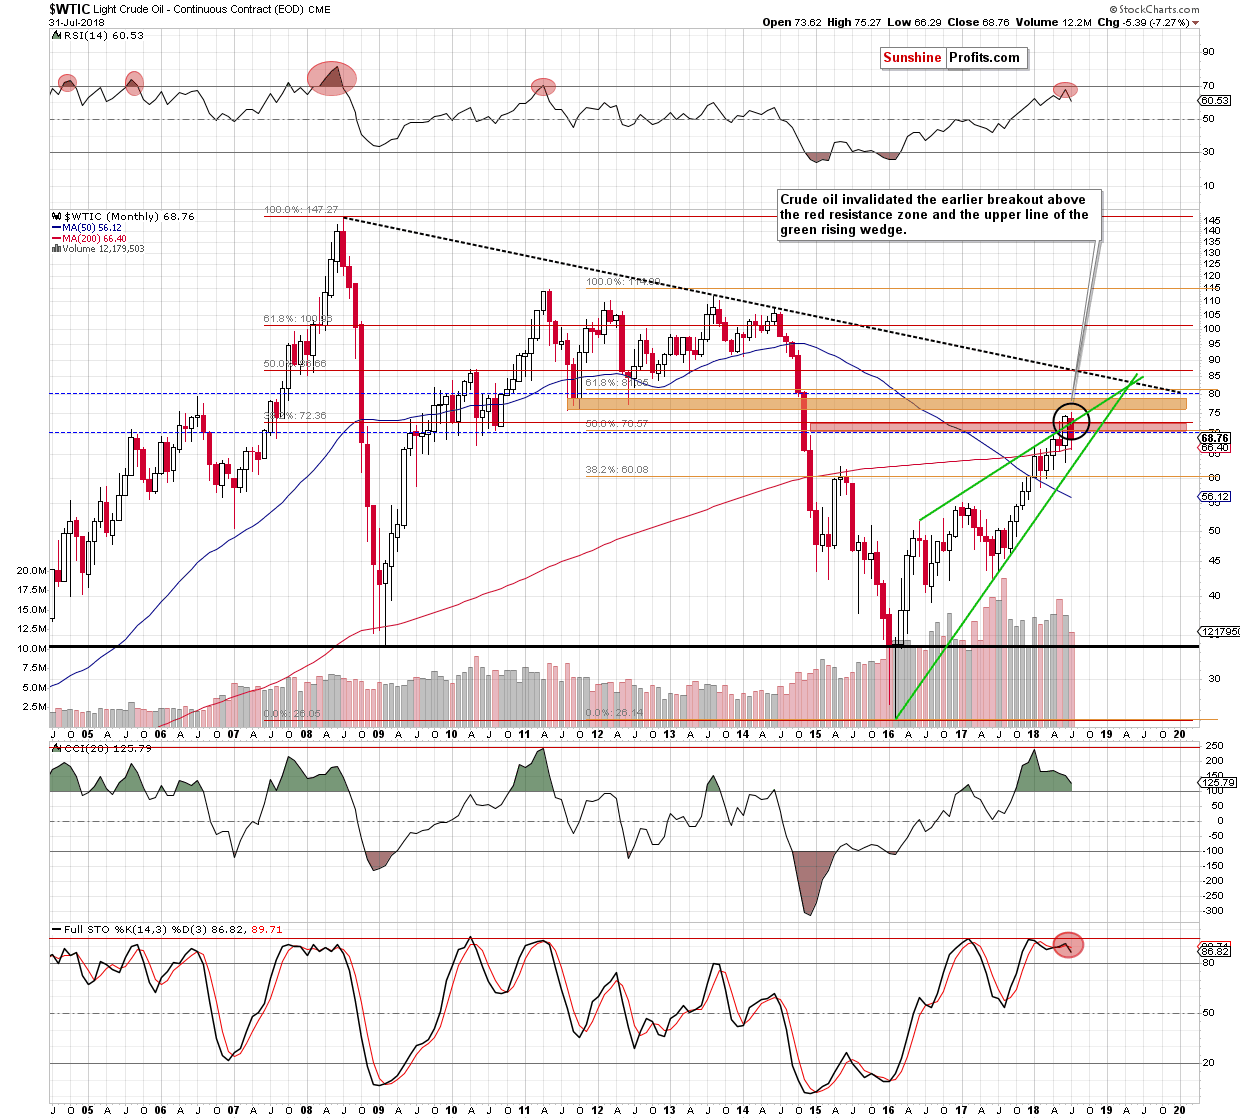
From the long-term perspective, we see that crude oil closed July under the previously-broken red resistance zone (created by the two important Fibonacci retracements) and the upper border of the green rising wedge, invalidating the earlier breakouts.
This is a very bearish development, which significantly increases the probability of further deterioration in the coming month. If this is the case and black gold extends losses from current levels, we’ll likely see (at least) a test of the lower border of the green rising wedge, which is currently around June’s low of $63.40.
Having said the above, let’s examine the relationship between crude oil and precious metals. Will it give oil bears even more reasons to act?
Crude Oil – Precious Metals Link
Let’s start with the oil-to-gold ratio.
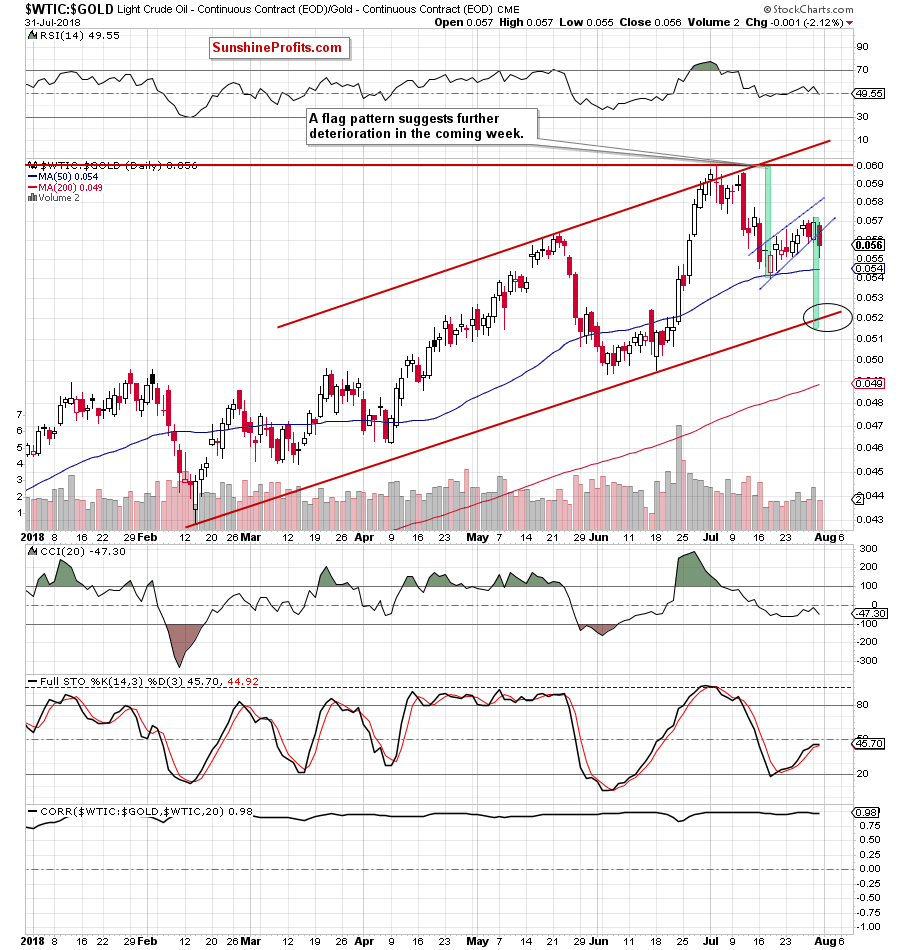
On the daily chart, we can also observe the flag pattern and a daily closure under the lower line of the very short-term rising trend channel, which suggests that lower values of the ratio and crude oil (as the strong correlation between the ratio and the commodity remains in the cards) are just around the corner.
Quite similar situation, we can also see in the case of the oil-to-silver ratio.
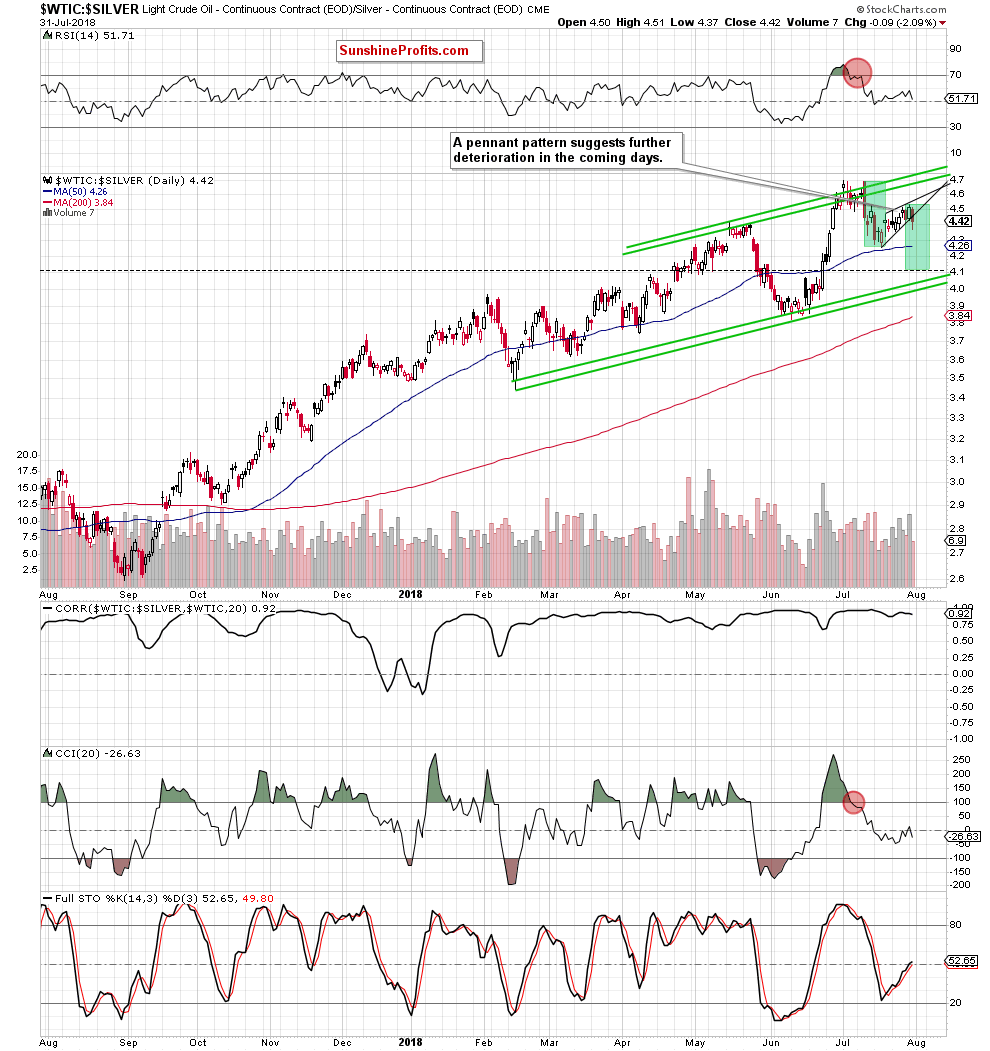
However, in this case the buyers didn’t create the flag. Instead, we can observe a pennant formation, which is also a continuation pattern.
This means that the ratio will (at least) decline under the July low, pulling oil with it (in this case, the correlation between the ratio and crude oil is also very strong).
Summing up, profitable short positions continue to be justified from the risk/reward perspective as the short-term outlook remains bearish (invalidation of the earlier breakouts above the long-term resistances, the breakdown and the daily closure under the lower line of the very short-term rising trend channel, the flag/pennant formations underway), favoring the sellers and lower prices of crude oil in the coming week(s).
Trading position (short-term; our opinion): profitable short positions with a stop-loss order at $73.10 and the initial downside target at $66 are justified from the risk/reward perspective. We will keep you informed should anything change, or should we see a confirmation/invalidation of the above.
Thank you.
Nadia Simmons
Forex & Oil Trading Strategist
Przemyslaw Radomski, CFA
Founder, Editor-in-chief, Gold & Silver Fund Manager
Gold & Silver Trading Alerts
Forex Trading Alerts
Oil Investment Updates
Oil Trading Alerts

