

In March, crude oil extended declines and hit a fresh 2015 low, but the commodity reversed and rebounded sharply in the following weeks, erasing over 80% of the preceding declines. The first days of April were also good for oil bulls as the commodity extended rally and broke above several resistance lines. Despite this improvement, the most important resistance level withstood the buying pressure and triggered a sharp decline yesterday. As a result, light crude lost 4.26% and invalidated earlier breakouts. Does it mean that crude oil’s rally over?
From today’s point of view, we clearly see that although drillers have made reductions in the number of oil rigs out drilling new wells, U.S. crude production has been at the highest level in decades. Yesterday, the Energy Information Administration reported that U.S. crude oil inventories increased by 10.95 million barrels for the week that ended April 3, more than tripling its expected count of 3.28 million. This was the 13th consecutive increase in crude inventories, the biggest streak going back to 1983 and the largest weekly build in domestic oil supplies since 2001. Thanks to this build total U.S. crude oil inventories are more than 25 percent above their five-year average. They also stood now at 482.4 million barrels as of last week, which is the highest level since 1930. At this point, it is worth noting that the EIA placed full capacity at 521 million barrels (up from approximately 500 million a year earlier) during its last estimate in September. Therefore, yesterday’s increase fuelled concerns that the U.S. will reach full storage capacity before the end of May. What could happen if we see such situation? If inventory levels approach full capacity, such development could put further downward pressure on crude oil prices and force producers to slow shale oil production in the Williston basin in North Dakota and the Permian basin in Texas among others. All the above provides with bearish implications, suggesting that as long as there are no declines in domestic crude oil inventories a sharp rally is not likely to be seen.
And speaking of crude oil glut… At the beginning of the month Iran reached a solution on key parameters of a deal regarding its nuclear program with a group of Western leaders, which could add to a worldwide glut 500,000 barrels per day in production in 2016. Adding to supply, Saudi oil minister Ali al- Naimi said on Tuesday that Saudi output would likely remain around 10 million barrels per day (bpd) after posting a monthly record of 10.3 million bpd in March, which was the highest level since 2002.
All the above-mentioned circumstances weighed on investors’ sentiment and pushed crude oil sharply lower on Wednesday (it was the biggest daily drop since Mar 27). How did this decline affect the picture of light crude? Let’s jump into the world of charts to find out what are they saying (charts courtesy of http://stockcharts.com).
Crude Oil
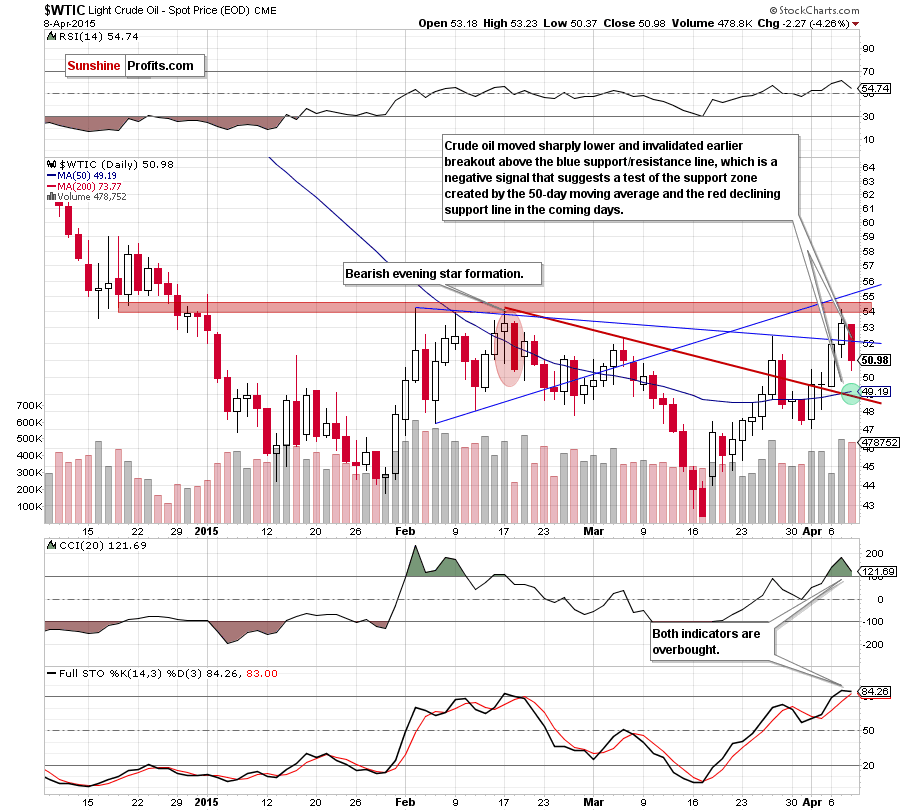
From the very short-term perspective, we see that yesterday’s downswing invalidated earlier breakout above the blue support/resistance line, which is a negative sign that suggests test of the support zone (marked with green) created by the 50-day moving average and the previously-broken red declining support line in the coming days (around $49.20).
Additionally, the size of volume that accompanied yesterday’s decline was quite big (compared to what we saw during recent price moves), which suggests that another downswing might be just around the corner (especially when we factor in the current position of the indicators – the CCI and Stochastic Oscillator are overbought, which could translate to sell signals in the near future).
Nevertheless, before we see such price action, the commodity could move little higher and verified yesterday’s breakdown under the blue resistance line because crude oil reached the 50% Fibonacci retracement level (based on the April’s rally), which serves as the support.
Did this decline affect the medium-term picture? Let’s examine the weekly chart and find out.
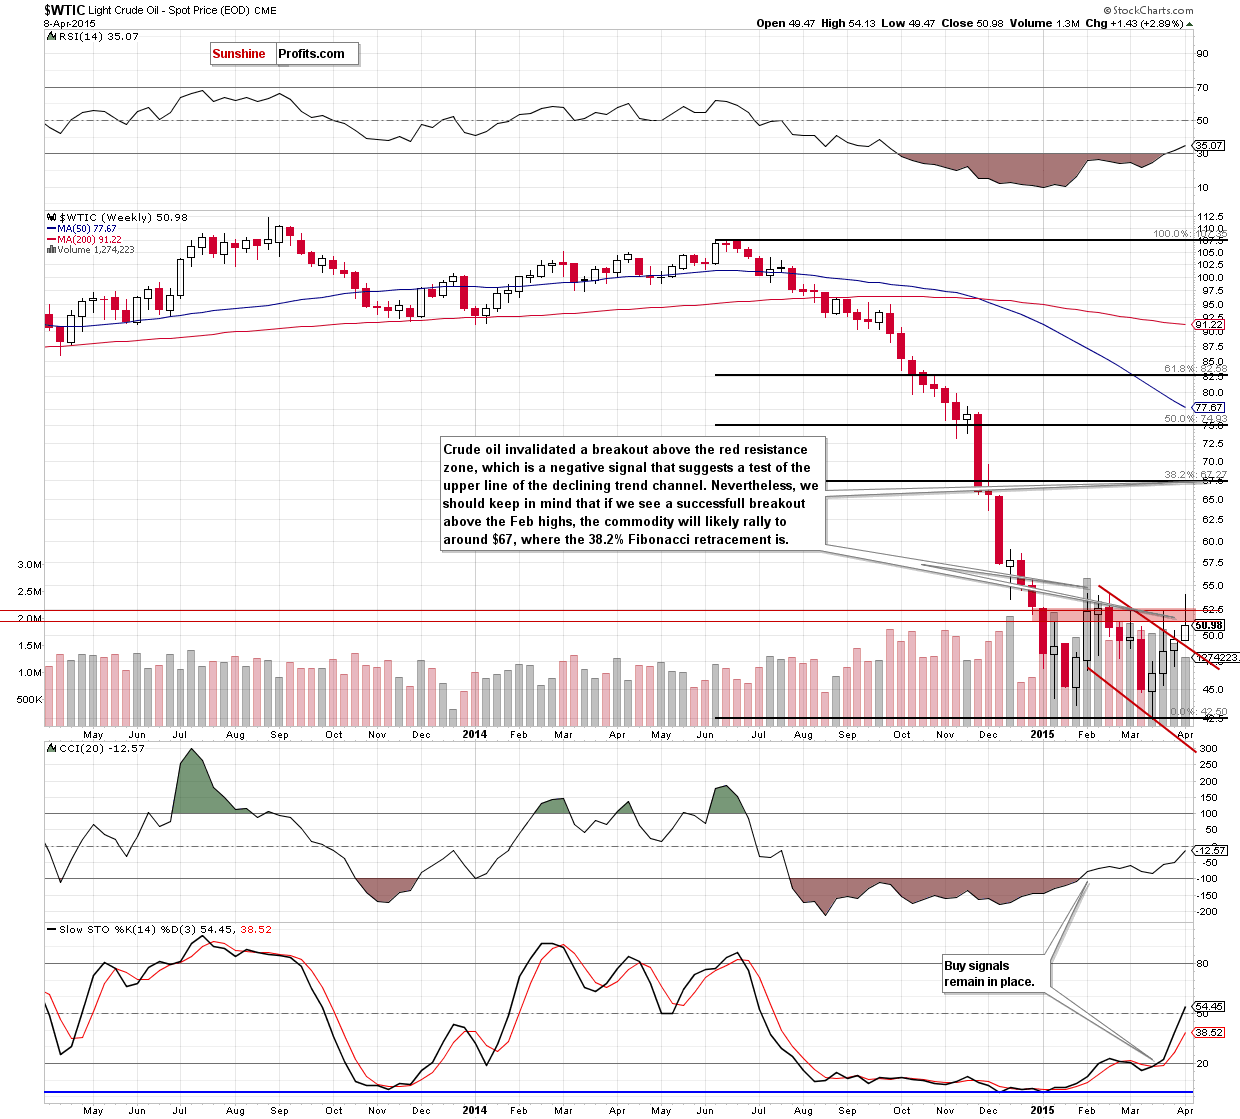
The first thing that catches the eye on the above chart is an invalidation of a breakout above the red resistance zone (created by the 76.4% and 78.6% Fibonacci retracement levels). This is a negative signal, which suggests a test of this week’s low or even the previously-broken upper line of the declining trend channel in the coming week.
Nevertheless, taking into account buy signals generated by the indicators and the size of the recent rally (it was the biggest upward move since June), it seems to us that higher values of the commodity are just around the corner (even if we see a short-term or even very short-term pullback in the coming days). In our opinion, until crude oil moves above the Feb 2015 high, the outlook will not become bullish enough to justify opening long positions in crude oil. However, if we see such price action, and crude oil climbs above $54.24, we can expect that an upward move will be sharp as the previous move lower was very sharp.
How high could the commodity go? From the medium-term perspective we see that there’s no significant resistance all the way up until the first of the classic Fibonacci retracement levels, which is much higher than the current crude oil price (around $67).
However, before we summarize this part of today’s Oil Investment Update, let’s take a closer look at the monthly chart and check the long-term resistance lines.
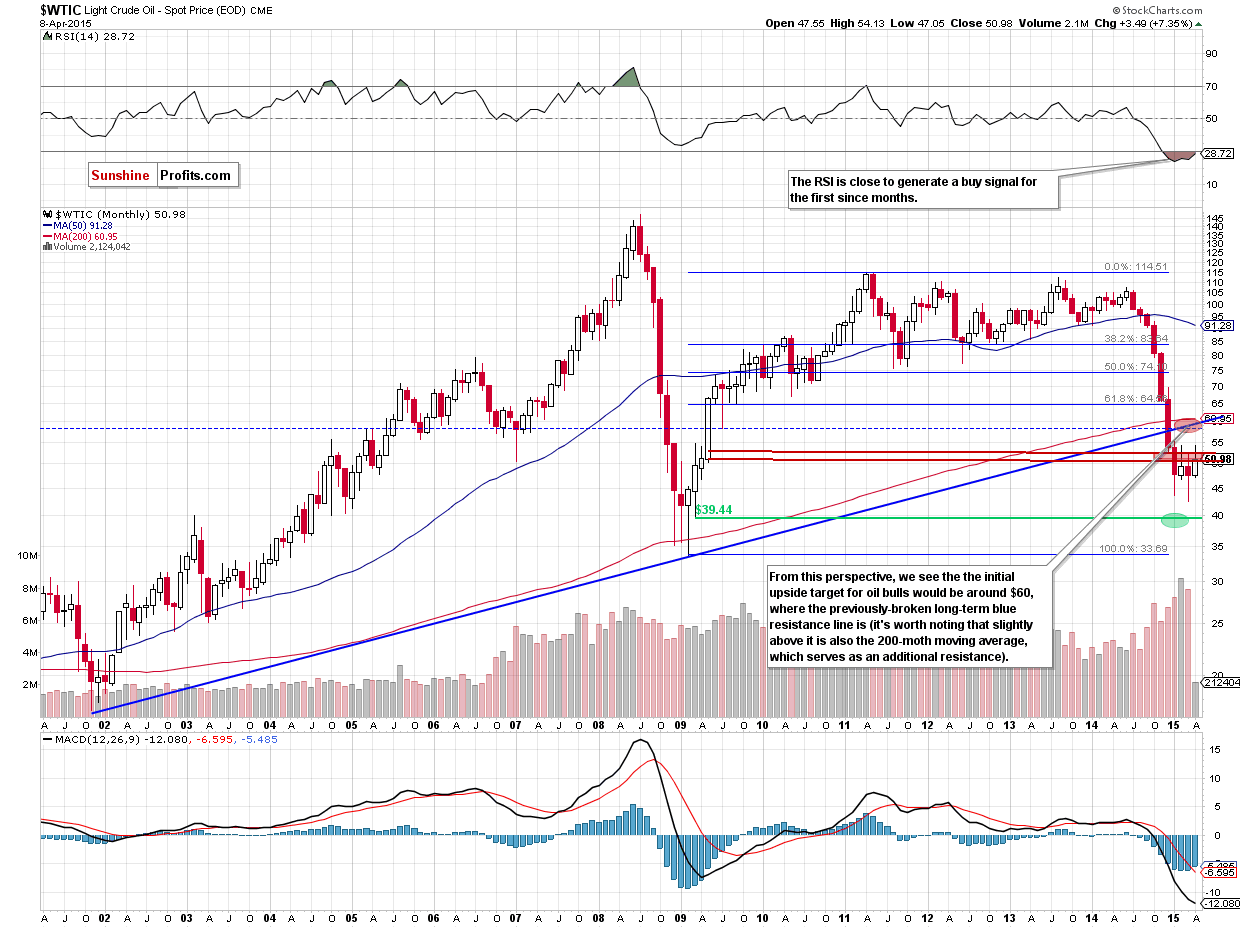
From this perspective, we see that before oil bulls push crude oil to the 38.2% Fibonacci retracement they will have to invalidate the breakdown under the long-term blue resistance line (currently around $60) and the 200-month moving average.
Summing up, although crude oil extended gains and broke above the upper line of the declining trend channel, the key resistance zone created by the Feb highs stopped further improvement, triggering a sharp pullback yesterday. With this downswing light crude invalidated earlier breakout above the red resistance zone (created by the Fibonacci retracement levels and marked on the weekly chart) and the blue support/resistance line, which is a negative sign that suggests further deterioration and a drop to around $49.20.
Will we see a rebound from there or further deterioration? Before we try to answer is question we’ll examine the current situation in oil socks and interesting ratios to have a more complete picture of the oil market.
Having discussed the situation in crude oil, let’s examine the NYSE Arca Oil Index (XOI) to find out what the current outlook for oil stocks is.
Oil Stocks
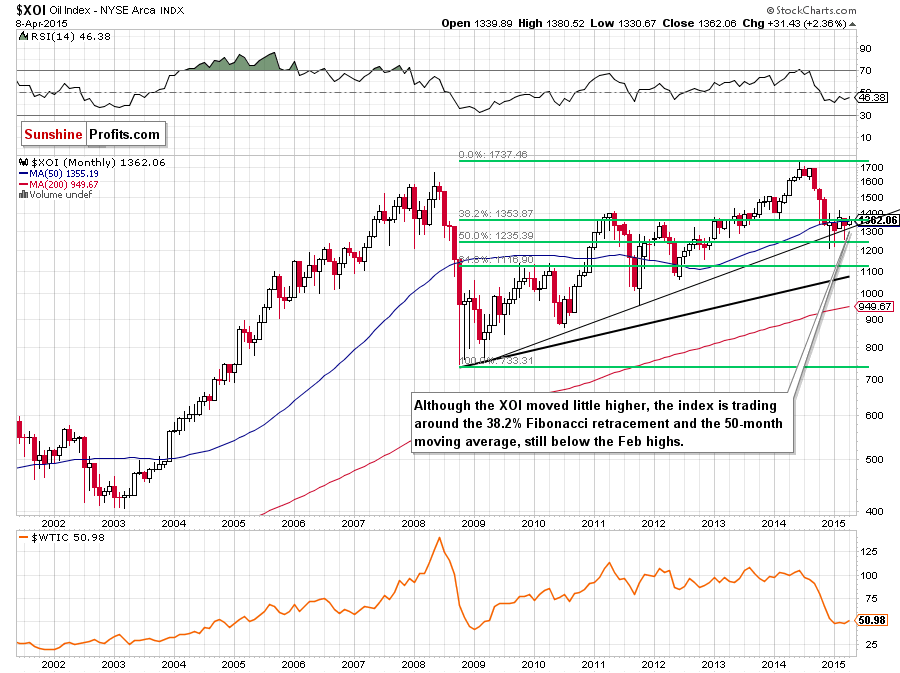
Looking at the above chart, we see that the situation in the long term hasn’t changed much as the XOI is trading in a narrow range between the long-term black support line (based on the Mar 2009 and Oct 2011 lows) and the Feb highs (around the 38.2% Fibonacci retracement level), which makes the picture unclear.
Will the weekly chart give us more clues about future moves? Let’s check.
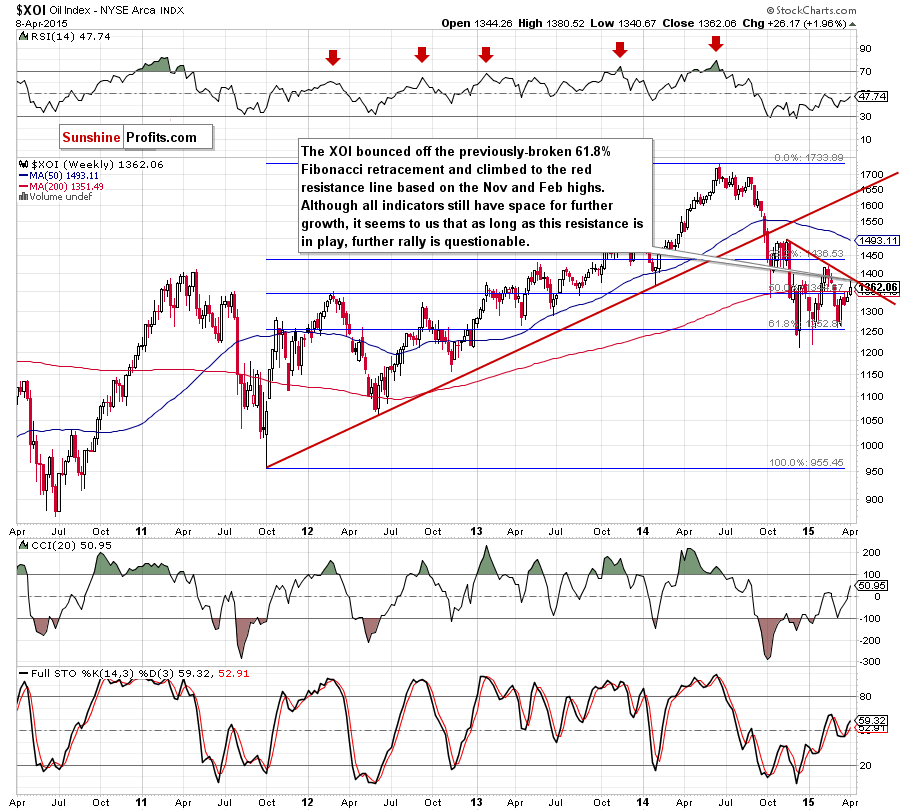
On the above chart, we see that although the XOI bounced off the previously-broken 61.8% Fibonacci retracement and climbed above the next retracement, the medium-term red resistance line based on the Nov and Feb highs stopped further improvement. Please note that although all indicators still have space for further growth, we think that as long as this resistance line is in play further rally is questionable and a pullback should not surprise us.
Additionally, this scenario is also reinforced by the short-term picture. Why? Let’s examine the daily chart and find out.
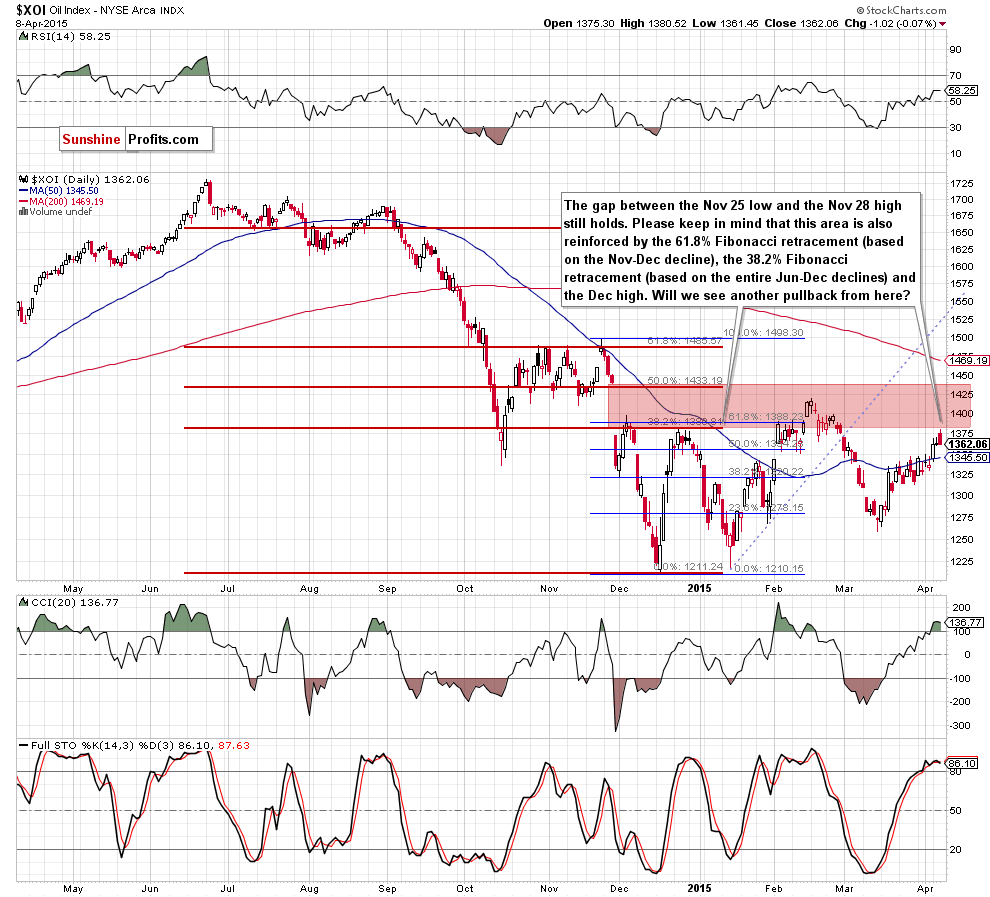
From this perspective, we see that although the XOI extended gains in the recent days, the very strong red resistance zone (created by the combination of the gap between the Nov 25 low and the Nov 28 high, the 38.2% Fibonacci retracement based on the Jun-Oct decline, the 61.8% Fibonacci retracement based on the Nov-Dec decline) stopped further improvement once again.
At this point, it’s worth noting that in all previous cases, this area was strong enough to trigger sizable pullbacks, which suggests that we could see similar price action in the coming days. Additionally, this scenario is also reinforced by the current position of the indicators (the CCI and Stochastic Oscillator are overbought, which will likely translate to sell signals in the near future). If this is the case, and oil stocks move lower, the initial downside target would be around 1,314, where the Mar 24 and Mar 27 lows are.
Summing up, although the XOI moved higher in the recent weeks, the very strong resistance zone (marked on the daily chart) still keeps gains in check. Additionally, this area is also reinforced by the medium-term resistance line, which suggests that as long as there is no breakout above this area another pullback is more likely than not. If this is the case, the initial downside target would be around 1,314, where the Mar 24 and Mar 27 lows are.
Ratio Analysis
Today, we start this section by focusing on the relationship between oil stocks and crude oil. What can we infer from the chart below?
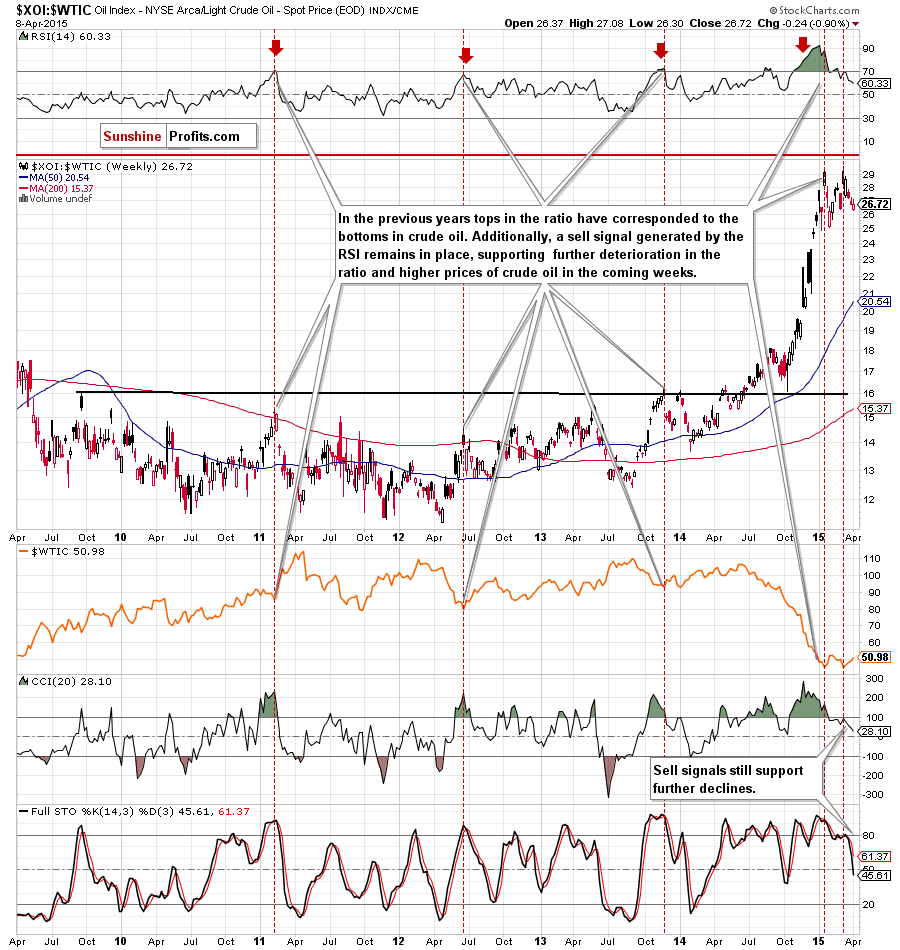
Looking at the above chart, we see that the ratio moved higher at the beginning of the previous month, but oil bulls didn’t manage to hold gained levels, which resulted in an invalidation of a breakout above the previous 2015 high. This negative signal triggered further deterioration and the ratio reached the bottom of the previous correction earlier this week. Although we could see a small rebound from here in the coming days, sell signals generated by the indicators are still in play, suggesting further deterioration.
If this is the case, we’ll see lower values of the ratio, which will likely translated to higher prices of crude oil – similarly to what we saw in the past (please keep in mind that many times in the previous years, local tops in the ratio have corresponded to the crude oil’s lows, for example in May 2010, Feb 2011, Jun 2012, May and Nov 2013).
In our previous Oil Investment Update we examined the stocks-to-oil ratio. Since then, the situation hasn’t changed much as the SPX:WTIC ratio still remains under the 38.2% Fibonacci retracement based on the entire 1998-2008 declines (this suggests that the space for further rally might be limited and anther downward move should not surprise us). Taking this fact into account, we decided to check whether we can infer something more about future crude oil’s moves from its inverse or not.
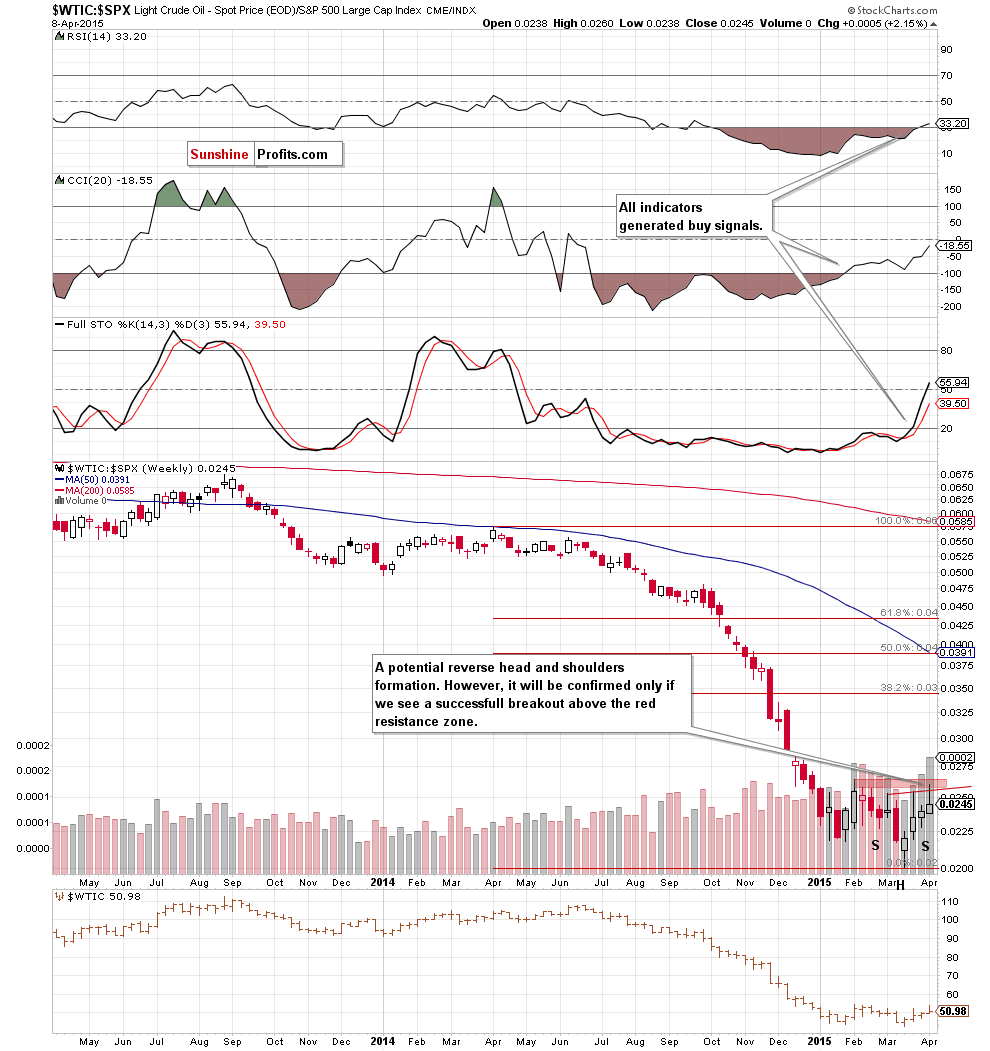
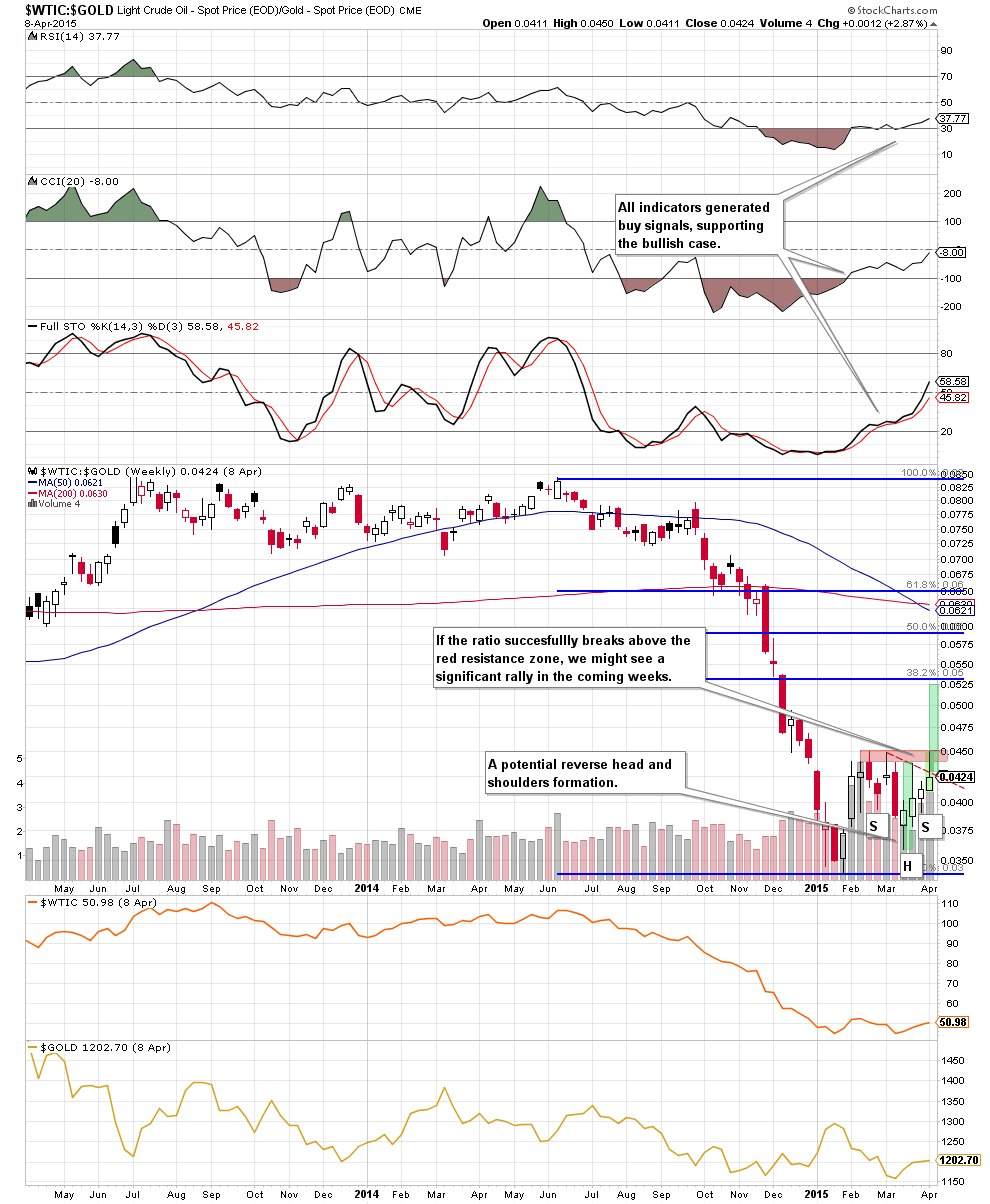
The first thing that catches the eye on the weekly chart is a potential reverse head and shoulders formation. Earlier this week, the ratio climbed above the neck line of the formation, but the resistance zone created by the Feb highs stopped further rally, triggering a pullback and invalidating earlier breakout. Despite this deterioration, we think that as long as the ratio remains above the right shoulder (around 0.0228) another attempt to break above the key resistance zone and further rally is likely – especially when we factor in the current position of the indicators (they all generated buy signals, supporting the bullish case).
What does it mean for crude oil? As you see on the above chart, the ratio and crude oil move in the same direction, which means that further improvement in the ratio will trigger higher values of the commodity.
And speaking of the reversal head and shoulders formation… checking all the charts that we have in our resources we found a very similar case.
Looking at the oil-to-gold weekly chart, we can also see a potential pro-growth formation. However, similarly to what we wrote earlier in case of the WTIC:SPX ratio, further rally will be likely only if we see a successful breakout above the red resistance zone created by the Feb and Mar highs. If we see such price action, it would be a strong bullish signal, which will trigger a rally to around 0.0525, where the size of the upward move will correspond to the height of the formation and where the 38.2% Fibonacci retracement based on the Jun-Jan declines are (please note that buy signals generated by the indicators still support the above-mentioned bullish scenario).
However, to have a more complete picture of the relationship between crude oil and gold, we also decided to examine the reversal of the above-described ratio. Will we receive any valuable clues about future moves? Let’s find out.
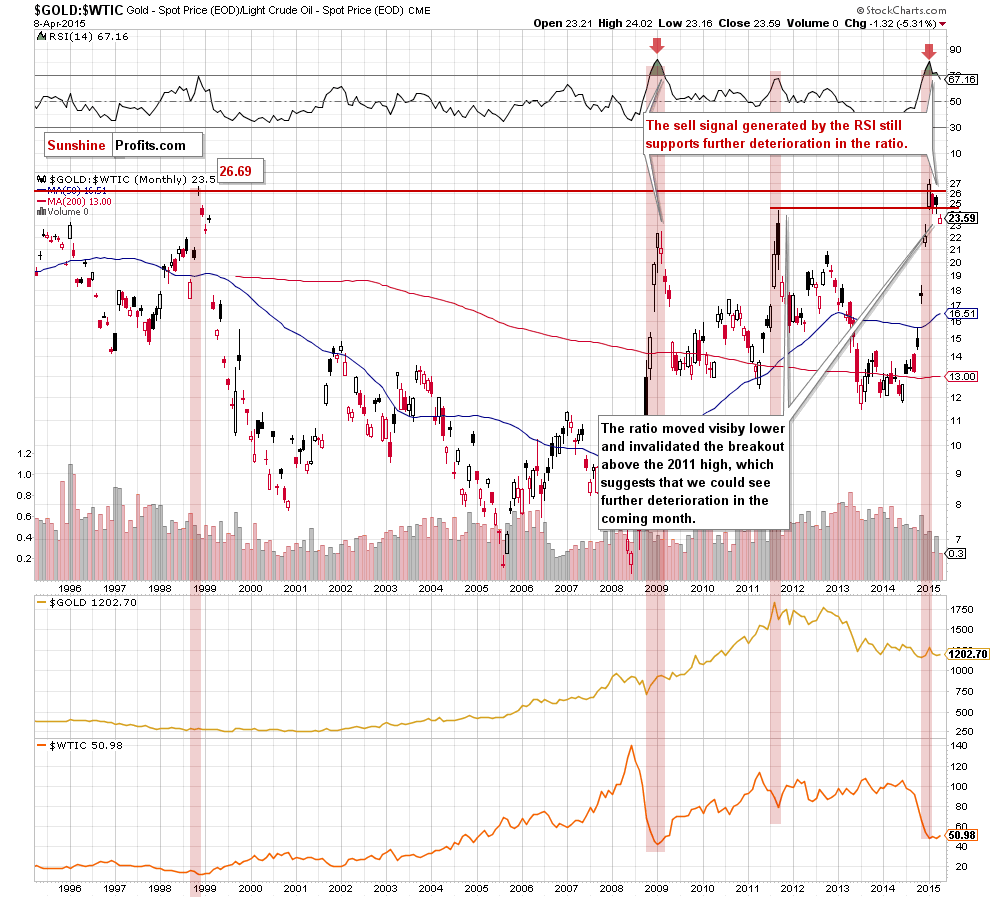
From today’s point of view, we see that the overall situation hasn’t changed much as the ratio declined under the 2011 high once again. Taking this invalidation of the breakout into account and combining it with the sell signal generated by the RSI, we think that further deterioration in GOLD:WTIC in the coming month is more likely than not. If this is the case, we’ll see higher prices of crude oil in the coming weeks.
How such price action could affect gold? We think that the best answer to this question will be the quote from our last Oil Investment Update:
(…) since 2011 significant drops in the ratio have translated to lower values of the commodity. We saw such price action between Sep and Dec 2011 and then between Oct 2012 and Jun 2013. Taking this fact into account, and the recent price moves in gold, it seems that history will repeat itself once again and we see lower prices of the commodity in the coming month. Nevertheless, if you want to keep up with the changes taking place every day and receive trading signals, we encourage you to read our daily Gold & Silver Trading Alerts.
Non-USD Crude Oil Price
Know the situation for the above ratios, let’s move on to the non-USD (WTIC:UDN ratio) chart of crude oil. As a reminder, UDN is the symbol for the PowerShares DB US Dollar Index Bearish Fund, which moves in the exact opposite direction to the USD Index. Since the USD Index is a weighted average of the dollar's exchange rates with world's most important currencies, the WTIC:UDN ratio displays the value of crude oil priced in "other currencies".
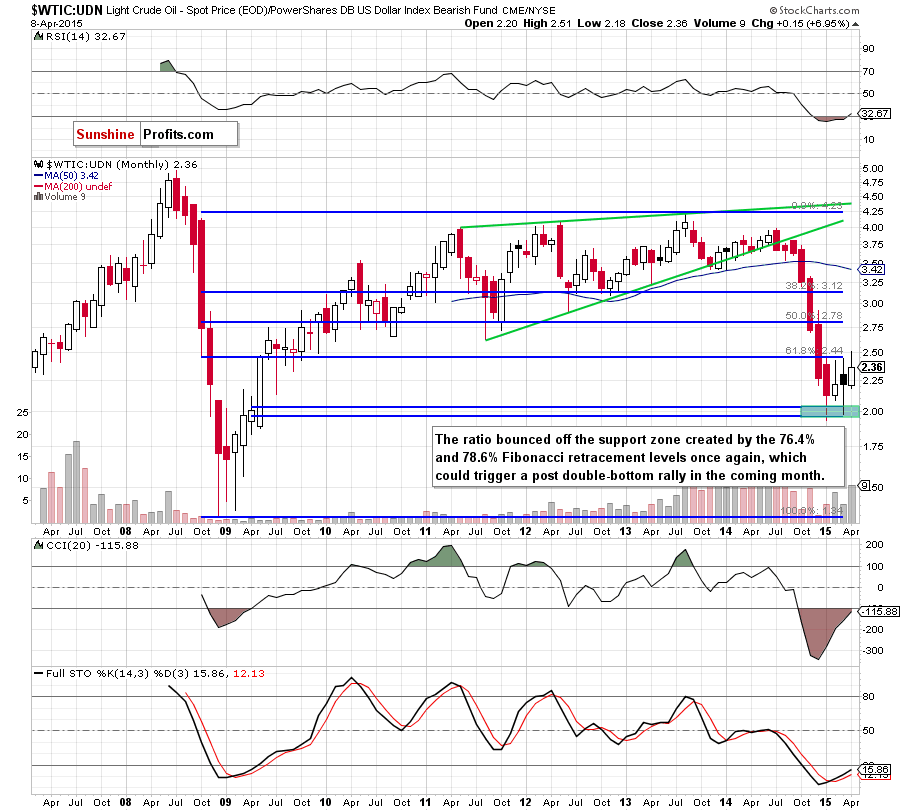
As you see on the monthly chart, although the ratio moved sharply lower in the previous month, the solid support zone created by 76.4% and 78.6% Fibonacci retracement levels (marked with green) withstood the selling pressure once again. What’s interesting, we didn’t see a fresh 2015 low, which means that a post double-bottom rally might be just around the corner.
Looking at the above chart, we see that the WTIC:UDN ratio moved higher earlier this month and climbed above the recent highs, which is a bullish signal. Additionally, the RSI and Stochastic Oscillator generated buy signals, while the CCI is very close to do the same, which suggests that a trend reversal increased significantly. Nevertheless, in our opinion, a sizable rally will be more likely if we see a monthly close above the Jan and March highs, which will be equivalent to an invalidation of the breakdown under the 61.8% Fibonacci retracement based on the entire 2008-2013 rally.
Scenarios
Just like a month ago, today’s Oil Investment Update includes scenarios of what could happen in the coming weeks. Naturally, we will continue to monitor the market in the coming days and if anything invalidates our long-term outlook we will send you an additional message.
- Bullish scenario
If crude oil breaks above the major resistance zone created by the 76.4% and 78.6% Fibonacci retracement levels (marked with red on the weekly chart) and (most importantly) the Feb highs, we’ll likely see further improvement and the initial upside target would be around $60. If mid-Dec highs are broken, the next target for oil bulls would be around $67 (the 38, 2% Fibonacci retracement based on the entire Jun-Jan declines) or even around $76 (the 50% Fibonacci retracement). - Bearish scenario
If the commodity extended losses and broke below the red support line (marked on the daily chart), we’ll see a decline to around $47.05 (the bottom of the previous pullback). If this support level is broken, we might see a drop to $46.88 (the 61.8% Fibonacci retirement based on the entire recent rally) or even to $44.91-$45.17, where the support zone created by the 76.4% and 78.6% Fibonacci retracement levels are.
Summary
Although the breakouts above the upper line of the declining trend channel (marked on the weekly chart) and declining resistance lines (marked on the daily chart with blue and red) were encouraging, they didn’t make the outlook bullish because the major resistance levels created by the Feb highs remained unbroken. As a result, crude oil erased some gains, but it seems that even if the commodity corrects the recent rally (to $46.88 or even to $44.91-$45.17), fresh 2015 lows in the coming month are not likely to be seen. Why? Firstly, the Mar-Apr rally was the biggest since June and reached the previous highs. As a reminder, in all previous cases corrective upswing were shallow (even the Jan-Feb increase erased only 62% of the preceding downward move) and short-lived (mainly in the form of consolidation). Secondly, there are potential reverse head and shoulders formations in the oil-to-stocks and oil-to-gold ratios. Thirdly, there was no fresh 2015 low in March in the case of crude oil priced in "other currencies", which could translate into a post double-bottom rally. On top of that, weekly indicators generated buy signals, supporting the bullish case (not only in crude oil, but also in the case of the above-mentioned ratios). All the above provides us with bullish implications, suggesting that further rally in crude oil is just around the corner, even if we see a short- or very short-term correction in the coming days. Nevertheless, in our opinion, this pro-growth scenario will be more likely if we see a confirmed breakout above the Feb highs.
Finishing today’s Oil Investment Update, we would like to draw your attention to the fact that from the technical point of view crude oil is “ready” for further improvement. Nevertheless, as we have pointed out before, as long as there are no significant signs that a supply glut is getting smaller (for example, by reducing domestic inventories), sizable rally to the levels that we have seen in the autumn is questionable.
Very short-term outlook: mixed
Short-term outlook: mixed
MT outlook: mixed
LT outlook: bullish
Trading position (our opinion):No positions are justified from the risk/reward perspective at the moment. However, if we see a successful breakout above the Feb highs, we’ll consider opening long positions. Until this time, waiting on the sidelines for the confirmation/invalidation of the above is the best choice. We will keep you informed should anything change.
This completes this month’s Oil Investment Update. Our next Oil Investment Update is scheduled for Thursday, May 7, 2015. Oil Trading Alerts subscribers will additionally receive similar but shorter alerts on a daily basis (or more than once a day when the situation requires it). You – Oil Investment Updates subscribers – will receive short Investment Alert messages should the outlook for the medium or long term change before the next Update is posted.
Thank you.
Nadia Simmons
Forex & Oil Trading Strategist
Oil Investment Updates
Oil Trading Alerts

