

The highlight of the previous month was the first monthly increase since June when crude oil began declines. The commodity gained 3.49% and bounced of the Apr 2009 lows once again, which encouraged oil bulls to act and translated to further rally in the recent days. As a result, light crude climbed above $51 and invalidated the breakdown under important short-term support line. Does it mean that the worst is behind us? Or maybe this is another pause before new lows?
The first monthly gain after such long period of declines and a comeback above the barrier of $50 are positive signals. Nevertheless, from today’s point of view, it is hard to define what the key driver behind this increase was. Without a doubt oil investors were mainly focused on Wednesday’s EIA data on domestic crude oil inventories and Friday’s Baker Hughes reports. In the previous weeks, crude oil has dropped on EIA reports of inventory builds, but then rallied on Fridays and erased losses after this industry firm showed another fall in the U.S. oil rig count. Nevertheless, this relationship has changed as Baker Hughes report on Feb 20 disappointed market participants, showing that the number of rigs drilling for oil in the U.S. fell by just 37 compared to a decline of 84 rigs a week earlier. Last Friday, the firm reported that the number of rigs dropped to the lowest since June 2011, but did this fact affect production? Not at all! Yesterday, the U.S. Energy Information Administration (EIA) reported that crude oil inventories rose by 10.3 million barrels for the week that ended Feb. 27, missing expectations for an increase of 4.0 million barrels. It was the largest weekly increase since 2002 and U.S. crude oil inventories stood at 444.4 million barrels as of last week, which is the highest level since at least 80 years. Additionally, at the Cushing Oil Hub in Oklahoma, inventory levels increased to 49.2 million barrels, which clearly shows that production didn’t fell (and likely won’t fall as quickly as some had hoped) to balance the market.
Yesterday, the above-mentioned disappointing numbers were alleviated by the Tehran's ambassador commentary, who said that no deal had been reached on the duration of any possible final agreement with world powers on Iran's program. That news fuelled hopes that an imminent rise in Iranian oil supply will not add to global market and pushed light crude to an intraday high of $51.99.
Nevertheless, it seems that as long as there are no declines in domestic crude oil inventories a sharp rally is not likely to be seen. Instead, we’ll likely see short-lived upswings triggered by positive economic data from the world’s largest oil consumers and importers (for example, Friday’s Japanese industrial production month-on-month increase by 4.0%, better than forecasts of a 2.7% gain, fueled hopes over demand growth for the third world’s largest oil importer, starting the recent rally).
Having said that, let’s jump into the world of charts to find out what are they saying about future moves (charts courtesy of http://stockcharts.com).
Crude Oil
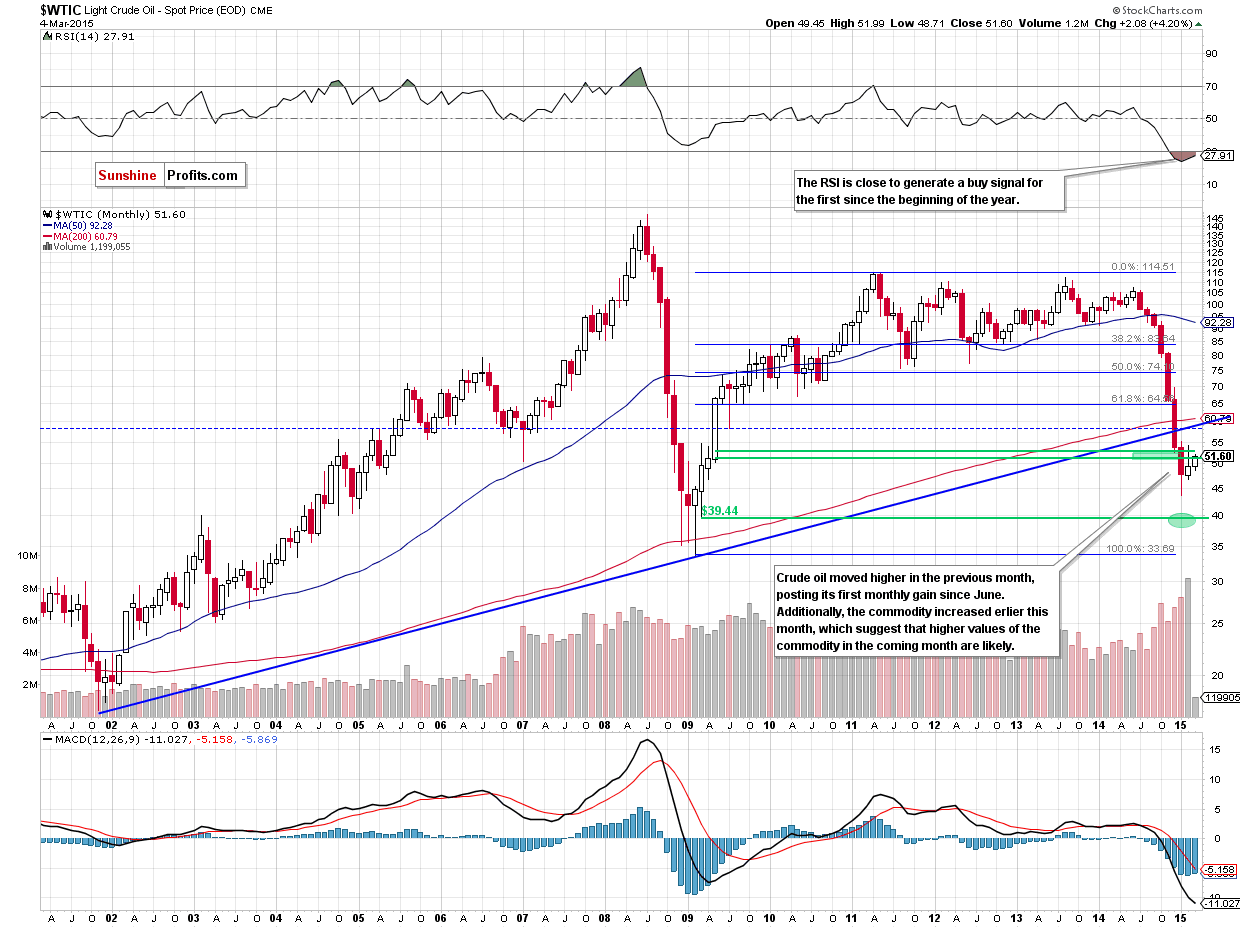
Looking at the above chart, we see that crude oil moved higher in Feb, posting its first monthly gain since last June when the price of the commodity began declines. Although light crude gave up some gains and closed the previous month under the resistance zone created by the 76.4% and 78.6% Fibonacci retracement levels, the commodity reversed in the recent days. What does it mean for crude oil?
Let’s take a closer look at the weekly chart and find out.
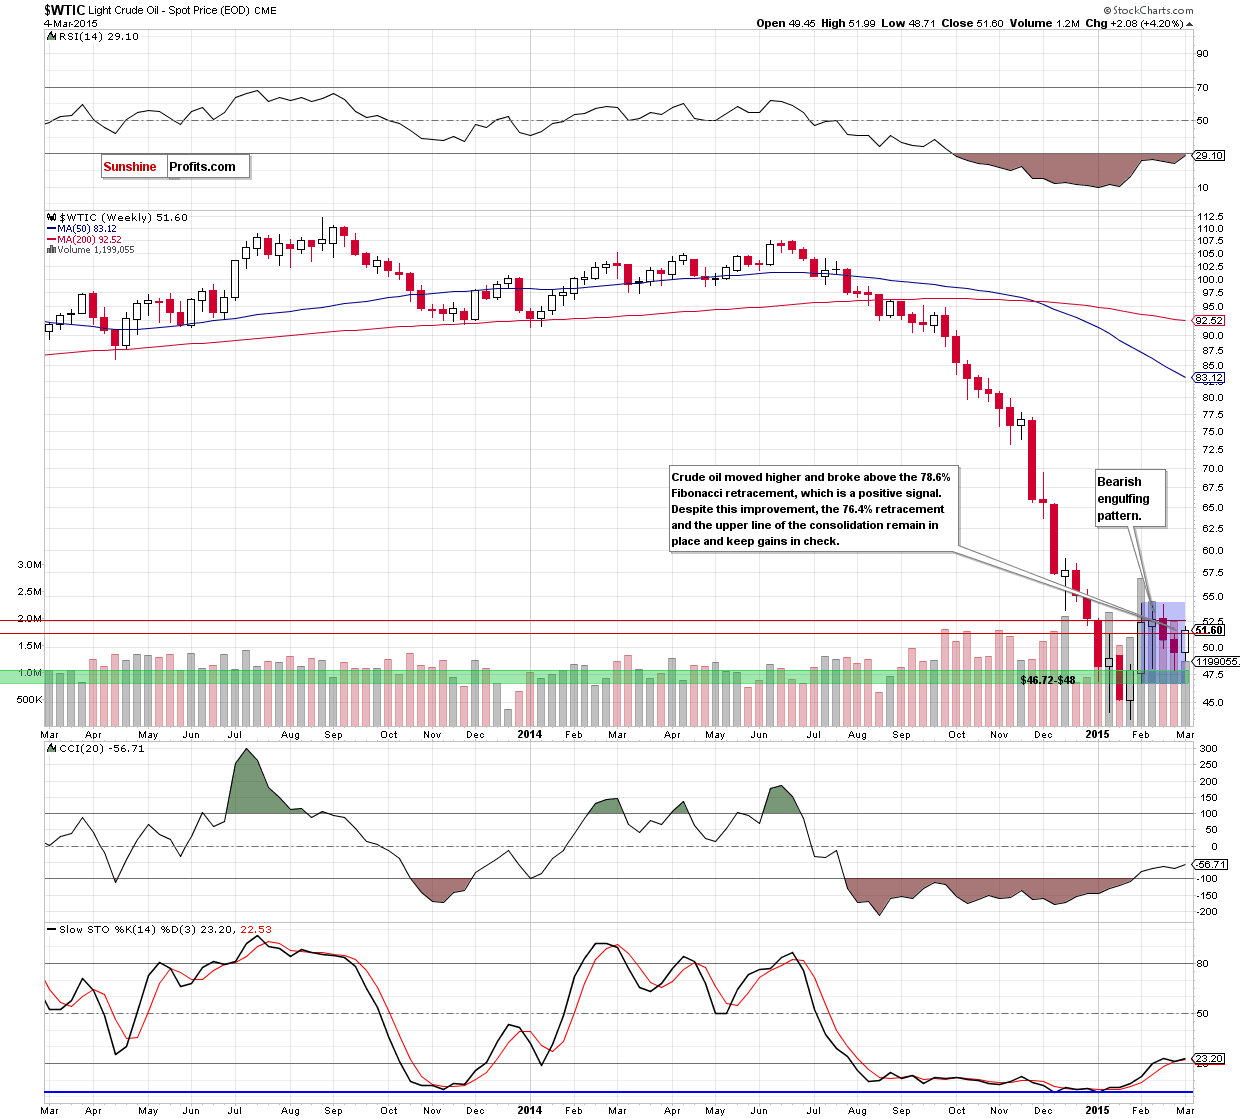
From the medium-term perspective, we see that crude oil extended gains and climbed above the 78.6% Fibonacci retracement, invalidating earlier breakdown. Although this is a positive signal, we should keep in mind that the commodity still remains the under the 76.4% retracement level and the upper line of the consolidation (which also reinforced by the Dec lows), while the bearish engulfing pattern is still in play. In our opinion, the medium-term picture will improve significantly, if we see a breakout above these levels.
Meanwhile, let’s examine the daily chart and find out how this rally affected the very short-term picture.
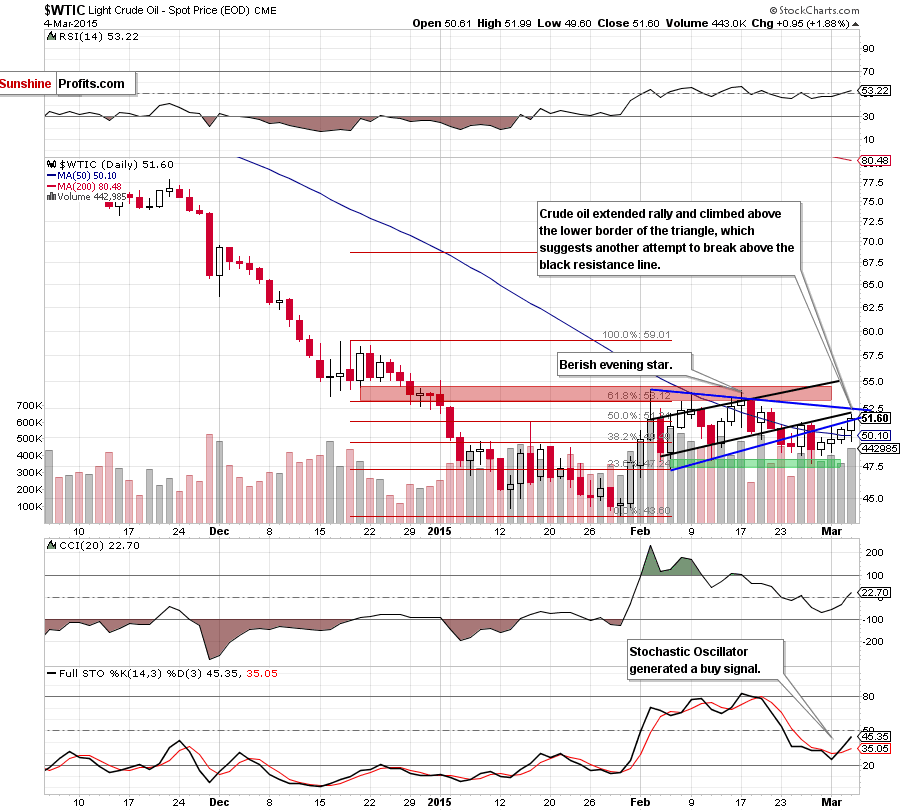
From this perspective, we see that crude oil moved higher once again and climbed above the lower border of the blue triangle, which is a positive signal. Additionally, yesterday’s move materialized on higher volume than we saw in the previous days, which suggests that we’ll see another attempt to break above the black resistance line in the coming day(s). If we see such price action, the probability of a breakout above the upper line of the formation will increase. If this is the case, oil bulls will open the way to the Feb highs. At this point, it’s worth noting that the Stochastic Oscillator generated a buy signal, supporting the above-mentioned scenario. Nevertheless, taking into account the medium-term picture, we should keep in mind that if the black resistance line withstands the buying pressure, light crude will reverse and test the blue support line.
Summing up,crude oil moved higher once again and invalidated the breakdown under the lower border of the blue triangle (marked on the daily chart) and the 78.6% Fibonacci retracement (seen on the weekly and monthly charts), which suggests another attempt to break above the black resistance line and the 76.4% retracement level in the coming day(s). If we see such price action, and crude oil additionally increases above the upper line of the triangle, we’ll consider opening long positions. Until this time, waiting on the sidelines for a confirmation/invalidation of the above is the best choice at the moment.
Having discussed the situation in crude oil, let’s examine the NYSE Arca Oil Index (XOI) to find out what the current outlook for oil stocks is.
Oil Stocks
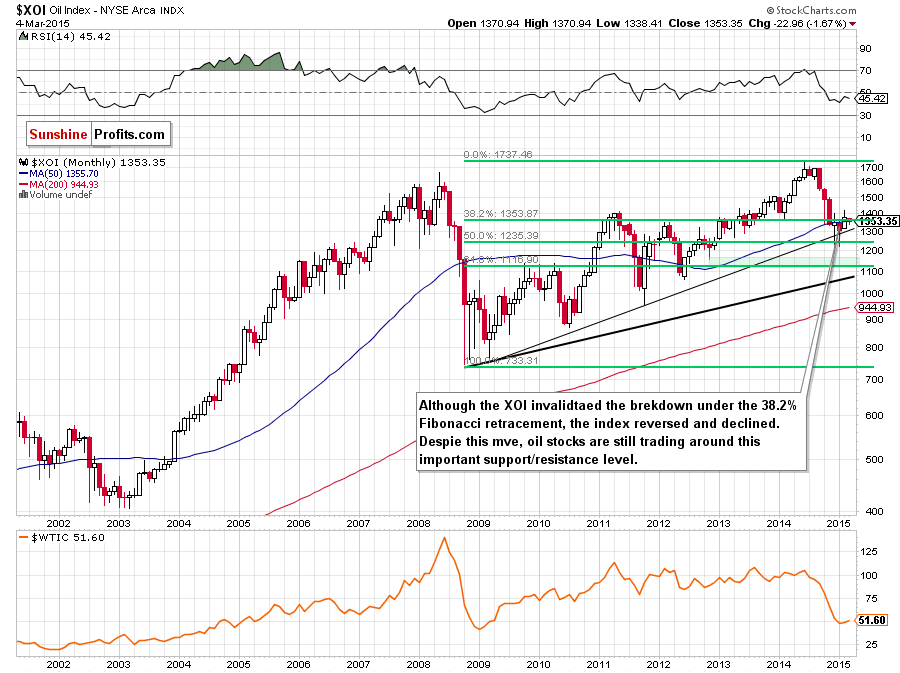
From the long-term perspective, we see that although the XOI invalidated the breakout above the 38.2% Fibonacci retracement (based on the entire 2008- 2014 rally) and the 50-month moving average (which is a bearish signal), the index still remains above the previously-broken long-term support/resistance line (based on the Mar 2009 and Oct 2011 lows), which serves as the key support at the moment.
Will we see a test of the strength of this important support in the coming month? Let’s examine the weekly chart and find out.
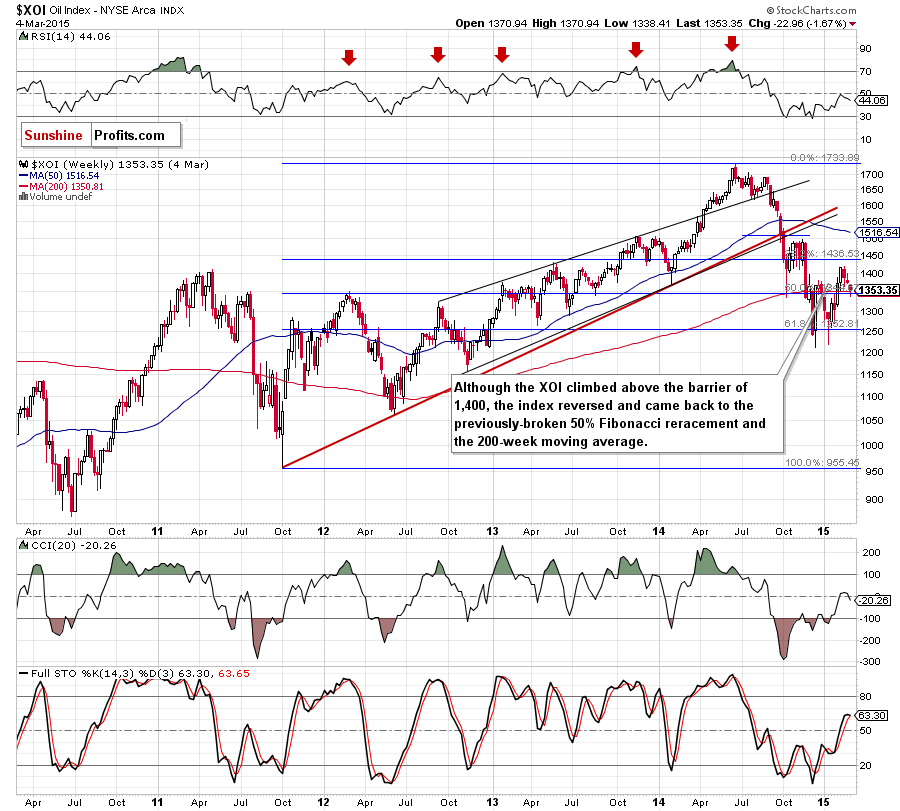
On the above chart, we see that although the XOI climbed above the barrier of 1,400, the index reversed and came back to the previously-broken 50% Fibonacci retracement level (based on the 2011-2014 increase) and the 200-week moving average. If this support area withstands the selling pressure, we’ll see a rebound from here to around 1,400. However, if it is broken, the initial downside target for oil bears would be around 1,320, where the 50% Fibonacci retracement (based on the entire Jan-Feb rally) is. Nevertheless, if oil bulls fail there, the next support would be at 1,300, where the next psychologically important level is. Which scenario is more likely at the moment? Basing only on the current position of the CCI and Stochastic Oscillator it seems to us that the next move will be to the downside (especially if the latter indicator generates a sell signal).
However, to have a more complete picture of the current situation in the XOI, let’s zoom in our picture and look for more clues about future moves on the daily chart.
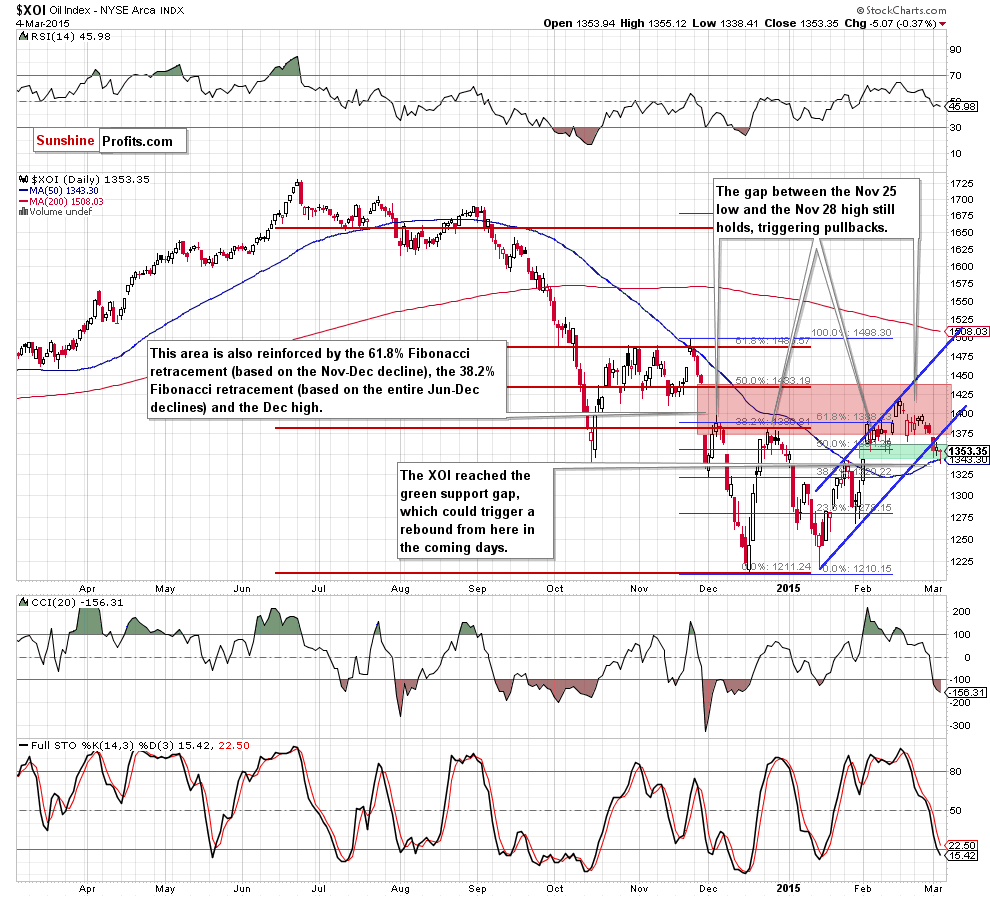
Looking at the above chart, we see that although the XOI moved higher in the previous month, the strong resistance zone created by the combination of the 38.2% Fibonacci retracement (based on the Jun-Oct decline), the 61.8% Fibonacci retracement (based on the Nov-Dec decline), and the Dec 3 high stopped further improvement once again. As a result oil stocks reversed and broke below the lower border of the rising trend channel, which is a negative signal that suggests further deterioration. Nevertheless, when we take a closer look at the above chart, we see that the recent decline took the XOI to the green support zone created by the gap (between Feb 2 high and Feb 3 low), the 38.2% Fibonacci retracement (based on the Jan-Feb rally) and the 50-day moving average, which could trigger a rebound from here in the coming day(s). On the other hand, if the XOI closes the day under these levels, it would be a strong negative signal, which will took oil stocks to the 50% (around 1,320) or even 61.8% Fibonacci retracement (around 1,295). At this point, it is worth noting that in this area the size of the downswing will correspond to the height of the rising trend channel, which could reduce the selling pressure. Taking into account the current position of the daily indicators (sell signals remain in place), it seems that another downswing should not surprise us.
Summing up,oil stocks reached the support zone created by the gap (between Feb 2 high and Feb 3 low), the 38.2% Fibonacci retracement (based on the Jan-Feb rally) and the 50-day moving average, which could trigger a rebound from here in the coming day(s). Nevertheless, taking into account the current position of the daily and weekly indicators, it seems that oil bears will show their claws once again and push the index lower. If this is the case, the initial downside target would be around 1,320, where the 50% Fibonacci retracement based on the Jan-Feb rally (and located slightly lower the previously-broken long-term support/resistance line based on the Mar 2009 and Oct 2011 lows) is
Ratio Analysis
Today, we start this section by focusing on the oil-to-oil stocks ratio. What can we infer from the chart below?
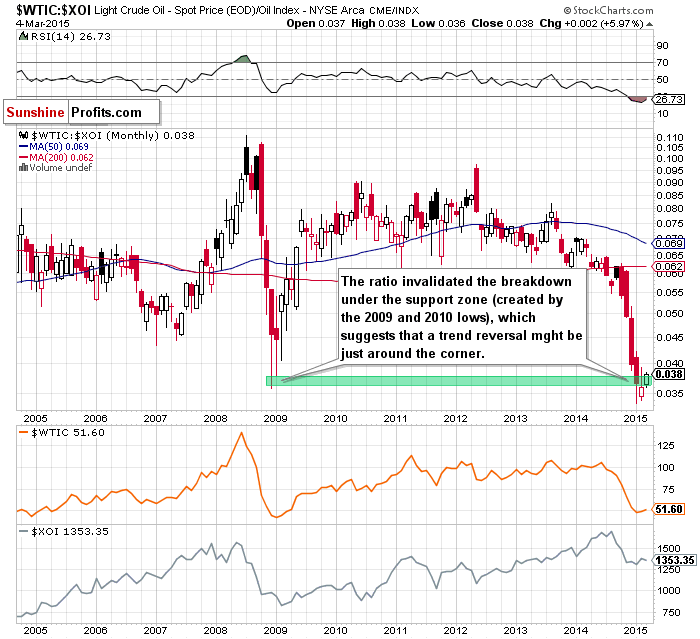
The first thing that catches the eye on the above chart is invalidation of the breakdown under the support zone (created by the 2009 and 2010 lows), which suggests that a trend reversal might be just around the corner.
However, to have a more complete picture of the relationship between crude oil and oil stocks, we decided to examine the reversal of the above-described ratio. Will we receive any valuable clues about future moves? Let’s find out.
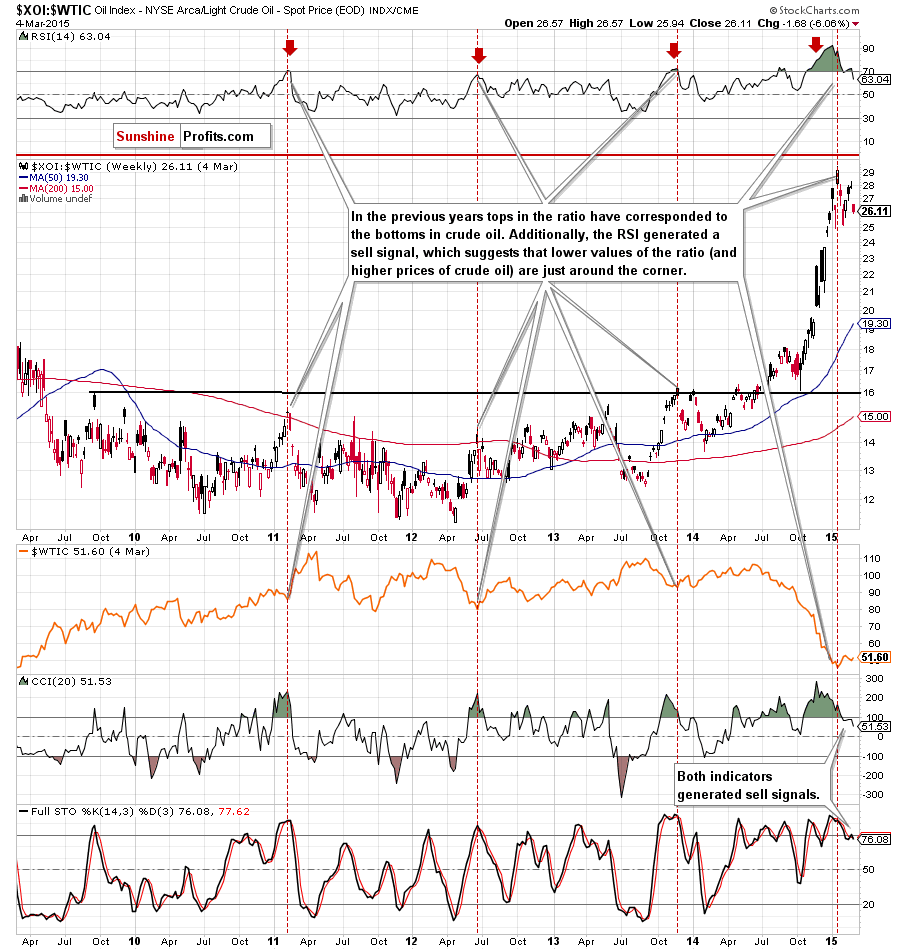
Looking at the above chart, we see that the ratio moved lower in the recent weeks, which translated to higher prices of crude oil (and lower values of the XOI). As a reminder, may times in the past local tops in the ratio have corresponded to the crude oil’s lows. We saw such price actions in May 2010, Feb 2011, Jun 2012, May and Nov 2013. Additionally, when we take a closer look at the above chart, we see that the RSI generated a sell signal, which suggests further deterioration in the ratio and an upward move in crude oil. Taking these facts into account, and combining it with sell signals generated by the CCI and Stochastic Oscillator, we think that history will repeat itself once again and we’ll see further improvement in crude oil in the coming weeks.
Having said that, let’s examine the relationship between the general stock market and crude oil to check if it confirms or invalidates the conclusions of the above analysis of the oil-stocks-to-oil ratio.
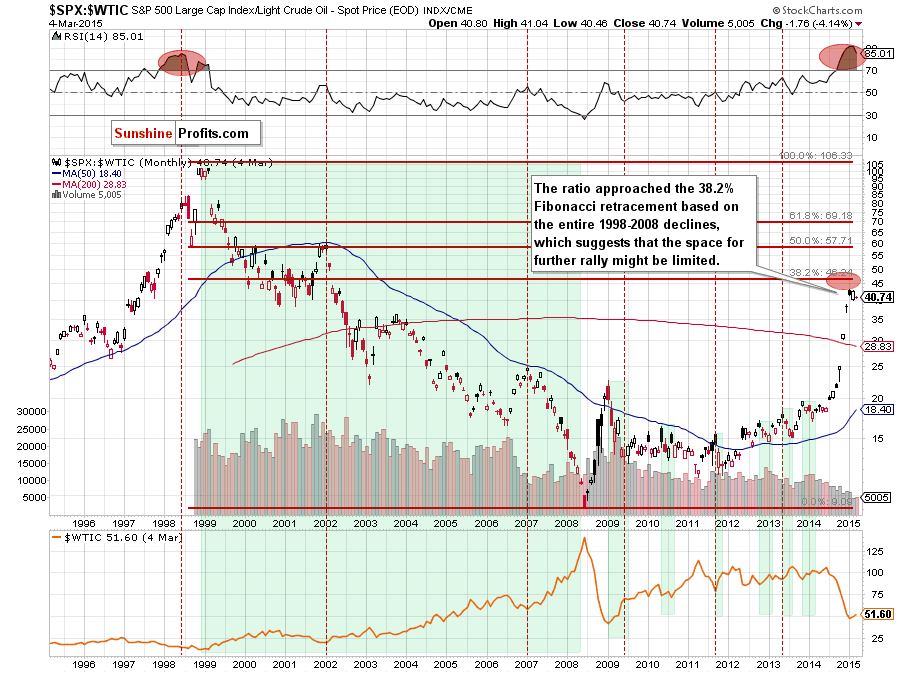
From this perspective, we see that the ratio still remains under the 38.2% Fibonacci retracement (based on the entire 1998-2008 declines), which suggests that if this resistance level withstands a potential upswing, we might see a bigger correction in the ratio. What could happen if we see such price action? We believe that a quote from the last Oil Investment Update will be the best answer to this question:
(…) the space for further rally might be limited. If this is the case, and the ratio finally declines, we’ll see higher values of the commodity – similarly to what we saw in the past (for example between 1999 and 2008, from Jan 2009 to Jun 2009, from May 2010 to Apr 2011, from Sep 2011 to Nov 2011, from Oct 2012 to Jan 2013, from May 2013 to Aug 2013 and from Nov 2013 to Feb 2014). Taking all the above into account, we believe that it is worth to keep an eye on this ratio’s moves because a reversal in the ratio will probably indicates a final bottom in crude oil.
Once we know the current situation in the stocks-to-oil ratio, let’s analyze the gold-to-oil ratio.
In our previous Oil Investment Update, we wrote the following:
(…) the ratio reversed and declined, invalidating earlier breakout, which translated to the recent rally in the commodity. Taking into account the above-mentioned relationship and combining it with an invalidation of the breakout and the current position of the RSI, we think that a bigger correction in the ratio is just around the corner. At this point, it’s worth noting that in the previous years, similar (or even lower) readings of the indicator preceded tops in ratio and local bottoms in crude oil. Therefore, it seems to us that higher values of crude oil in the coming month should not surprise us.
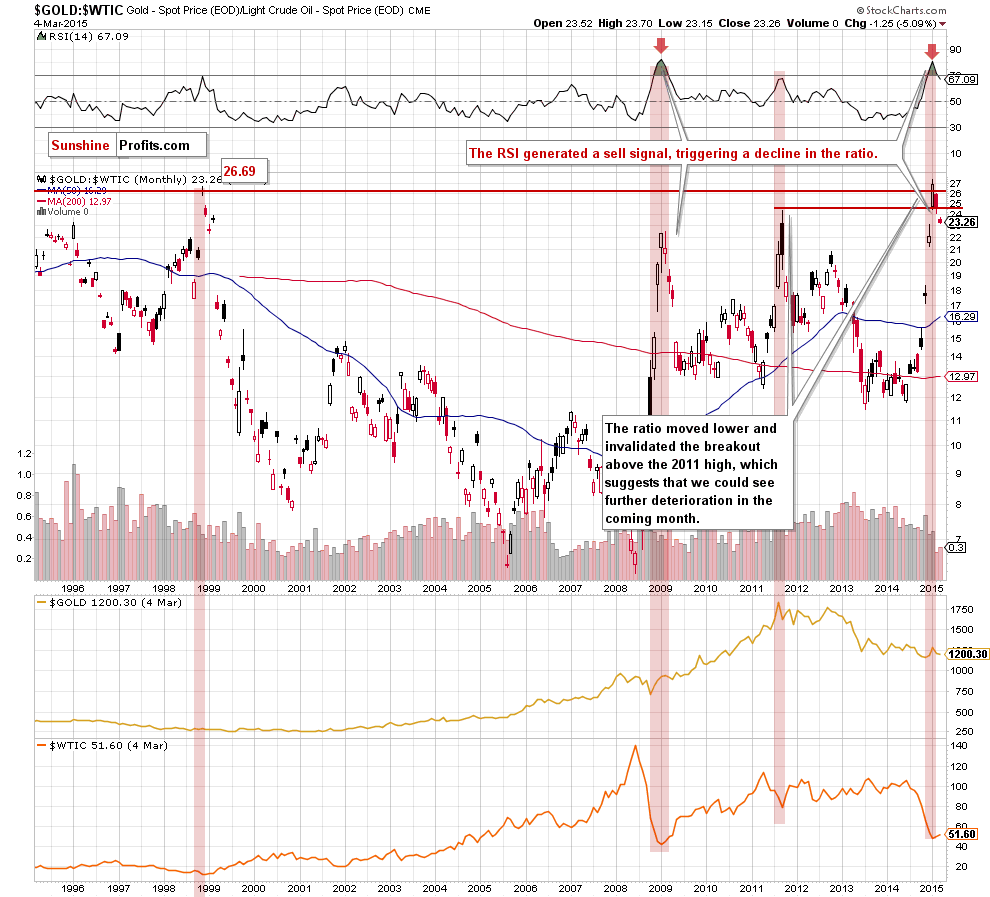
As you see on the monthly chart, the situation developed in line with the above-mentioned scenario and the ratio moved lower, triggering an upward move in crude oil. When we take a closer look, we see that the recent decline took the ratio below the 2011 high, which is a bearish signal that suggests further deterioration in GOLD:WTIC in the coming month. Taking this fact into account, and combining it with the above-mentioned relationship, it seems to us that higher prices of crude oil are just around the corner.
How such price action could affect gold? As you see on the above chart, since 2011 significant drops in the ratio have translated to lower values of the commodity. We saw such price action between Sep and Dec 2011 and then between Oct 2012 and Jun 2013. Taking this fact into account, and the recent price moves in gold, it seems that history will repeat itself once again and we see lower prices of the commodity in the coming month.
Nevertheless, if you want to keep up with the changes taking place every day and receive trading signals, we encourage you to read our daily Gold & Silver Trading Alerts.
Non-USD Crude Oil Price
Know the situation for the above ratios, let’s move on to the non-USD (WTIC:UDN ratio) chart of crude oil. As a reminder, UDN is the symbol for the PowerShares DB US Dollar Index Bearish Fund, which moves in the exact opposite direction to the USD Index. Since the USD Index is a weighted average of the dollar's exchange rates with world's most important currencies, the WTIC:UDN ratio displays the value of crude oil priced in "other currencies".
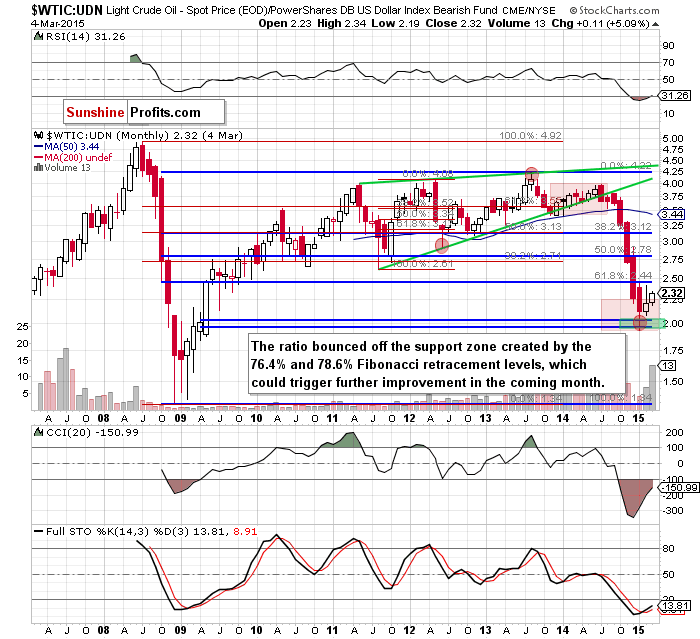
As you see on the monthly chart, although the ratio gave up some gains in the previous month, it was the first monthly gain since June and the WTIC:UDN closed well above the solid support zone created by 76.4% and 78.6% Fibonacci retracement levels (marked with green). As a reminder, in the past, this support/resistance area was strong enough to trigger a trend reversal. We saw such price action, for example, in Jun 2012 or in Aug 2013 (both marked with red ellipses). Additionally, earlier this month, the ratio extended gains, approaching the last month’s high. This is a positive signal, which in combination with a buy signal generated by the Stochastic Oscillator and the RSI suggests that even if crude oil priced in "other currencies" moves little lower, the probability of a trend reversal increased significantly. Nevertheless, in our opinion, a sizable rally will be more likely if we see a comeback above the Jan and Feb highs, which will be equivalent to an invalidation of the breakdown under the 61.8% Fibonacci retracement based on the entire 2008- 2013 rally.
Crude Oil - US Dollar Link
Know the situation for the above ratios, let’s move on to the current situation in the USD Index as the U.S. dollar was one of the major forces, which affected the price of the commodity in recent months.
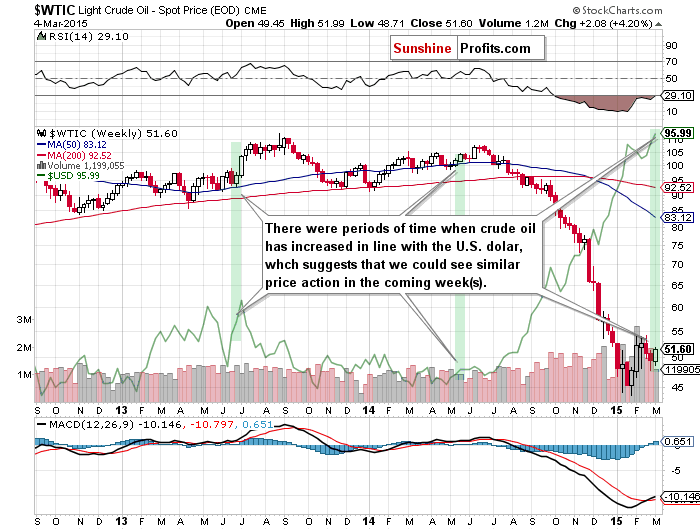
Looking at the medium-term chart, we see that USD Index extended gains and broke above the Jan high of 95.85, hitting a fresh multi-year high of 96.07 (earlier today, the index moved higher once again and climbed to 96.61). As you know from our previous Oil Investment Updates, in the recent months significant rally in the U.S. dollar had a negative impact on the commodity and pushed crude oil to fresh lows. Meanwhile, on the above chart, we see that the commodity didn’t hit a fresh 2015 low. Instead, we saw a 4% increase since the beginning of the week. What does it mean for the commodity? When we take a closer look at the above chart, we see that there were periods of time when crude oil has increased in line with the USD Index (we marked them with green on the chart), which suggests that we could see similar price action in the coming week(s). On the other hand, if the greenback moves lower, it will make crude oil more attractive for buyers holding other currencies, which will translate to higher values of the commodity. At this point some of you may ask: how high could the USD index go? Looking only on the long-term chart, we see that the nearest very important long-term resistance will be around 99.03, where the Sep 2003 high is.
Are there any short-term levels that could stop further improvement? Let’s examine the daily chat and find out.
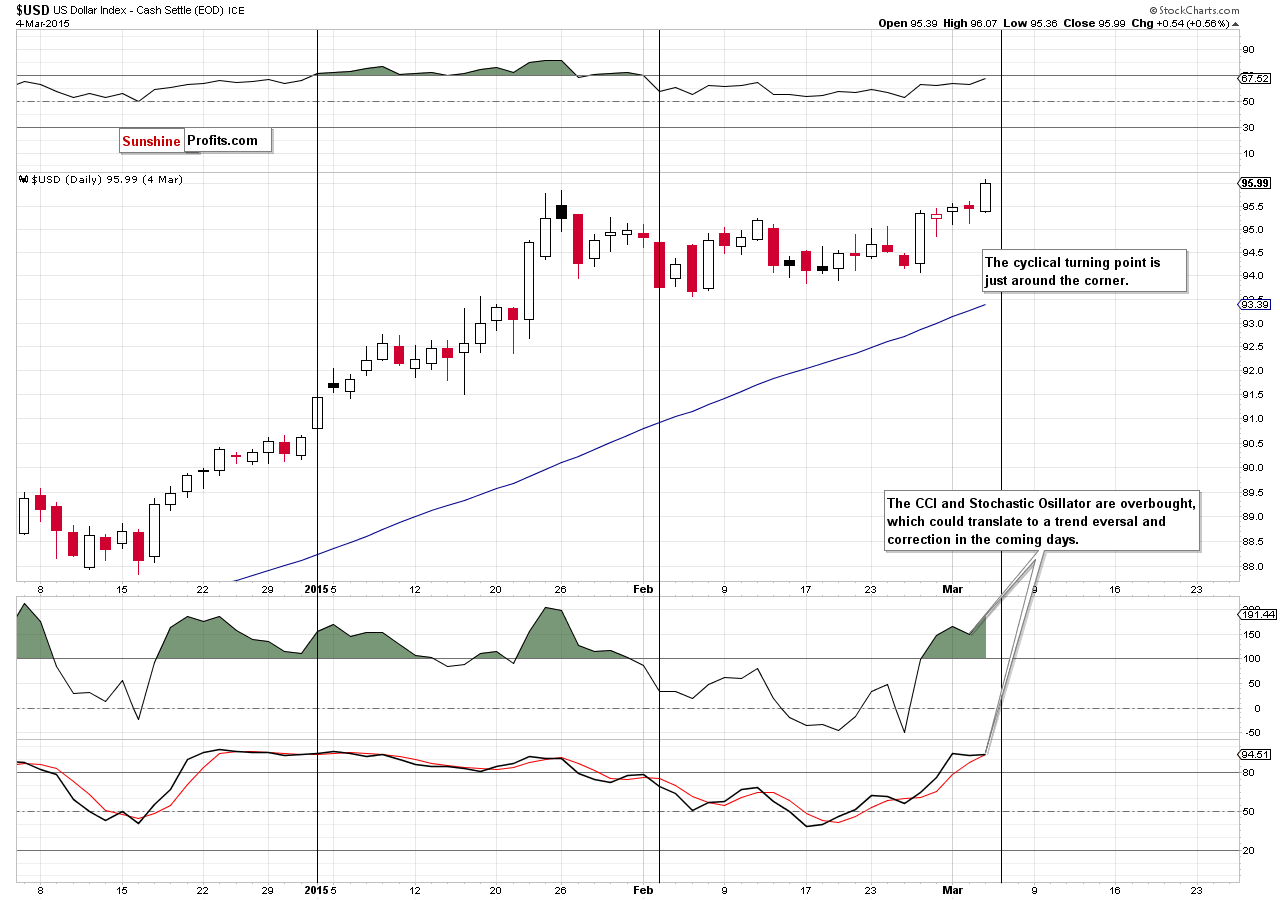
Earlier today the index broke above the 127.2% Fibonacci extension based on the Jan-Feb correction (which will be visible on the above chart after the market’s close), which means that we could see an increase to around 96.86, where the 141.4% extension is. If it is broken, the next upside target would be around 97.08 (150% extension) or 97.37 (161.8% extension). Will we see such improvement? Looking at the current position of the CCI and Stochastic Oscillator we see that they are overbought (there are also negative divergences between them and the index). Additionally, the cyclical turning point is just around the corner, which increases the probability of correction in the coming days.
Scenarios
Just like a month ago, today’s Oil Investment Update includes scenarios of what could happen in the coming weeks. Naturally, we will continue to monitor the market in the coming days and if anything invalidates our long-term outlook we will send you an additional message.
- Bullish scenario
If crude oil breaks above the major resistance zone created by the 76.4% and 78.6% Fibonacci retracement levels (marked on the weekly chart), the Dec lows, the Feb highs and previously-broken 61.8% Fibonacci retracement based on the Dec-Feb decline, we’ll see further improvement and the initial upside target would be around $60. If mid-Dec highs are broken, the next target for oil bulls would be around $68 (the 38, 2% Fibonacci retracement based on the entire Jun-Jan declines) or even around $76 (the 50% Fibonacci retracement). - Bearish scenario
If the commodity extended losses and broke below the support zone created by the Apr 2009 lows (and the lower border of the consolidation marked with blue on the weekly chart), we’ll see a test of the 2015 lows. If they are broken, we could even see a drop to $40, where the next psychologically important barrier is.
Summary
Although the situation in crude oil hasn’t changed much since our previous Oil Investment Update was posted as the commodity is still trading in a narrow range (between the Apr 2009 lows and the resistance zone created by the 76.4% and 78.6% Fibonacci retracement levels), light crude posted its first monthly gain since last June when the price of the commodity began declines. Additionally, crude oil came back to the short-term triangle and climbed above the level of $50, which suggests that if oil bears don’t fail, we might see an attack of the major resistance zone in the coming week(s). On top of that, the current situation in the above-mentioned ratios suggests that further improvement in crude oil is just around the corner. Additionally, the cyclical turning point in the USD Index could trigger a correction in the greenback in the coming days, which will also support the commodity. Nevertheless, in our opinion, this pro-growth scenario will be more likely if we see a daily close above the 61.8% Fibonacci retracement based on the Dec-Jan decline.
Before we take a look at outlooks, it’s worth noting that from the technical point of view crude oil is “ready” for further improvement. Nevertheless, as we have pointed out before, as long as there are no significant signs that a supply glut is getting smaller (for example, by reducing domestic inventories), sizable rally to the levels that we have seen in the autumn is unlikely.
Very short-term outlook: mixed
Short-term outlook: mixed
MT outlook: mixed
LT outlook: bullish
Trading position (our opinion):No positions are justified from the risk/reward perspective at the moment. However, if we see a daily close the 61.8% Fibonacci retracement based on the Dec-Jan decline, we’ll consider opening long positions. Until this time, waiting on the sidelines for the confirmation/invalidation of the above is the best choice. We will keep you informed should anything change.
This completes this month’s Oil Investment Update. Our next Oil Investment Update is scheduled for Thursday, Apr 9, 2015. Oil Trading Alerts subscribers will additionally receive similar but shorter alerts on a daily basis (or more than once a day when the situation requires it). You – Oil Investment Updates subscribers – will receive short Investment Alert messages should the outlook for the medium or long term change before the next Update is posted.
Thank you.
Nadia Simmons
Forex & Oil Trading Strategist
Oil Investment Updates
Oil Trading Alerts

