

- Oil Stocks
- Crude Oil - Oil Stocks Link
- Ratio Analysis
- Non-USD Crude Oil Price
- Crude Oil - U.S.Dollar Link
- Scenarios
- Summary
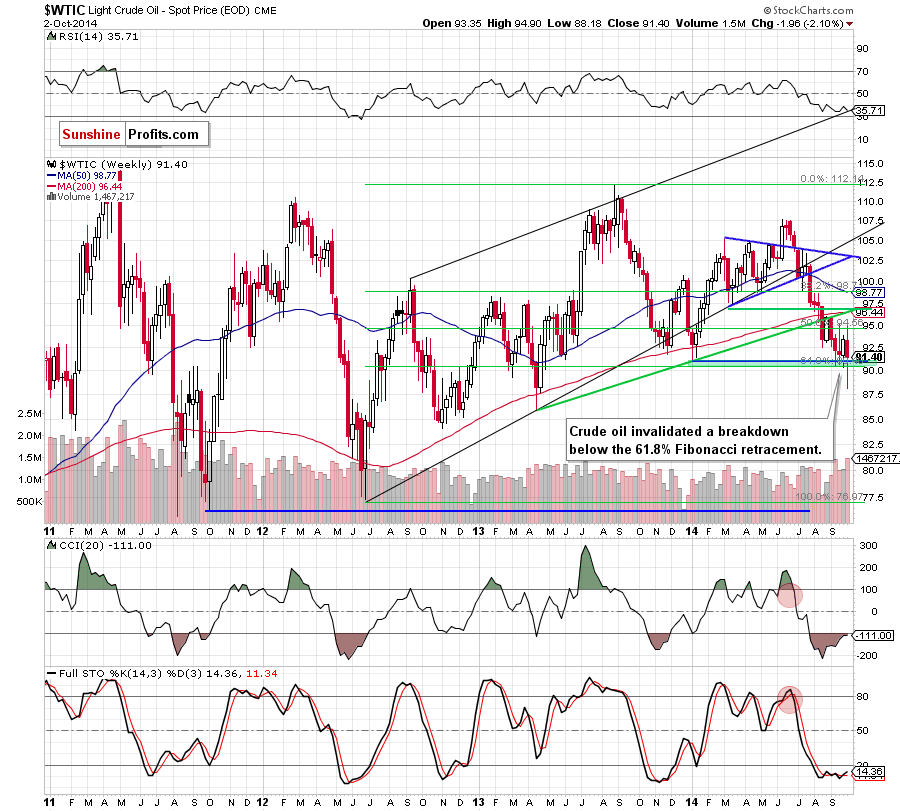
The third quarter of the year is behind us. During the last three months, crude oil declined from the 2014 high of $107.68 to its lowest level since Apr 23, 2013. The commodity lost almost $20 in that period of time, but the previous month was not the worst for currency bulls. In September, light crude dropped by less than $5 and managed to hold above its low of $90.43 for almost three weeks, despite surging dollar. Yesterday, the situation has deteriorated significantly as crude oil declined sharply, hitting a fresh multi-month low of $88.18. As it turned out in the following hours, this deteriration was only very temporarily as the commodity almost immediately invalidated the breakdown not only below the recent lows, but also under the key support zone created by the long- term support line and the 61.8% Fibonacci retracement level. At this point, some of you are probably wondering what does it mean for crude oil and where the commodity head next.
Before we try to answer this question, jumping into the world of charts, we would like to focus on one of the major driving forces behind the recent moves in crude oil. In the previous months, the key driver was the conflict between Ukraine and Russia, which warmed to red worries over disruptions of Russian oil exports. Meanwile, at the begining of September, Ukraine signed a ceasefire deal with pro-Russia rebels, which was bearish for the commodity and eased fears over the instability in the eastern Ukraine and disruption of oil exports from the region. Since then, the price of light crude was extending losses as the combination of dissapointing the EIA weekly reports, weak Chinese data (which underlined concerns over the health of the world's second largest economy) and a stronger U.S. dollar (supported by expectations that U.S. interest rates would be rise sooner rather than later) weighed on the price. An additional blow that watered down the commodity, pushing it to the Sep low of $90.43 was a cut of the International Energy Agency forecast for global oil demand. Although crude oil rebounded in the following days after news that the OPEC could cut its production target for next year (from 30 million barrels a day to 29.5 million barrels a day) at its meeting in November, the Fed’s decision to cut monthly bond purchases by $10 billion, advanced the central bank's plans to close its quantitative easing program at its Oct. 28-29 meeting. In response, the U.S. dollar rallied against other currencies, making the commodity more expensive to foreign buyers. Additionally, ongoing concerns over signs of an abundance of light crude resulted in a test of the strength of the Sep low. At that time, however, we noticed a very interesting relation between the USD Index and the price, which we‘ll discuss later. Finishing this fundamental part of our Oil Investment Update, we would like to draw your attention to the fact that although the U.S. Energy Information Administration showed in its two previous reports that domestic oil supplies plunged, the commodity dropped to its lowest level since Apr 23, 2013 yesterday. The reason? Firstly, the OPEC’s crude oil supplies increased to its highest level in nearly two years as Saudi Arabia and Libya have increased production by 810,000 barrels per day. Although a number of analysts and market participants had expected Saudi Arabia to cut back on production and push prices higher, the country lowered its official selling prices (by $1 a barrel compared with the prior month for Arab Light crude being sold in Asia) on the following day, indicating that it expects crude to continue trading at low levels. Will the market players be more likely to buy crude oil around $90 per barrel and we see a rebound from here? Before we know the answer to this question, let‘s examine the technical picture of crude oil and find out what can infer from charts (charts courtesy by http://stockcharts.com).
Crude Oil
Let’s start this month‘s Oil Investment Update’s technical part with a closer look at the monthly chart of light crude.
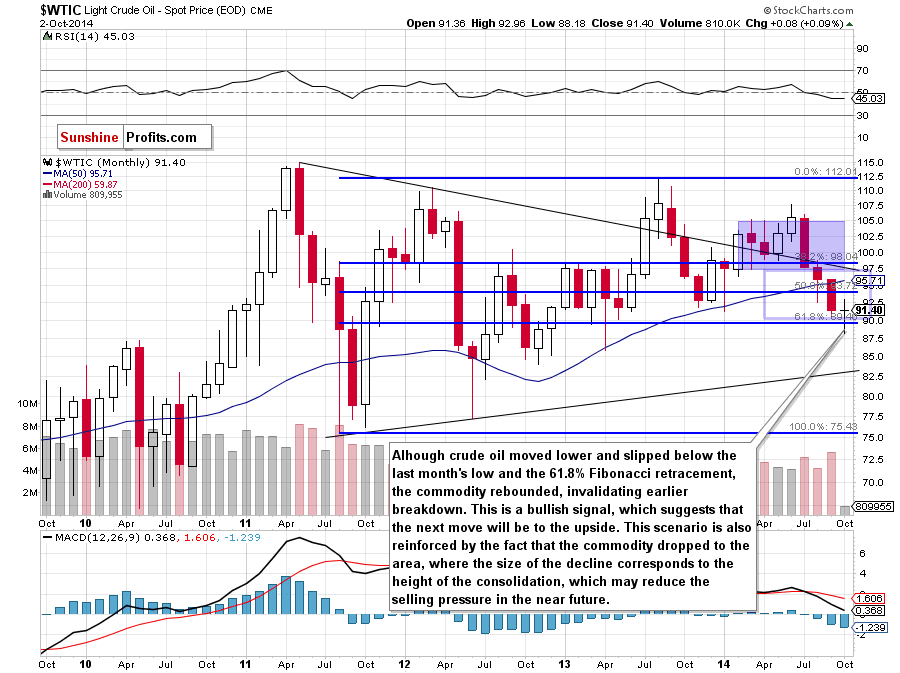
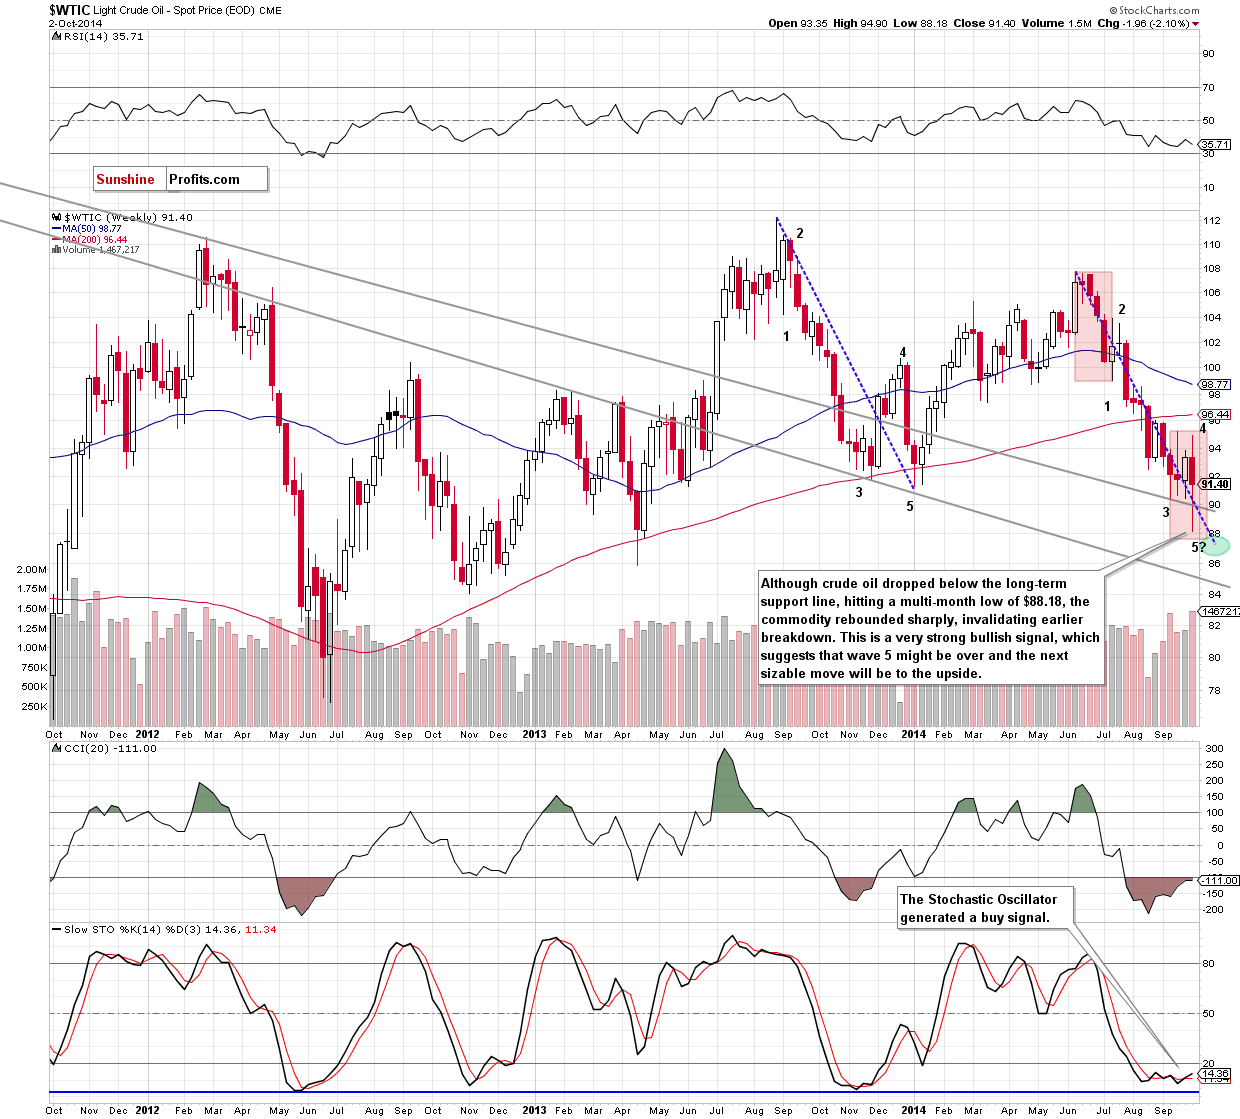
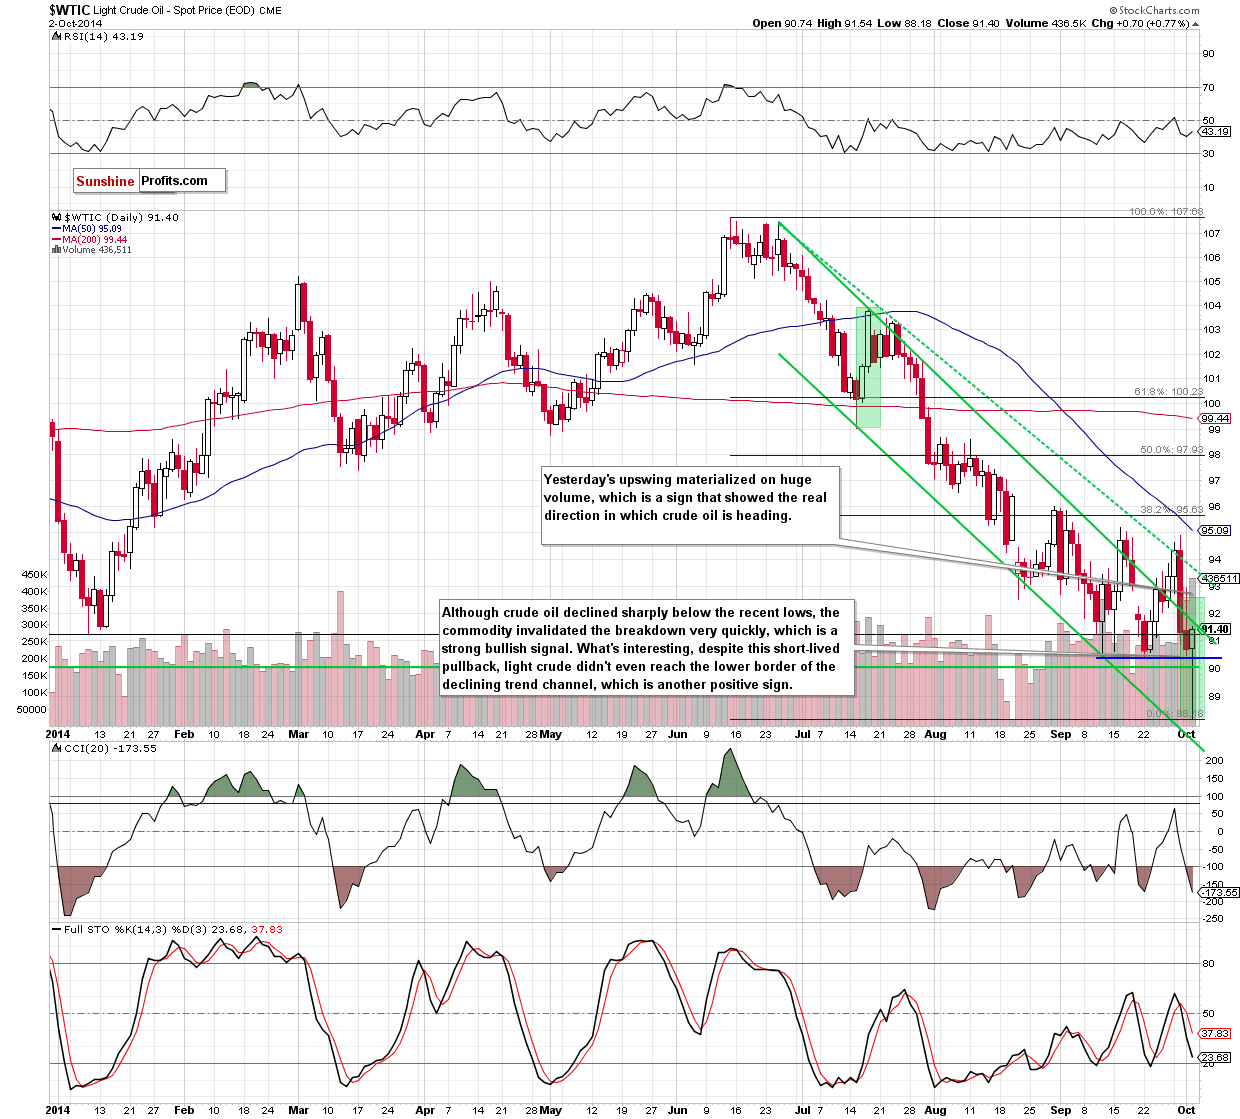
Without a doubt, the first thing that catches the eye on the above charts is an invalidation of the breakdown below the Sep low, the long-term declining support line, the 61.8% Fibonacci retracement level and even the Jan low. Are there any other encouraging signals? The answer is: yes! Firstly, the weekly Stochastic Oscillator generated a buy signal. Although the indicator still remains below the key level of 20, we think that we’ll see further increases – similarly to the situation in Nov 2013. Secondly, there is a positive divergence between the weekly RSI and the price (small, but still). Thirdly, a potential wave 5 is shorter than wave 1 (visible more clearly on the third chart). Fourth, although crude oil declined to a fresh multi-month low of $88.18, the commodity didn’t even reach the lower border of the declining trend channel. The last but not least important bullish factor is the size of the volume that accompanied yesterday’s move. It was huge (the highest since Oct 2012), which signifies to us the real direction in which the commodity is heading. All the above provides us with bullish implications, suggesting that a trend reversal is just around the corner.
Summing up, without a doubt, the highlight of yesterday’s session day was a very quick invalidation of the breakdown below the recent lows and the key medium-term support zone. As is well known, an invalidation of the breakdown is a strong bullish signal, which usually precedes further rally. Taking this fact into account and combining it with the above-mentioned bullish signs, we think that the final bottom in crude oil might be in and the next sizable move will be to the upside.
Having discussed the situation in crude oil, let’s examine the NYSE Arca Oil Index (XOI) to find out what the current outlook for oil stocks is.
Oil Stocks
Let’s begin with the long-term chart.
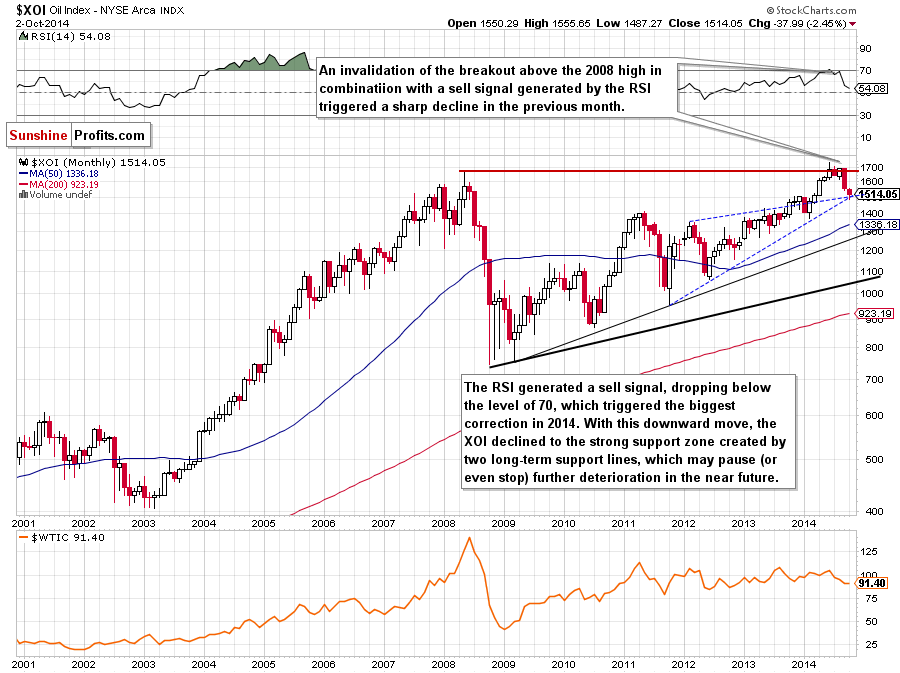
The situation in the long term has deteriorated as the XOI declined below the Jun low, which was also the lower border of the consolidation. This drop triggered further deterioration and the deepest correction since Jun 2012. With this downward move, the oil stock index reached a very strong support area (created by two long-term support lines), which suggests that we could see a rebound from here. However, to have more certainty about future moves, let’s zoom in our picture and examine the weekly chart.
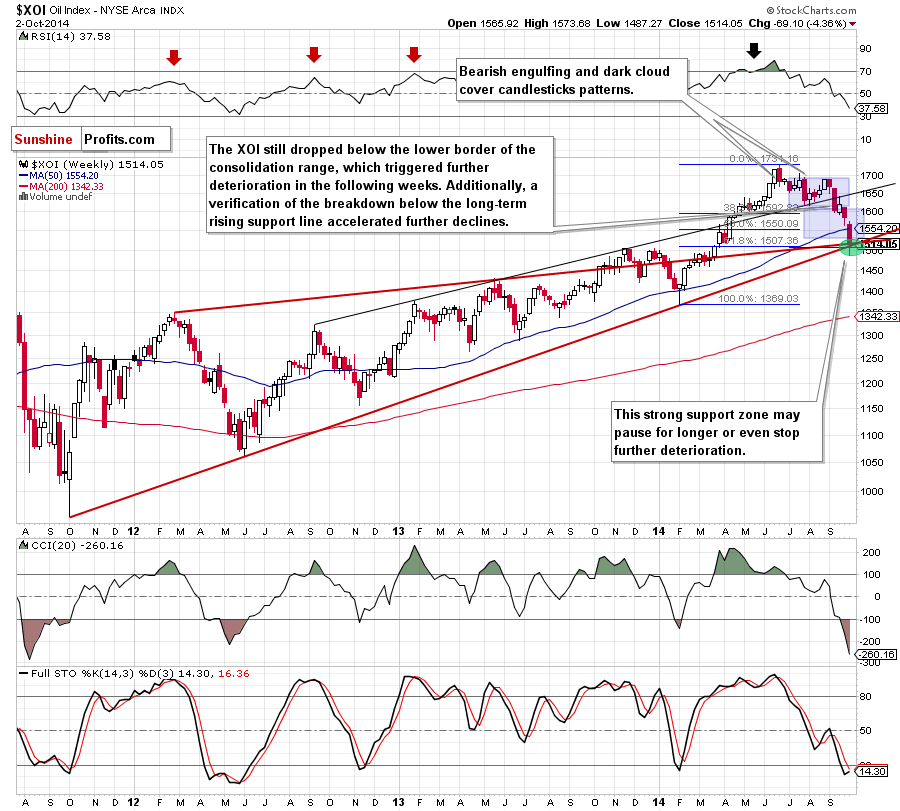
From this perspective, we see that the above-mentioned support area is also reinforced by the 61.8% Fibonacci retracement level. Therefore, an invalidation of the breakdown below these levels is a strong bullish signal that suggests that a bigger upward move is just around the corner. Before we move on to the daily chart, please note that in this area the size of the downward move corresponds to the height of the consolidation, which may reduce the selling pressure and trigger further improvement.
Will we find more clues on the daily chart? Let’s check.
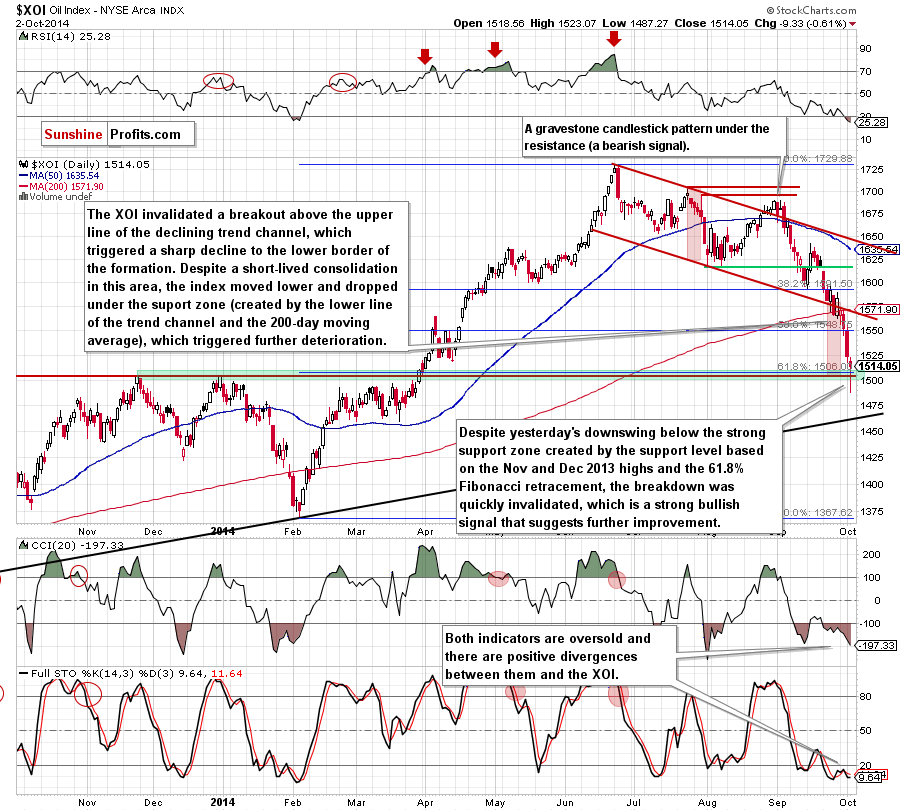
The first thing that catches the eye on the above chart, is an invalidation of the breakdown below the green support zone. Secondly, yesterday’s price action translated to a bullish hammer candlestick pattern, which suggests a reversal. Thirdly, the RSI dropped to its lowest level since the beginning of Feb. Back then, such low reading of the indicator in combination with positive divergences between the CCI and the index preceded a sizable upward move. As you see, currently we have similar situation. On top of that, in this area, the size of the downward move corresponds to the height of the declining trend channel, which may also reduce the selling pressure. Connecting the dots, we think that the next sizable move will be to the upside. If this is the case, we’ll see a rebound from here in the nearest future and an increase to at least the previously-broken lower border of the declining trend channel (currently at 1570).
Before we summarize the current situation in the oil stocks index, we would like to draw your attention to the chart below.
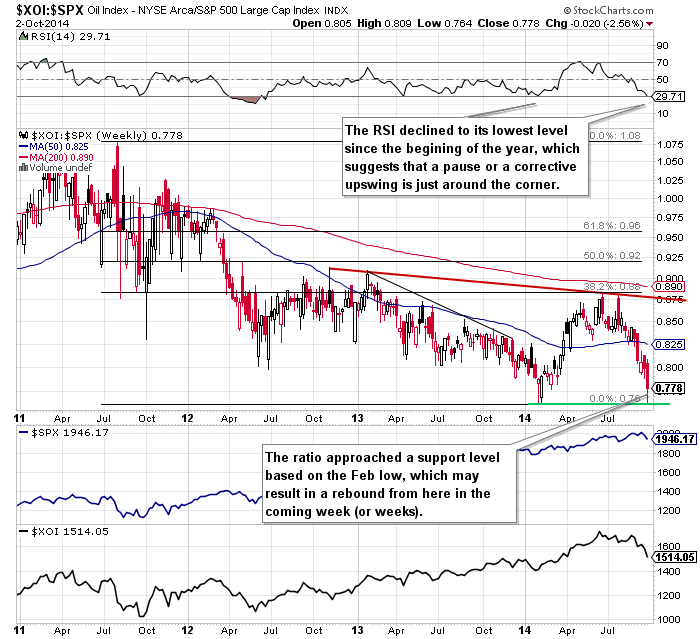
Looking at the above chart, we see that the oil stocks-to-stocks ratio declined to the previous 2014 low. Taking this fact into account and combining it with the current position of the RSI and the overall picture of the XOI, we think that we may see a post-double-bottom rally from here.
Summing up, the most important event of yesterday’s session was an invalidation of the breakdown below the very important support levels. As we have pointed out before, this is a strong bullish signal, which suggests that the next bigger move will be to the upside. This assumption is currently reinforced by a realization of two bearish scenarios (after the breakdown below the lower line of the consolidation and the lower border of the declining trend channel) and the double bottom formation seen on the oil stocks-to-stocks ratio. If this is the case, and oil stocks move higher, the initial upside target will be the previously-broken lower border of the declining trend channel (currently at 1570).
Crude Oil - Oil Stocks Link
Having discussed the current situation in crude oil and the oil stock index, let’s comment on the relationship between them.
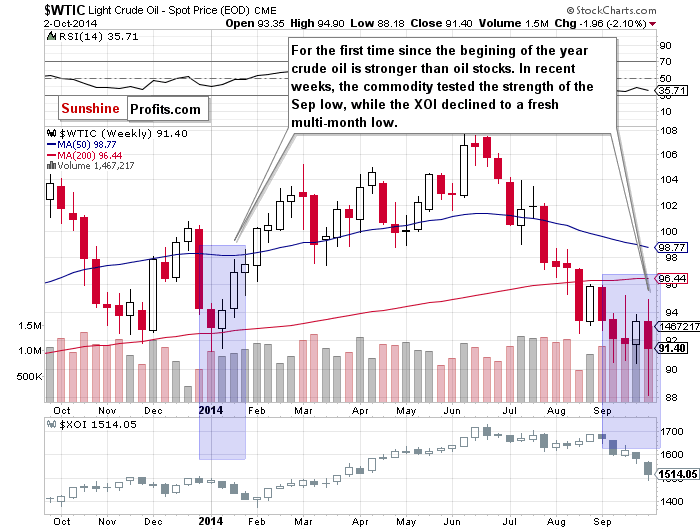
When we take a look at the weekly chart and compare the price action in both cases, we see that for the first time since the beginning of the year crude oil was stronger than oil stocks in the previous week. The commodity tested the strength of the Sep low once again, while the XOI declined to a fresh multi-month low. This week, a positive correlation between the WTIC and the XOI came back as they both extended losses and dropped below the recent lows. If this relation remains in place in the coming weeks, we could see further improvement in oil stock and also in crude oil. Are there any other factors that support the bullish case? Let’s examine three interesting ratios and find out.
Ratio Analysis
Today, we start this section by focusing on the oil-to-stocks ratio. What can we infer from this chart?
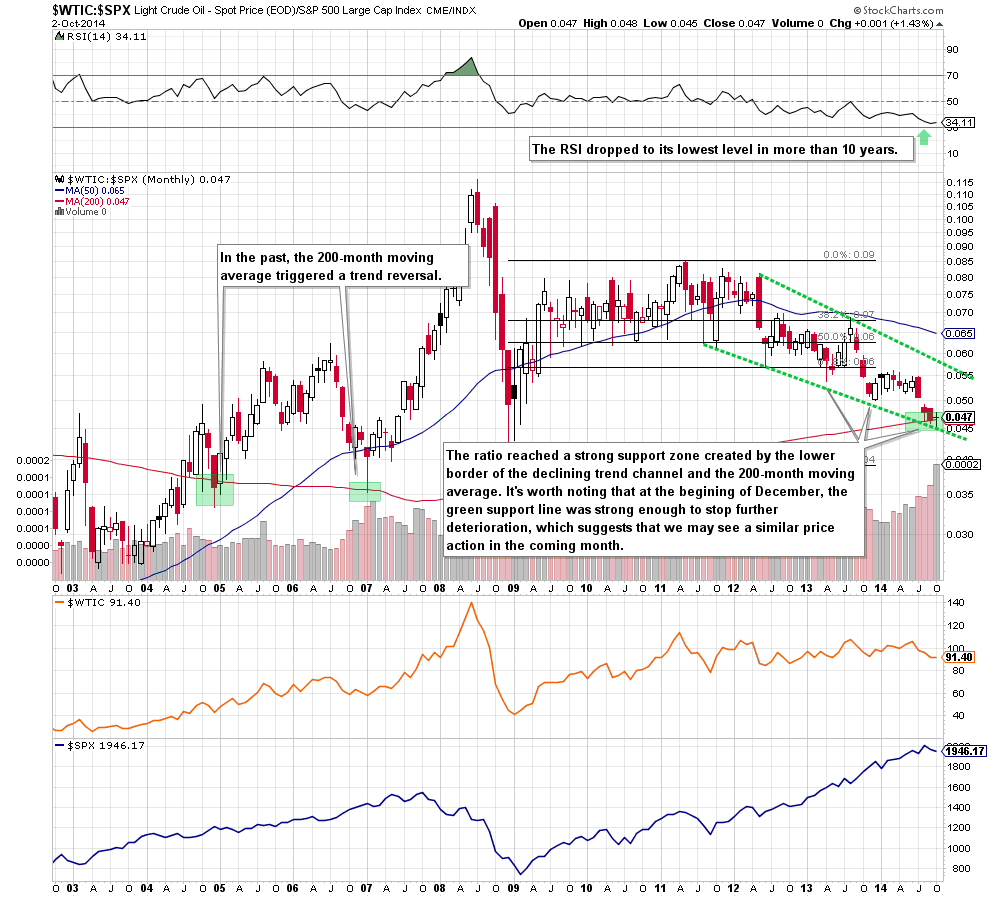
Looking at the monthly chart, we see that the situation in the long term hasn’t changed much. Although the ratio dropped a little lower, reaching the lower border of the declining trend channel (which still serves as the major support), we saw a rebound, which invalidated earlier breakdown below the 200-month moving average. Therefore, we believe that what we wrote in our previous Oil Investment Update is still up-to-date:
(...) this important moving average triggered a trend reversal at the begining of 2005 and also in 2007. On top of that, the proximity to the green support line encouraged oil bulls to act in April 2013 and also at the end of the last year. Taking these facts into account and combining with the current position of the RSI (which dropped to its lowest level in more than 10 years), it seems to us that this area will be strong enough to stop further deterioration in the ratio, which should bring a rebound in crude oil.
Having said that, let’s zoom in our picture and take a closer look at the weekly chart.
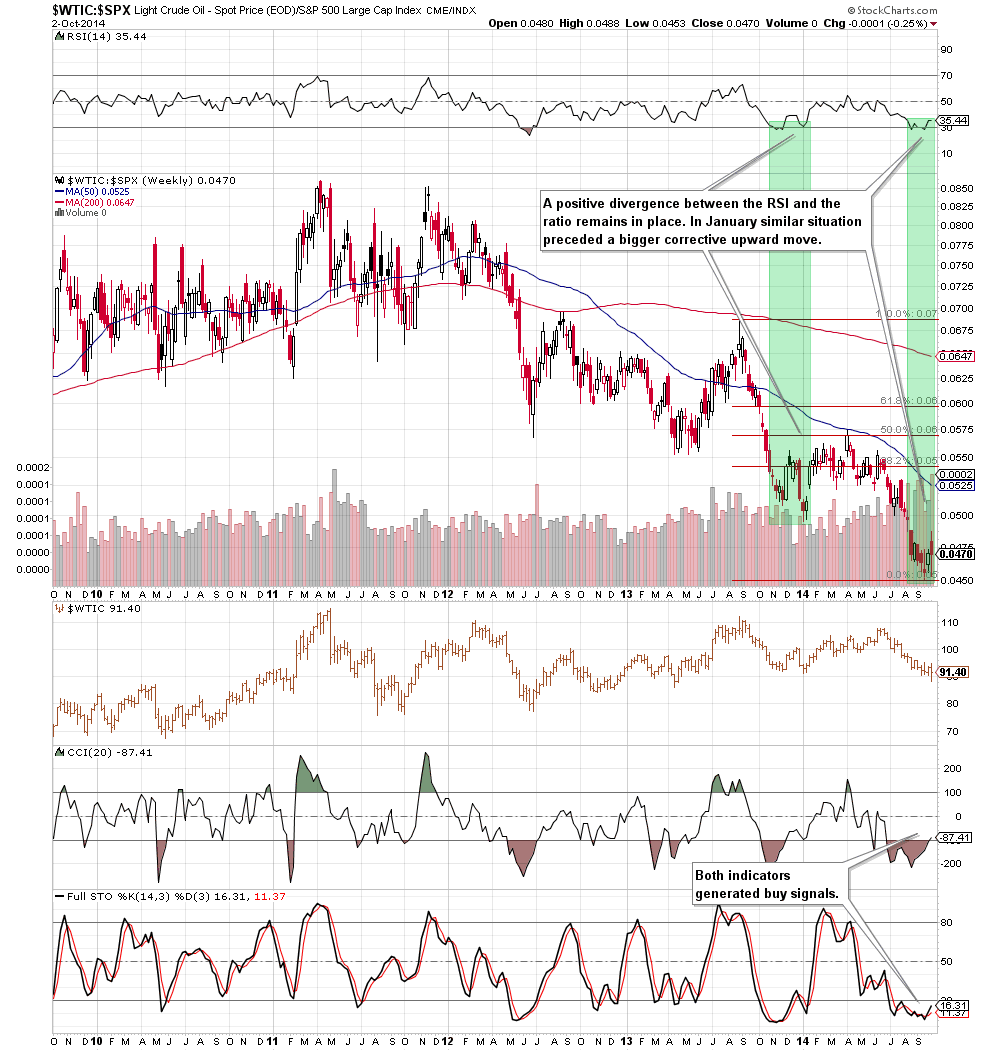
From this perspective, we see that a positive divergence between the RSI and the ratio remains in place. Additionally, the indicator and the CCI and Stochastic Oscillator generated buy signals, supporting the bullish case. On top of that, although crude oil hit a fresh multi-month low yesterday, we didn’t notice such price action in the ratio, which crates a positive divergence between them and is an additional encouraging factor. All the above provide us with bullish implications and suggests that a rebound in the ratio and also in crude oil is just around the corner.
Non-USD Crude Oil Price
Once we know the situation in the above ratios, let’s move on to the non-USD (WTIC:UDN ratio) chart of crude oil. As a reminder, UDN is the symbol for the PowerShares DB US Dollar Index Bearish Fund, which moves in the exact opposite direction to the USD Index. Since the USD Index is a weighted average of the dollar's exchange rates with world's most important currencies, the WTIC:UDN ratio displays the value of crude oil priced in "other currencies".
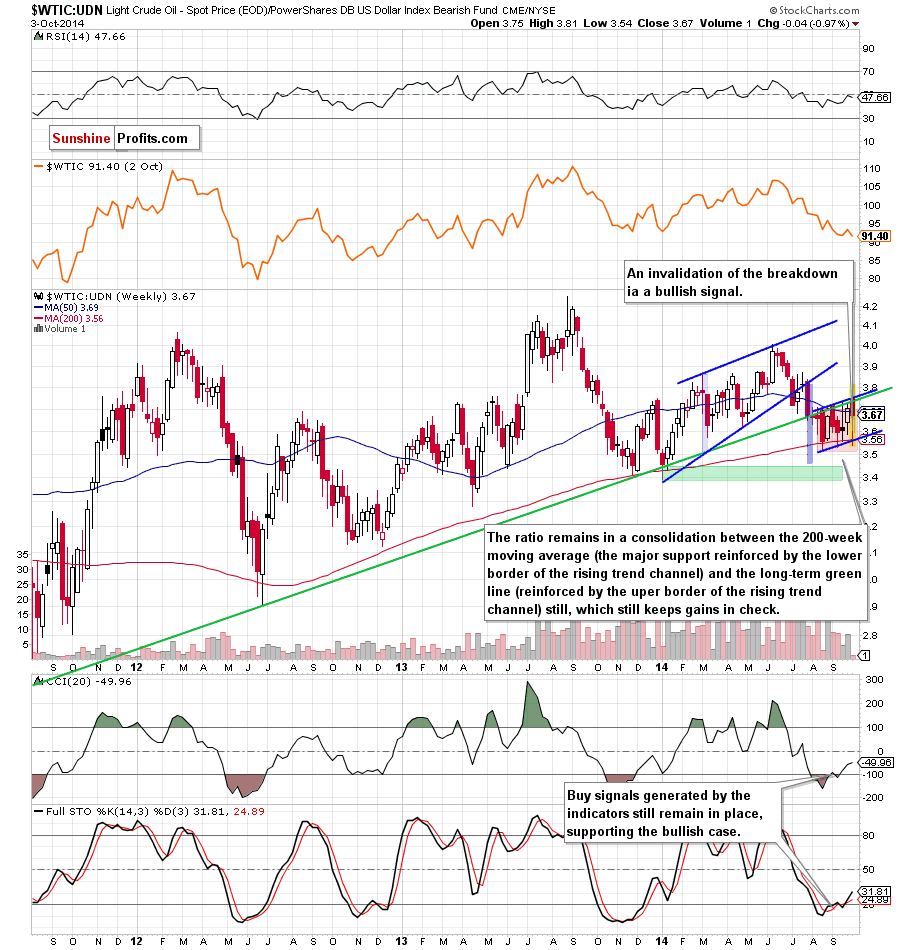
Looking at the above chart, we see that despite yesterday’s drop below the lower border of the consolidation and the lower line of the rising trend channel, crude oil rebounded sharply, invalidating the breakdown. Nevertheless, in our opinion, the most important was an invalidation of the breakdown below the 200-week moving average. Why? As you see on the weekly chart, we saw similar price action in Jun 2012, Nov and Dec 2013 and also in Aug and Sep 2014. In all this cases, an invalidation triggered further improvement in the following weeks. Therefore, we think that we’ll see similar price action in the coming weeks – especially when we factor in the current position of the indicators (the CCI and Stochastic Oscillator generated buy signal, supporting the bullish case).
Crude Oil – U.S. Dollar Link
Finishing today’s Oil Investment Update, we decided to comment the relation between crude oil and the U.S. dollar as it was one of the major forces, whcih affected the price of the commodity in recent weeks.
Let’s start with the chart, which ilustrates this link.
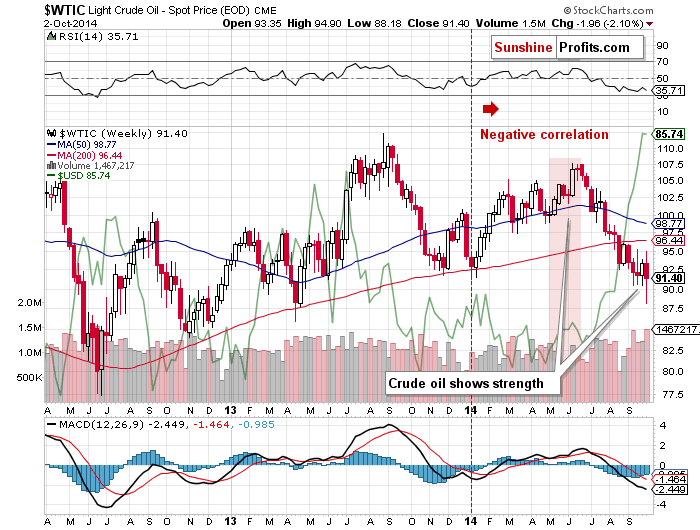
As you see on the above chart, since the beginning of this year crude oil has been negatively correlated with the USD Index. When the USD Index rallied, the crude oil price has generally declined, and while the USD Index declined, then we have generally seen upswings in the price of crude oil.
However, there has been an exception. In May and in the first part of June crude oil managed to rally even though the USD Index hasn’t declined. In other words, crude oil showed strength. Please note that USD Index’s bottoming process that we’ve seen from March to May meant a horizontal – yet slightly rising – trend in the crude oil. On average, crude oil “wanted” to move higher. We saw the same type of reaction in the previous month. The USD Index continued to climb, but the price of crude oil refused to move even lower until yesterday. Although, we noticed a one-day deterioration, which resulted in a fresh multi-month low, the commodity invalidated the breakdown almost immediately.
All the above is a very important observation, which suggests that even if the USD Index moves higher, crude oil will likely show strength – similarly to what we saw in Sep. On the other hand, if the USD Index finally corrects, it could ignite a bigger move up in crude oil.
Will we see such price action in the nearest future? To have a more complete picture of the situation, we decided to take a closer look at the ratio between crude oil and the USD Index. Why did we decide to attach this chart? Although it doesn’t have a particular economic meaning, we think that the technical picture, which emerges from it can be a valuable clue about future moves.
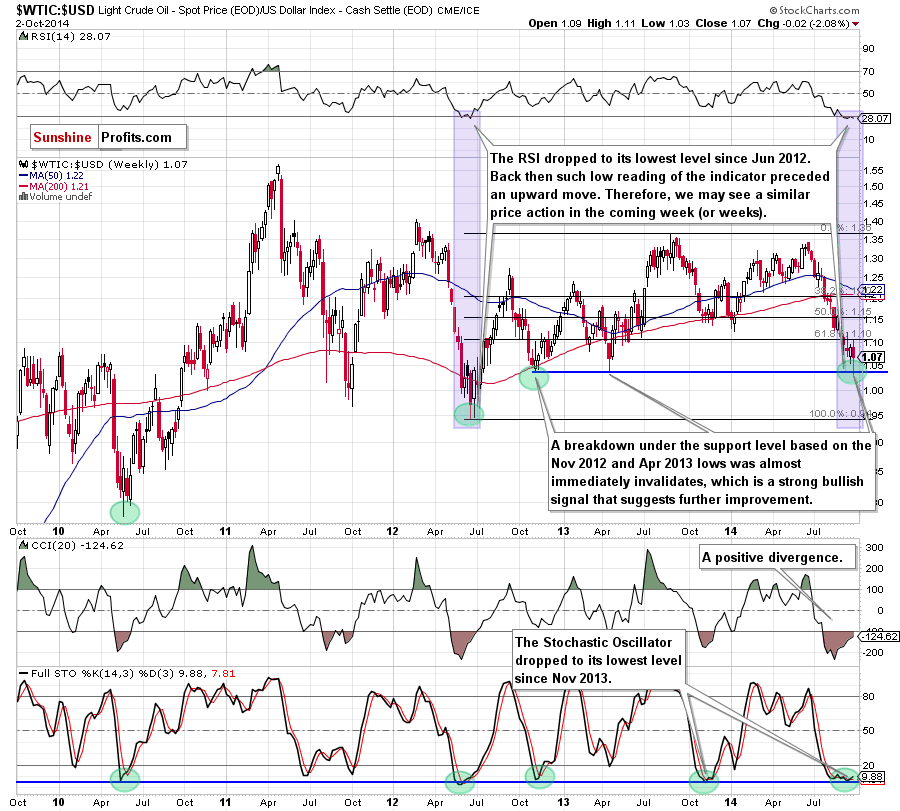
On the above chart, we see that the ratio reached a strong support level based on the Nov 2012 and Apr 2013 lows. Although there was a breakdown (barely visible from this perspective) below this horizontal line, it was almost immediately invalidated. Additionally, the RSI dropped to its lowest level since Jun 2012. Back then, such a low reading of the indicator preceded a sizable upward move. On top of that, the Stochastic Oscillator generated a buy signal after a drop to one of its lowest level in five years. Please note that we saw similar situation in May 2010, Jun and Nov 2012 and also in Nov 2013. In all these cases, such low reading of the indicator in combination of a buy signal triggered further a rally. Taking all the above into account, we think that the ratio will rebound from here in the coming week (or weeks), which will translate to the higher value of crude oil.
Scenarios
Just like a month ago, today’s Oil Investment Update includes scenarios of what could happen in the coming weeks. Naturally, we will continue to monitor the market in the coming days and if anything invalidates our long-term outlook we will send you an additional message.
- Bullish scenario
If crude oil bounces off the support zone (created by the long-term, declining support line, the 61.8% Fibonacci retracement and Jan low), we’ll see a bigger corrective upswing from here and a breakout above the upper line of the declining trend channel marked on the daily chart. In this case, the initial upside target will be around $96, where the Sep highs meet the 38.2% Fibonacci retracement based on the entire Jun-Oct decline. If this area is broken, the next targets for oil bulls would be around: $98 (the 50% Fibonacci retracement), $100 (where the psychological barrier and the 200-day moving average are), $104 (the Jul 8 and Jul 17 highs) and $107 (where the Jun highs are). Please note that the key resistance, which could stop or accelerate further improvement, will be the resistance zone marked on the weekly chart, where the long-term green resistance line, the 200-week moving average and the Mar low are. - Bearish scenario
If the commodity extends losses and confirms the breakdown below the support zone (created by the long-term, declining support line, the 61.8% Fibonacci retracement and Jan low), we will see a drop to at least $86.60 (marked with green on the first weekly chart), where the current downward move (from Jun until now) will be equal to the decline that we saw in the previous year and where a potential wave 5 will correspond to wave 1. If this area is broken, the next target for currency bears would be around $85.90-$86, where the Apr2013 low is.
Summary
Although the overall situation in crude oil has deteriorated as the commodity declined below the long-term green support line and the 61.8% Fibonacci retracement yesterday, the breakdown below these levels was almost immediately invalidated, which is a strong bullish signal. As we have pointed out before, we also saw a similar invalidation in case of crude oil priced in "other currencies". On top of that, the current situation in the USD Index, the oil-to-usd and stocks-to-oil ratios also supports oil bulls as a trend reversal in all three cases is just around the corner. The last, but not least important factor, which suggests that the next bigger move will be to the upside is the overall situation in the XOI. The reason? A comeback of a positive correlation between crude oil and oil stocks. Similarly to what we wrote in case of light crude, an invalidationof the breakdown below such important support zone (marked on the long-, medium and short-term charts) is a very bullish signal. Therefore, if this positive relation remains in place, we believe that both WTIC and the XOI will move higher in the coming weeks.
Very short-term outlook: bullish
Short-term outlook: mixed with bullish bias
MT outlook: mixed
LT outlook: bullish
Trading position (our opinion): If one wants to hold their long position for months, it doesn't seem that the current move lower needs to be really concerning. In other cases, it seems to us that long positions with a stop-loss order at $86.27 are justified from the risk/reward perspective. Initial price target: $96.
This completes this month’s Oil Investment Update. Our next Oil Investment Update is scheduled for Thursday, November 6, 2014. Oil Trading Alerts subscribers will additionally receive similar but shorter alerts on a daily basis (or more than once a day when the situation requires it). You – Oil Investment Updates subscribers – will receive short Investment Alert messages should the outlook for the medium or long term change before the next Update is posted.
Thank you.
Nadia Simmons
Forex & Oil Trading Strategist
Oil Investment Updates
Oil Trading Alerts

