

From today’s point of view, we see that the situation in crude oil has deteriorated since our last Oil Investment Update was published. Although WTIC didn’t lose in August as much as in July (the commodity dropped by 1.85%), we saw a correction that took light crude to a fresh multi-month low of $92.50. With this downward move, crude oil declined below the long- term support line and the 200-week moving average, approaching the 2014 low of $91.24. This is the point where you’re probably wondering whether this support will withstand the selling pressure or not.
Before we jump into the world of charts, we would like to focus on one of the major driving forces behind the recent moves in crude oil. The conflict between Ukraine and Russia has, without a doubt, fueled East-West tensions to the highest levels since the Cold War. As you know from our previous Oil Investment Updates (and also from Oil Trading Alerts), rising tensions between these countries were supportive for crude oil because of the fears that the instability in the eastern Ukraine will escalate and disrupt Russian oil exports (as a reminder, Russia is the world's second-largest exporter). In the previous week, worries that the clash could escalate further, grew after Kiev accused Russia of invading the country as more than 1,000 Russian troops were fighting alongside pro-Russian separatists in eastern Ukraine. In this environment, European Union leaders threatened over the weekend to impose a new round of sanctions on Russia if Moscow does not scale back its involvement in the conflict in eastern Ukraine. As a result, yesterday, Russian President Vladimir Putin said he and his Ukrainian counterpart had agreed to take steps to establish a "permanent ceasefire" in eastern Ukraine, calling for the separatists there to end their offensive against Ukrainian forces around the rebel strongholds of Donetsk and Luhansk, while Kiev would pull its forces back. Additionally, Ukrainian President Petro Poroshenko said he hoped that talks with separatists set for Friday will lead to the start of a peace process.
Although escalating tensions between Ukraine and Russia had a positive impact on the price of crude oil in the recent months, this time we had a completely different market participants’ reaction. For the first time since the beginning of the conflict news of reduced geopolitical tension pushed the commodity higher on hopes that waning military conflicts in Ukraine could boost economic growth in Europe and lessen the chances of the crisis slowing global recovery. Does this mean that investor sentiment will improve and we see further rally? Before we know the answer to this question, let‘s examine the technical picture of crude oil and find out what can infer also from other charts (charts courtesy by http://stockcharts.com).
Crude Oil
Let’s start this month‘s Oil Investment Update’s technical part with a closer look at the monthly chart of light crude.
In our previous Oil Investment Update, we wrote the following:
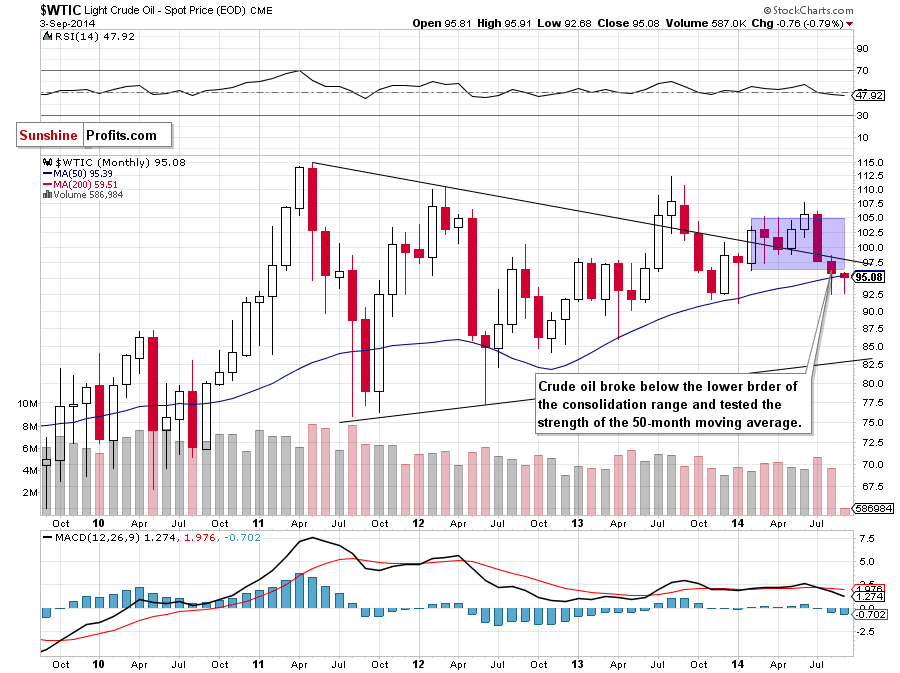
(…) the commodity declined under the long-term declining support line. With this downward move light crude also slipped below the lower border of the consolidation created by the March low. So far, this breakdown is barely visible from this perspective, but such drop may trigger further deterioration – especially if oil bulls do not invalidate the breakdown below the long-term support/resistance line. If this is the case, crude oil will test the strength of the 50-month moving average (currently at $95.10). As you see on the above chart, several times in the past (for example in Apr 2013 or Jan 2014) this moving average stopped further declines, therefore, if history repeats itself, we may see similar price action in the coming month (or months).
Looking at the monthly chart, we see that the situation developed in line with the above-mentioned scenario and crude oil slipped to our downside target in the previous month. Although the commodity rebounded, we saw another test of the strength of the 50-month moving average earlier this month. As we mentioned above, several times in the past this moving average stopped further declines, which suggests that we may see similar price action in the coming month.
Will the medium-term picture give us more clues where the commodity head next? Let’s zoom in on our picture and find out.
Quoting our last Oil Investment Update:
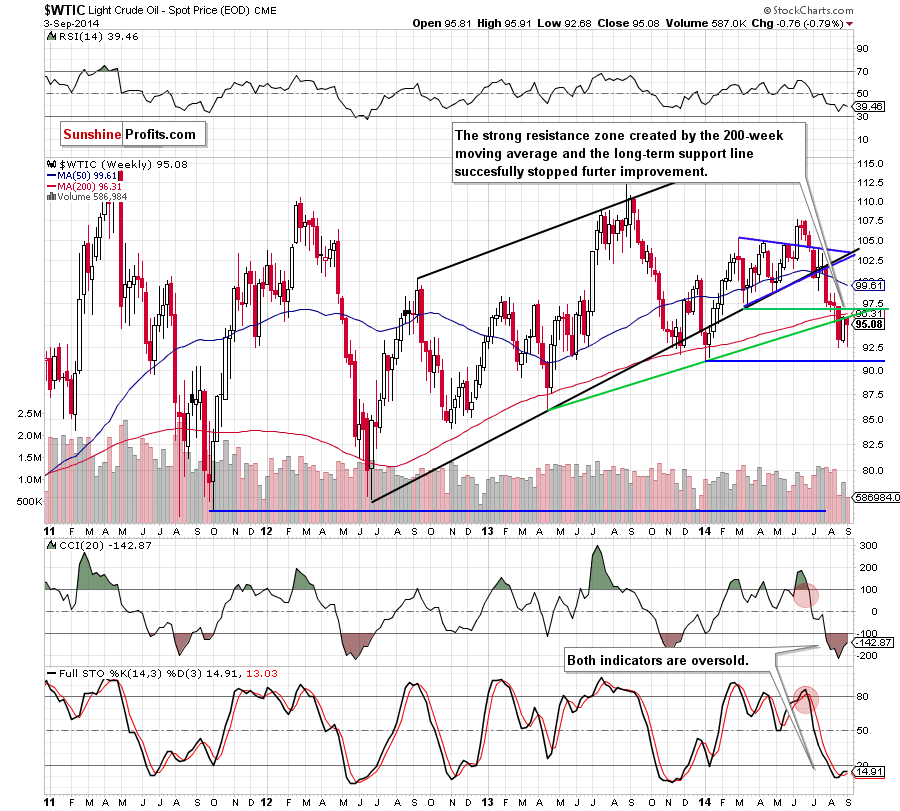
(…) we should keep in mind that sell signals remain in place (despite the fact that the CCI and Stochastic Oscillator are oversold), which suggests that (…) the commodity will likely test the strength of the 200-week moving average (currently at $96.06) – similarly to what we saw several times in the past (for example in April, November 2013 and also at the beginning of the year).
From today’s point of view, we see that currency bears not only realized the above-mentioned scenario (as we had expected), but also managed to push the price below the long-term green support line. With this downward move, the commodity approached the 2014 low. Although light crude rebounded in the previous week, the strong resistance zone created by the previously-broken 200-week moving average and the rising, long-term support line, successfully stopped further improvement and the commodity reversed, declining sharply to around the recent low. Yesterday, crude oil moved higher, but as long as it remains below these levels, we see this upswing as nothing more than a verification of the breakdown. If this is the case, we’ll see a test of the strength of the Jan low of $91.24. At this point, it’s worth noting that although the CCI and Stochastic Oscillator are oversold, they didn’t generate buy signals, which would support oil bulls at the moment.
Now, let’s check the short-term outlook.
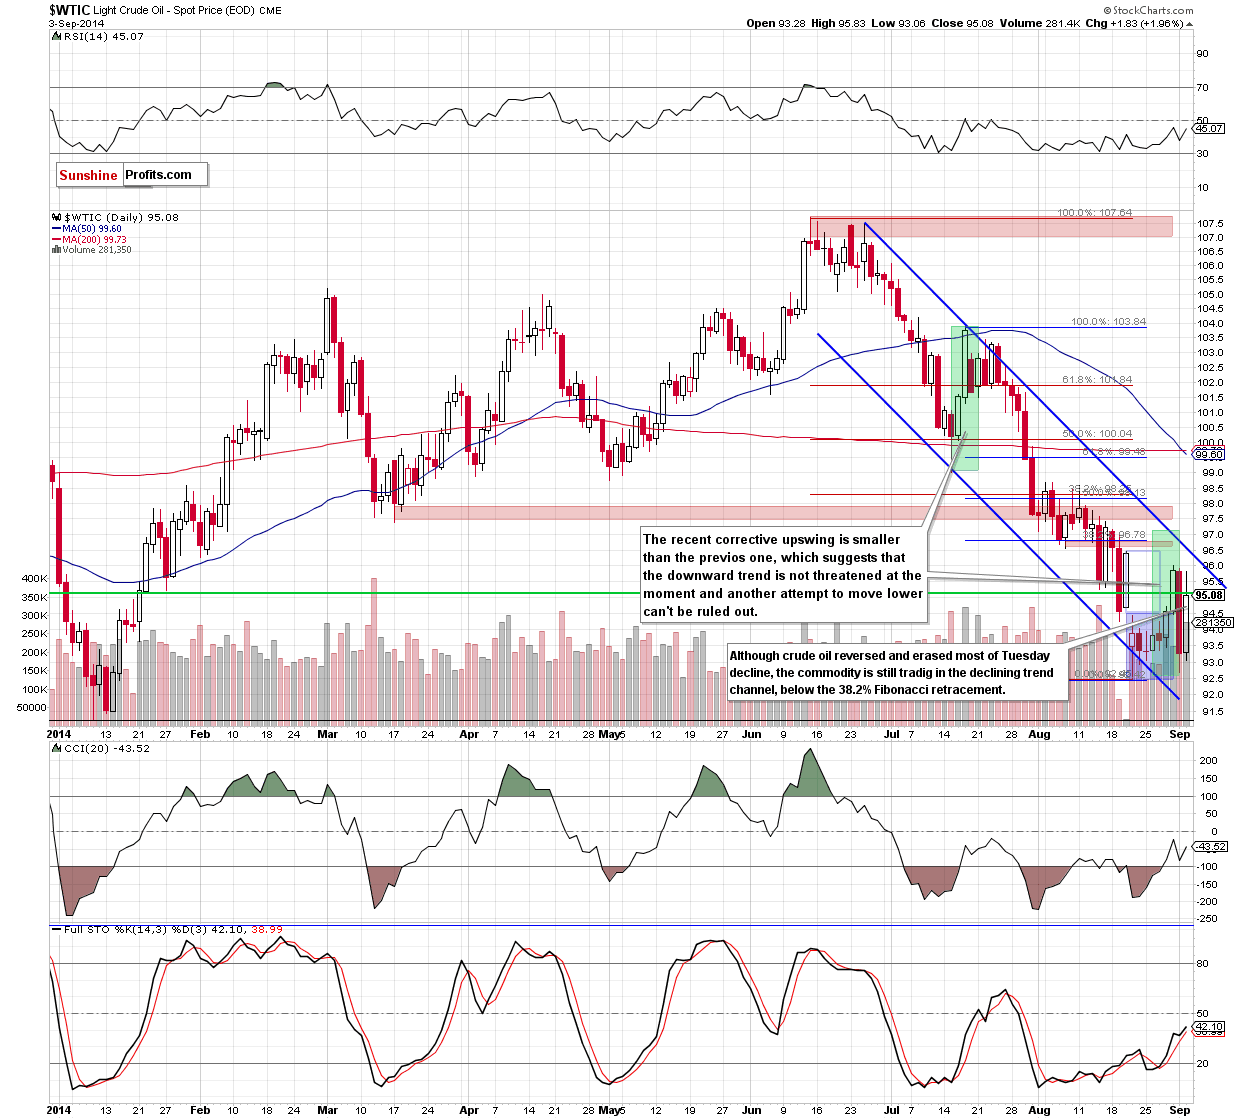
Looking at the daily chart, we see that the situation has deteriorated significantly as crude oil declined (and confirmed the breakdown) not only below the March low, but also under the strong support zone created by the 76.4% and 78.6% Fibonacci retracements based on the entire 2014 rally and the Jan. 27 bottom. With this downward move, the commodity approached the Jan low of $91.24. Earlier this week, light crude climbed above the upper line of the consolidation (marked with blue), hitting an intraday high of $96, but the medium-term resistance zone triggered a pullback in the following day and the commodity came back to around the recent lows.
Yesterday, crude oil rebounded sharply and erased most of Tuesday decline, but is this something more than a one-day rally? Looking at the daily chart, we clearly see that there were similar moves in the recent weeks. In all previous cases they didn’t precede further improvement, instead we saw continuation of the decline. Therefore, we think that we may see a pullback from here in the coming day (or days) – especially when we factor in what we wrote in yesterday’s Oil Trading Alert:
(…) From the technical point of view, this is the point from where crude oil should go north (at least later today) as the proximity to the support level will likely encourage some investors to push the buy button. But is this the right place to open long positions? Not really. The reason? Firstly, light crude is still trading in the declining trend channel, which means that even if we see a rebound from here, oil bulls will have to push the price above the upper line of the formation before we’ll see another sizable upward move. Secondly, as we mentioned earlier, crude oil still remains below the strong medium-term resistance zone, which keeps gains in check. Finally, when we take a closer look at the daily chart, we clearly see that the recent corrective upswing is much smaller than the previous one, which means that oil bulls are even weaker than they were in July. Therefore, in our opinion, the downward trend is not threatened at the moment and another attempt to move lower should not surprise us. If this is the case, we think that the next downside target will be the combination of the 2014 low and the lower border of the declining trend channel around $91.24-$91.50.
Summing up, the situation from the long-, medium- and short-term perspective has deteriorated as crude oil declined not only below the March low and the support zone created by the 76.4% and 78.6% Fibonacci retracement levels, but also under the long-term green support line and the 200-week moving average. As we have pointed out before, with this downward move light crude also tested the strength of the 50-month moving average. What’s next? In our opinion, as long as there is no invalidation of the breakdown below the medium-term resistance zone another attempt to move lower and a test of the Jan low of $91.24 should not surprise us.
Having discussed the situation in crude oil, let’s examine the NYSE Arca Oil Index (XOI) to find out what the current outlook for oil stocks is.
Oil Stocks
Let’s begin with the long-term chart.
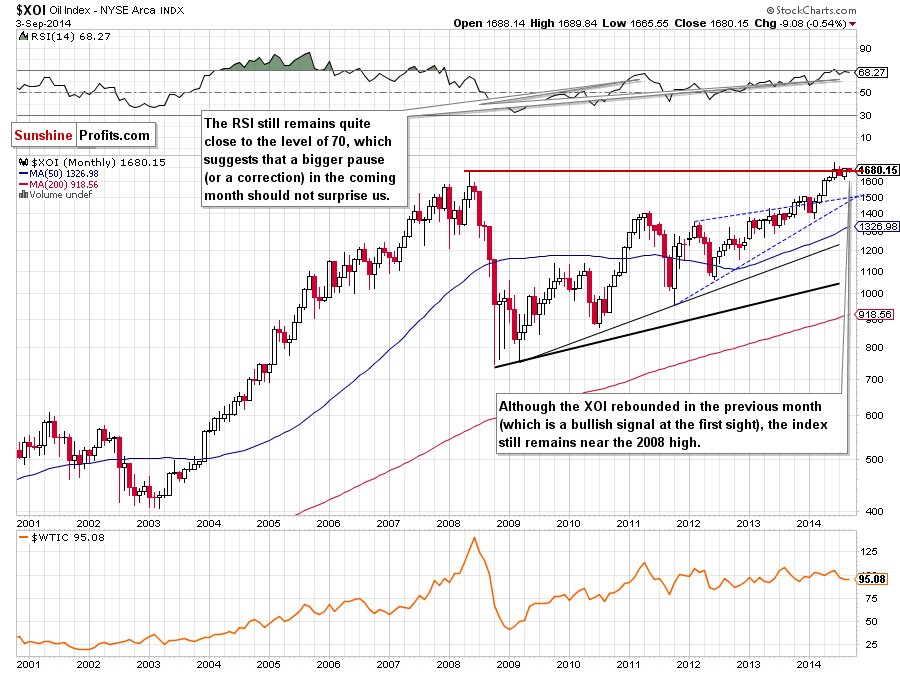
The situation in the long term hasn’t changed much since our previous Oil Investment Update was posted. As you see, although the XOI invalidated the breakout above the 2008 high, the oil stock index rebounded and still remains in a narrow range, quite close to this key support/resistance level. Therefore, we think that it’s worth focus on the medium-term changes and look for more clues about future moves on the weekly chart. So, let’s zoom in on our picture and move on to it.
A month ago, we wrote the following:
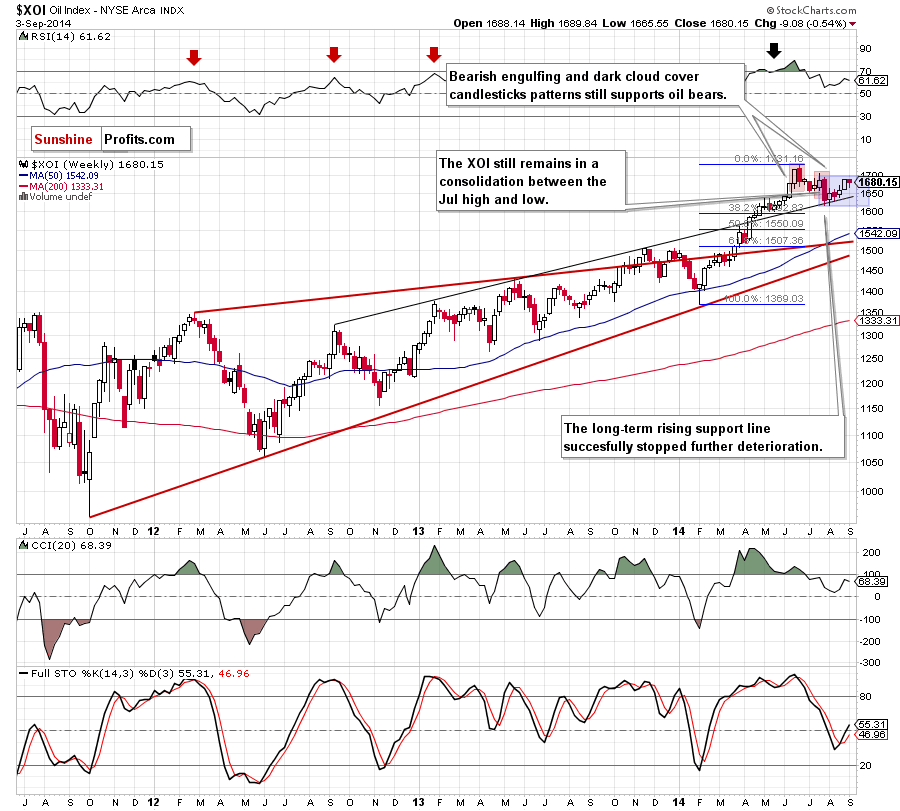
The XOI declined sharply and reached the long-term support/resistance line (marked with black) in the previous week. Because of this downswing, recent candlesticks formed a bearish engulfing pattern, which serves as the nearest medium-term resistance at the moment (around 1,695-1,704). At this point, it’s worth noting that above this area is also another bearish candlesticks formation – a dark cloud cover, which reinforces the resistance level created by the 2014 high. What’s next? If the long-term support/resistance line withstands the selling pressure, we’ll see a corrective upswing from here and an attempt to break above the nearest resistance.
Looking at the weekly chart, we see that the situation developed in tune with the above bullish scenario. Nevertheless, although the XOI moved visibly higher and approached our upside target, both candlestick formations still hold, supporting oil bears. As you see, the oil stocks index is trading in a consolidation (marked with blue), which suggests that as long as there is no breakout above the upper line of the formation (or a breakdown below the lower line) another sizable move is not likely to be seen. In our opinion, even if the XOI moves lower from here, the long-term support/resistance line will likely stop further deterioration – similarly to what we saw in the previous month. Nevertheless, if this key line is broken - we’ll see further deterioration and a test of the strength of the psychological barrier of 1,600 in the coming weeks. Please note that this area is reinforced by the 38.2% Fibonacci retracement based on the entire Feb-June rally, which may pause declines.
Having discussed the medium-term outlook, let’s turn to the daily chart.
Quoting our previous Oil Investment Update:
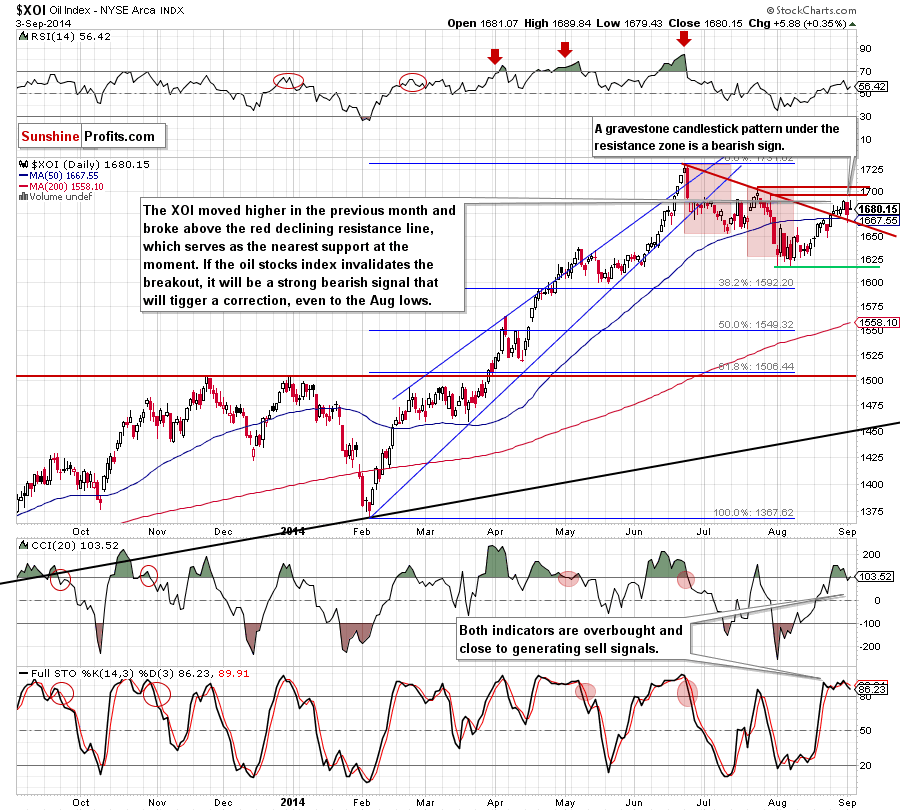
(…) we would like to draw your attention to the position of the indicators. As you can see the CCI and Stochastic Oscillator are oversold (additionally the latter generated a buy signal), which suggests that a pause or corrective upswing are just around the corner.
As you see on the above chart, these positive signals encouraged oil bulls to act and resulted in an upward move, which took the XOI to slightly below the psychological barrier of 1.700. With this rally, the oil stocks index also invalidated the breakdown below the red declining resistance line, which serves as the nearest support at the moment. Although this is a strong bullish signal, we should keep in mind that the XOI still remains below the resistance zone created by the Jul highs (1.694-1.704) and reinforced by the technical barrier of 1.700, while the CCI and Stochastic Oscillator are overbought (the latter generated a sell signal). Additionally, yesterday’s move brought a bearish gravestone candlestick. All the above, suggests that we’ll see another test of the strength of the red declining line in the coming days. If it’s broken, the next downside target will be the Aug 22 low of 1.648, or even the bottom of the recent decline around 1.616.
Before we summarize the current situation in the oil stocks index, we would like to draw your attention to the chart below.
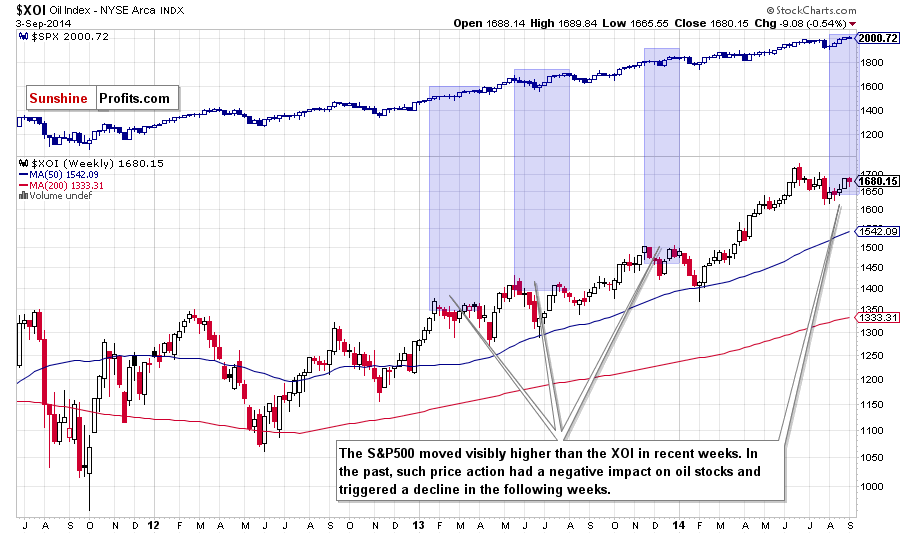
On the above chart, we clearly see that the S&P500 moved visibly higher than the XOI in the recent weeks. We saw similar situations several times in the past and in all previous cases such price action preceded a decline in oil stocks. Therefore, taking into account the overall picture of the XOI and combining it with this negative devergence between the index and the S&P500, we think that the next move will be to the downside.
Summing up, although the long- and medium-term outlooks for oil stocks hasn’t changed much, the short-term picture has improved as the XOI invalidated the breakdown below the declining resistance line. As we have pointed out before, although this is a bullish signal, the current position of the short-term indicators, all bearish candlesticks patterns and a negative divergence between the XOI and S&P500 suggests that we’ll see a correction in the near future. If this is the case, oil stocks will drop to (at least) 1.640, where the long-term support line (marked on the weekly chart) is. If it holds, we’ll see a rebound to the current levels, but if it’s broken, the XOI will drop to the Aug low or even to the 38.2% Fibonacci retracement based on the entire Feb-Jun rally (around the psychologocal barrier of 1.600).
Crude Oil - Oil Stocks Link
Having discussed the current situation in crude oil and the oil stock index, let’s comment on the relationship between them.
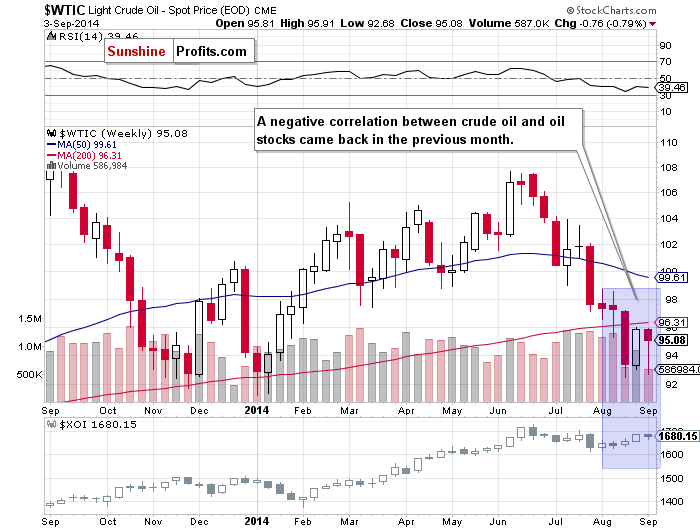
When we take a look at the weekly chart and compare the price action in both cases, we see that a negative correlation between the WTIC and the XOI came back in the previous month. As you see on the above chart, during the recent weeks crude oil declined sharply and approached the 2014 low. Meanwhile, oil stocks rebounded and reached the Jul high, which clearly shows that they are much stronger than the commodity itself. If this relation remains in place in the coming weeks, further improvement in the XOI should correspond to the decline in crude oil. On the other hand, if oil stocks drops in the short term (taking into account the very short-term picture that we’ve discussed above), we may see further improvement in the commodity. Where crude oil head next? Let’s examine four interesting ratios and look for more clues about future moves.
Ratio Analysis
Today, we start this section by focusing on the oil-stocks-to-oil ratio. What impact could it have on future oil moves? Let’s examine the long-term picture.
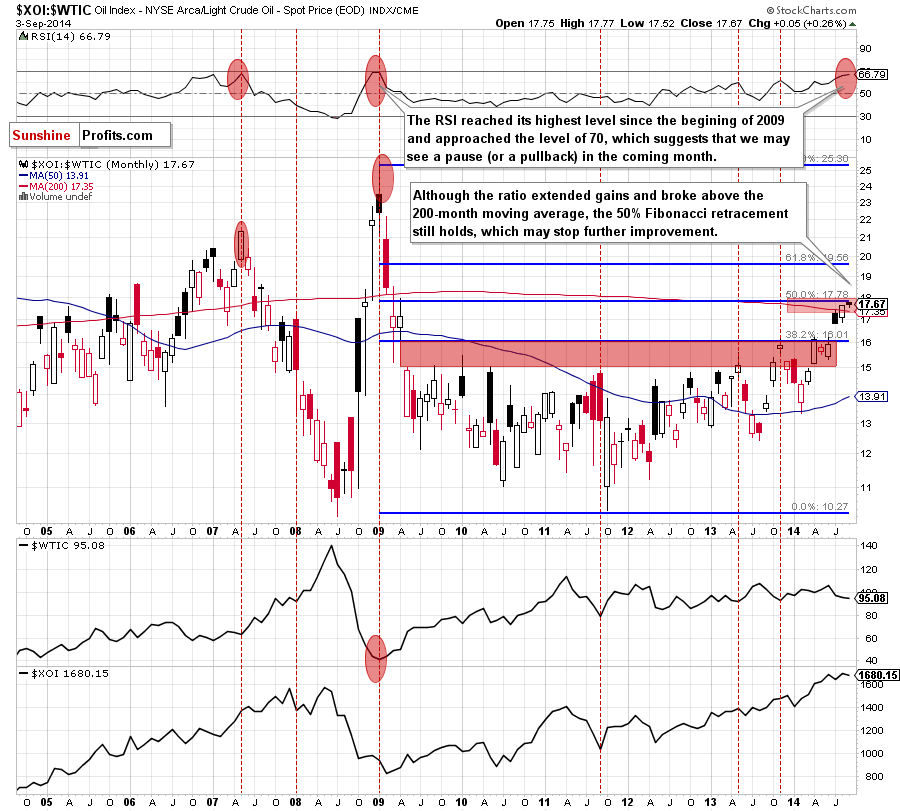
From this perspective, we see that the ratio broke above the 200-month moving average, which is a bullish signal. Despite this increase, it still remains below the 50% Fibonacci retracement. Taking into account the current position of the RSI (which reached its highest level since the beginning of 2009), it seems to us that this resistance level will be strong enough to stop futher rally. If this is the case and the local top is already in, we may see a correction from here to the gap between June and July (16.40-16.81). What does it mean for crude oil? As you see on the above chart, many times in the past, the local top in the ratio have corresponded to the local botom in the commodity. We saw such situation in Jan. 2009, Sept. 2011, May 2013 and Nov. 2013. Therefore, we think that we may see a similar situation in the coming month.
Will the medium-term picture give us more clues? Let’s check.
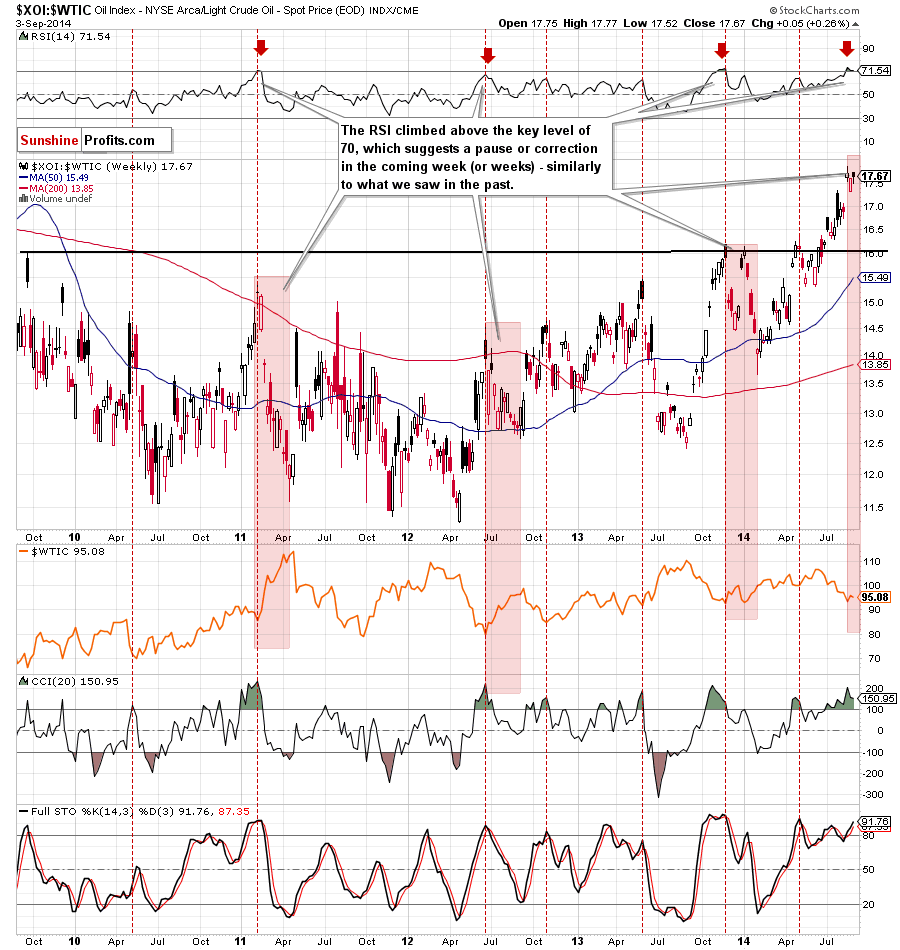
On the above chart, we see that the RSI climbed above the level of 70, while the CCI and Stochastic Oscillator are overbought (additionally, there is a negative divergence between the latter ant the ratio), which suggests a pause or correction in the coming week (or weeks). As we mentioned earlier, if the ratio declines from here, it will translate to higher values of crude oil. Therefore, we think that it’s worth to keep an eye on the above chart because we may receive a valuable clue where the commodity head next.
In our previous Oil Investment Update we focused on the stocks-to-oil ratio. This time, we decided to examine its inverse - the oil-to-stocks ratio. Can we infer something more about future moves?
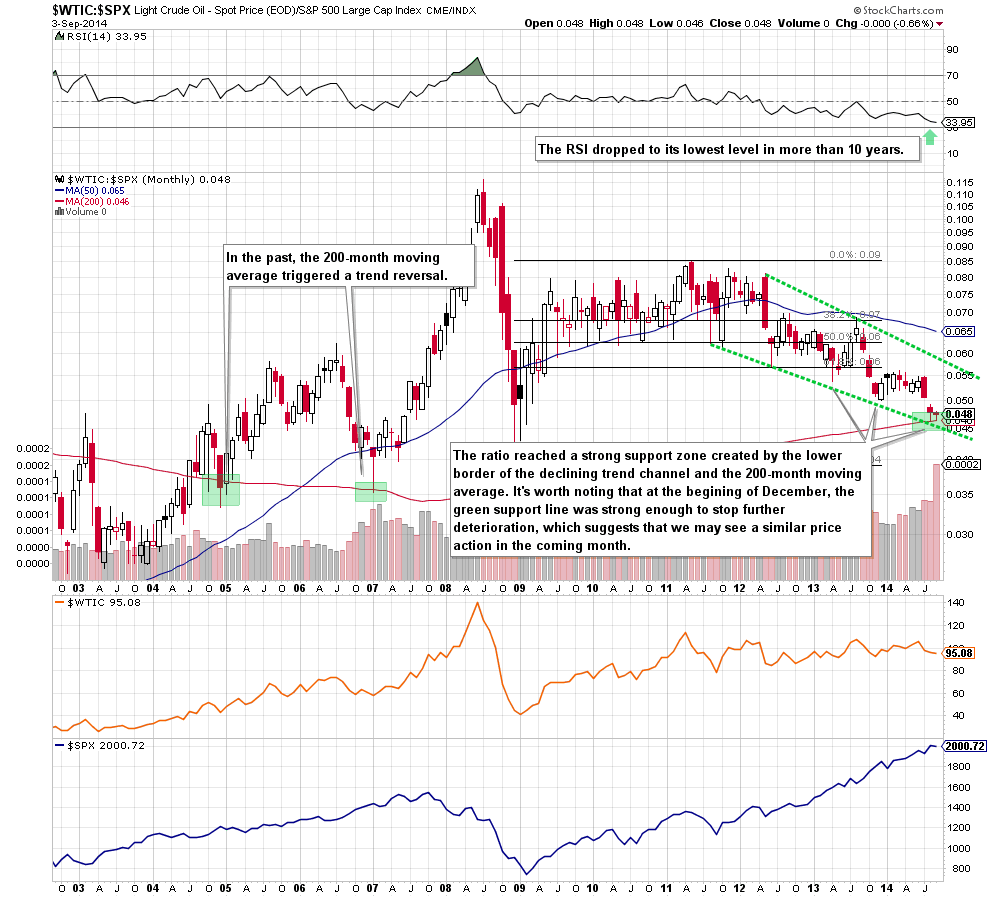
The first thing that catches the eye on the above chart is a drop to a strong support zone created by the lower border of the declining trend channel and the 200-month moving average. As you see on the monthly chart, this important moving average triggered a trend reversal at the begining of 2005 and also later in 2007. On top od that, the proximity to the green support line encouraged oil bulls to act in April 2013 and also at the end of the last year. Taking these facts into account and combining with the current position of the RSI (which dropped to its lowest level in more than 10 years), it seems to us that this area will be strong enough to stop further deterioration in the ratio, which should bring a rebound in crude oil.
Having say that, let’s zoom in our picture and take a closer look at the weekly chart.
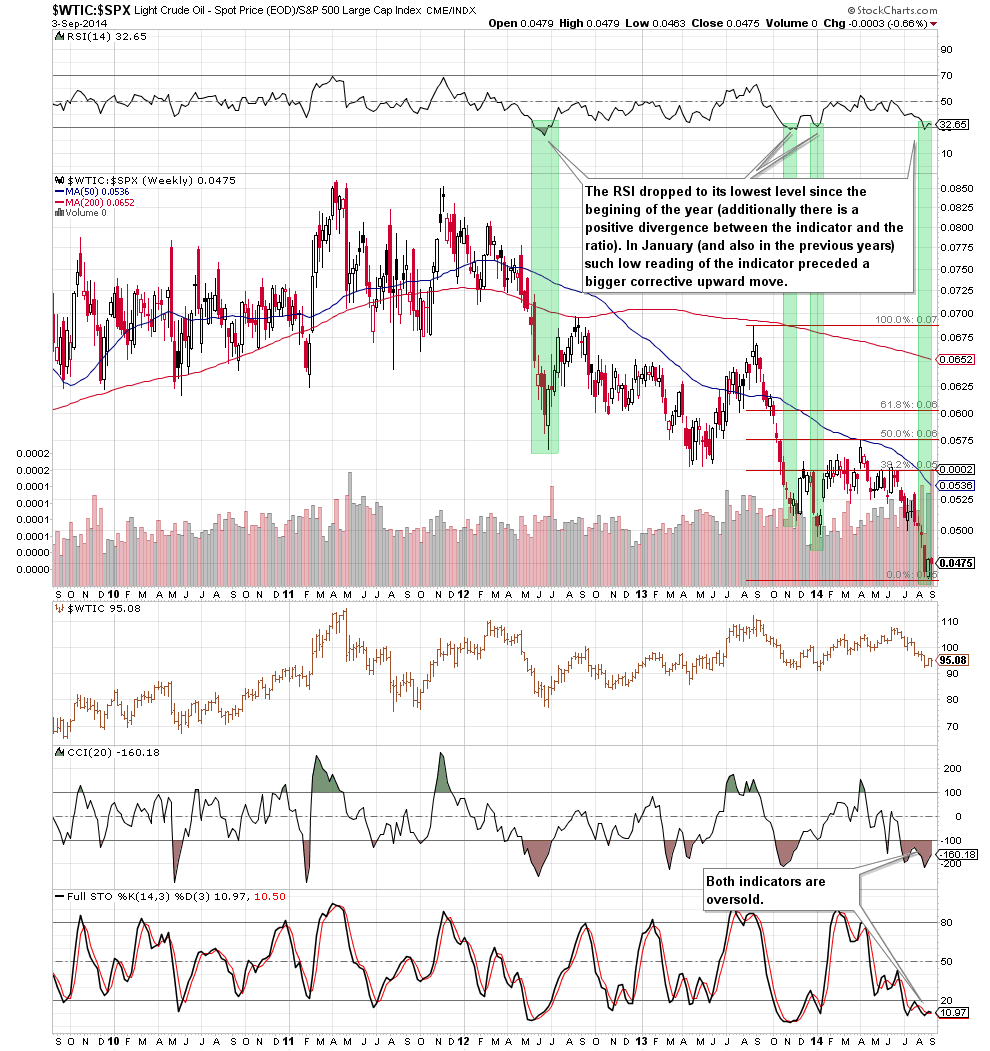
From this perspective, we see that the RSI dropped to its lowest level since the beginning of the year. As you see on the above chart, such low value preceded bigger corrective upward moves several times in the past. We saw similar situation in June 2012, November 2013 and also in January. Additionally, when we take a closer look, we can see a positive divergence between the RSI and the ratio, which is another positive signal. All the above provide us with bullish implications and suggests that a rebound in the ratio and also in crude oil is just around the corner.
Once we know the situation in the above ratios, let’s move on to the gold-to-oil ratio.
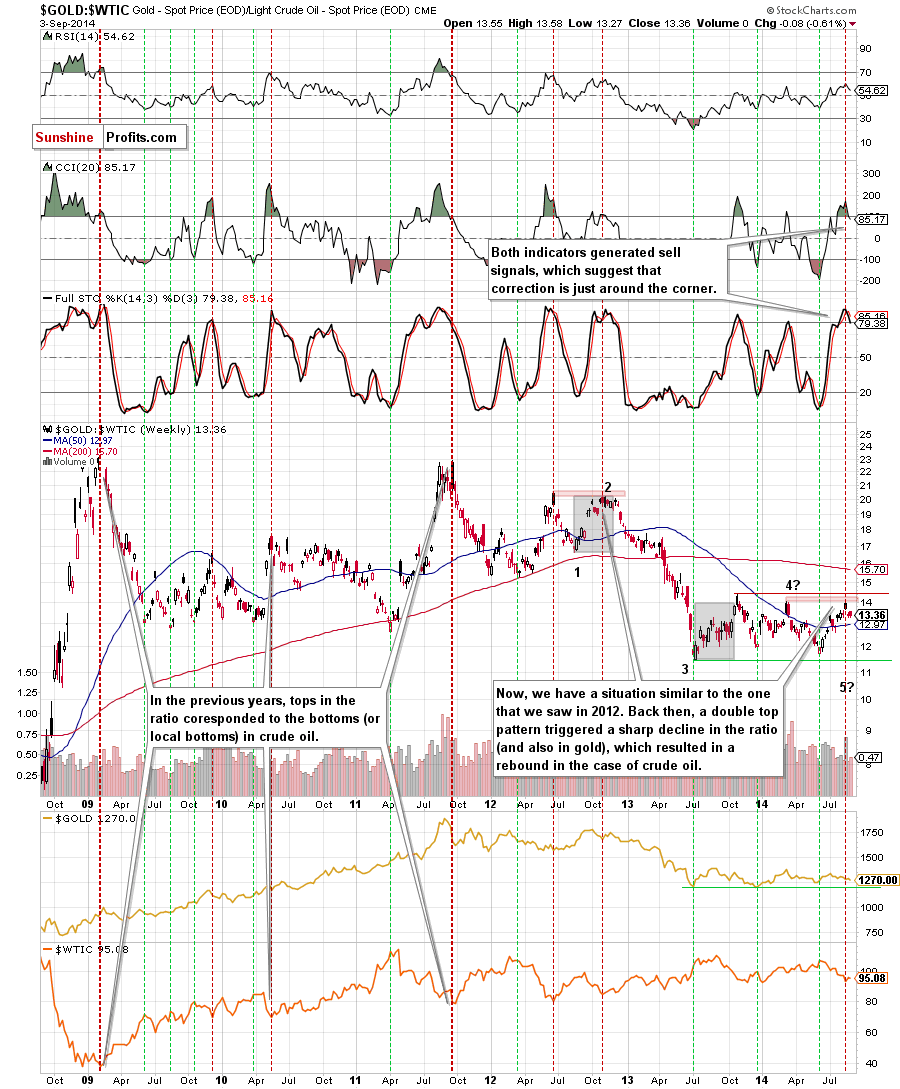
Looking at the above chart, we see that now we have a similar situation to the one that we saw in 2012 (we marked it with red). Back then, a double top pattern triggered a sharp decline in the ratio, which resulted in a rebound in crude oil. Based on that event, we think that we’ll see a drop in the ratio in the coming weeks – especially when we factor in the fact that the CCI and Stochastic Oscillator generated sell signals. On top of that, this bearish scenario is also reinforced by the current Elliott’s waves structure.
In our opinion, during the last year, the ratio was trading in the wave 4 (it was bigger than the wave 2 and has a different structure, which is in line with the Elliott Wave Theory). Therefore, it seems to us that the wave 5 is still ahead us. What does it mean for crude oil? As you see on the above chart, in the previous years, local tops in the ratio corresponded to the bottoms in crude oil. We saw such situations in February and December 2009, September 2011, June and October 2012. Taking into account the fact that history repeated itself in all these cases, we think that another decline in the ratio will trigger an upward move in light crude.
And what about gold? In 2011 lower values of the ratio have translated to declines in this commodity. We also saw such price action since November 2012 until June 2013 and later at the end of the previous year. In March, the local top in the ratio corresponded to the 2014 high in gold and the ratio’s local bottom in June appeared more or less at the same time as the bottom of the previous bigger correction in the commodity. All the above provides us with bearish implications and suggests that the final bottom in gold is still ahead us.
Non-USD Crude Oil Price
Finishing today’s Oil Investment Update, let’s take a look at the non-USD (WTIC:UDN ratio) chart of crude oil. As a reminder, UDN is the symbol for the PowerShares DB US Dollar Index Bearish Fund, which moves in the exact opposite direction to the USD Index. Since the USD Index is a weighted average of the dollar's exchange rates with world's most important currencies, the WTIC:UDN ratio displays the value of crude oil priced in "other currencies".
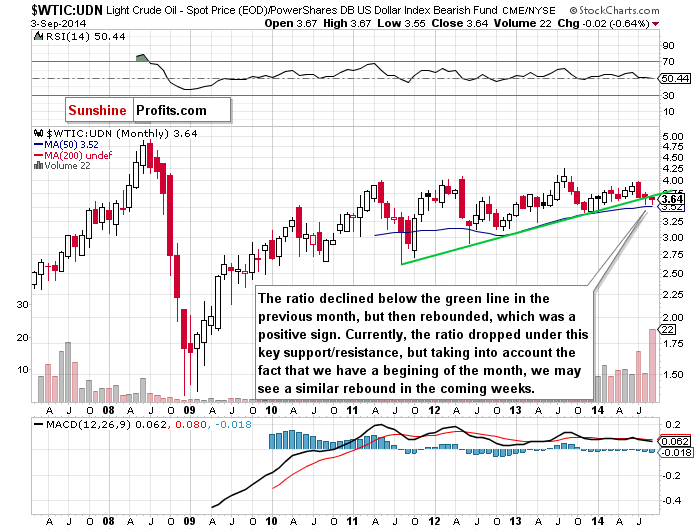
The long term outlook has deteriorated as the ratio dropped below the green support line once again. Although this is a bearish signal, we should keep in mind that we saw a similar situation in the previous month. Back then, the WTIC:UDN rebounded and came back to the previous levels. Additionally, the ratio is still trading above the 50-month moving average, which successfully stopped further deterioration at the beginning of the year.
Can we infer something more from the weekly chart? Let’s find out.
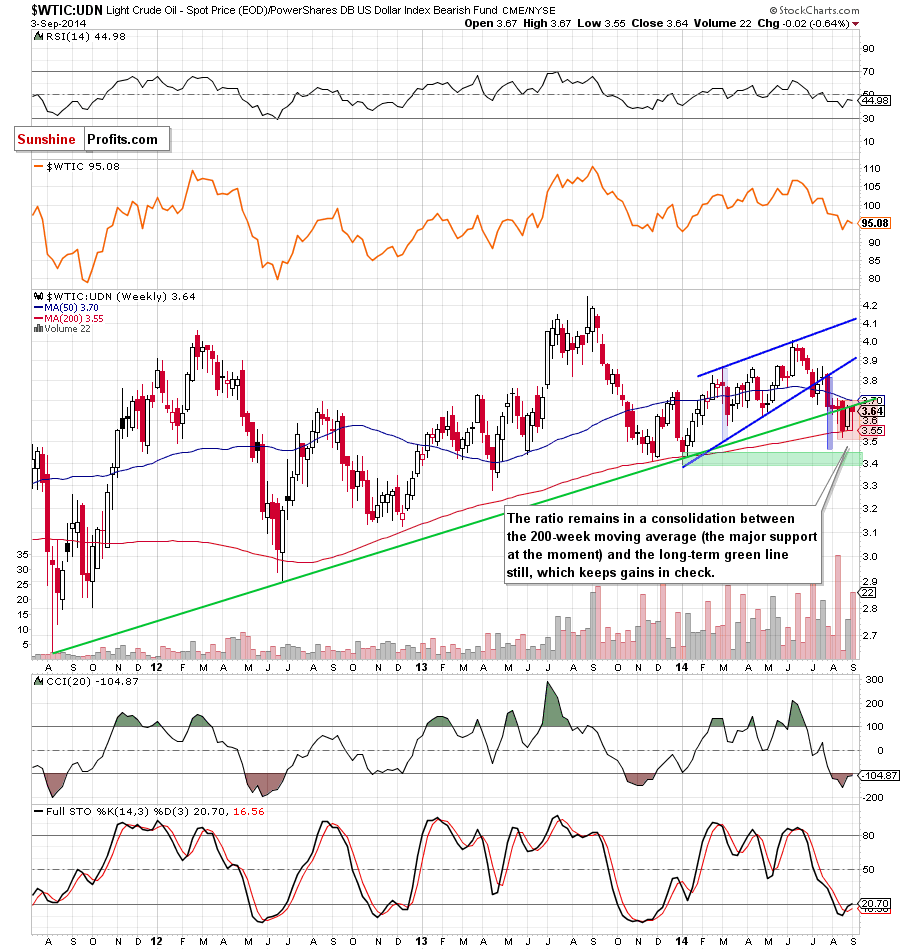
Looking at the above chart, we see that the ratio is consolidating between the 200-week moving average (which serves as major support at the moment) and the previously-broken long-term green support/resistance line. Taking into account the fact that this important moving average stopped further declines and triggered a trend reversal in June and December 2012, November 2013 and also at the beginning of this year, we think that we’ll see similar price action in the coming weeks – especially when we factor in the current position of the indicators (the CCI and Stochastic Oscillator are oversold and the latter generated a buy signal, which is a bullish sign).
Scenarios
Just like a month ago, today’s Oil Investment Update includes scenarios of what could happen in the coming weeks. Naturally, we will continue to monitor the market in the coming days and if anything invalidates our long-term outlook we will send you an additional message.
- Bullish scenario
If the proximity to the January low of $91.24 encourages oil traders to act, we’ll see a corrective upswing from here and a breakout above the upper line of the declining trend channel marked on the daily chart. In this case, the initial upside target will be around $98-$99, where the Aug highs and the 38.2% Fibonacci retracement based on the entire Jun-Aug decline (and also the 50% of the Jul-Aug downward move) are. Please note that this scenario will be even more likely, if crude oil invalidates the breakdown below the long-term support/resistance line and the 200-week moving average marked on the weekly chart. - Bearish scenario
If the commodity extends losses and drops below the 2014 low, we will see a drop to around $90, where the 61.8% Fibonacci retracement based on the entire Jun-Aug 2013 rally is. In our opinion, this is the less likely of scenarios to play out (as the current situation in the ratios suggests that the next move will be to the upside) but cannot be ruled out as an option.
Summary
The overall situation in crude oil has deteriorated as the commodity declined below the long-term green support line and the 200-week moving average. Nevertheless, taking into account the proximity to the January low of $91.24 and the 50-month moving average, it seems to us that even if light crude moves lower and test the 2014 low, the next bigger move will be to the upside. In our opinion, this scenario is reinforced not only by the position of the short-term indicators, which already generated buy signals, but also by the situation in the oil-stocks-to-oil, stocks-to-oil ratio and gold-to-oil ratios. The strong support/resistance levels in combination with a readings of the RSI and both other indicators suggests that a bottom of the recent decline is just around the corner.
Very short-term outlook: mixed
Short-term outlook: mixed
MT outlook: bearish
LT outlook: bullish
Trading position (our opinion): If one wants to hold their long position for months, it doesn't seem that the current move lower needs to be really concerning - even if oil drops to $90. In other cases, it seems to us that waiting on the sidelines until the situation becomes clearer is a good idea (which is also our preferred approach at this time).
This completes this month’s Oil Investment Update. Our next Oil Investment Update is scheduled for Friday, October 3, 2014. Oil Trading Alerts subscribers will additionally receive similar but shorter alerts on a daily basis (or more than once a day when the situation requires it). You – Oil Investment Updates subscribers – will receive short Investment Alert messages should the outlook for the medium or long term change before the next Update is posted.
Thank you.
Nadia Simmons
Forex & Oil Trading Strategist
Oil Investment Updates
Oil Trading Alerts

