

Although the OPEC and non-OPEC producers agreed to maintain the output cut until the end of 2018 at the end of the previous month and the weekly Energy Information Administration’s reports have shown consecutive declines in crude oil inventories the price of crude oil didn’t soar to fresh 2017 highs. In our opinion, such situation was mainly caused by increasing American output, which hit 9.79 million bpd in the previous week. As a result, production climbed to its highest level since the early 1970s and approached the Saudi Arabia and Russia outputs, undermining efforts led by these countries to tighten the oil market through stopping supplies later this year and in 2018.
Will U.S. output break above 10 million bpd? In our opinion, it’s just a matter of time when the American production will be close to top producer Russia, which pumps around 11 million bpd. What does it mean for black gold? In our opinion, declines. This pro bearish scenario will be even more likely if any of OPEC or non-OPEC producers decides to increase the production, seeing no output cuts in the U.S. And speaking of this, not so long ago, some producers, including Russia, had raised concerns over whether the deal should continue through the end of 2018, which doesn’t bode well for the November agreement and oil bulls in the coming year. Will the technical picture of light crude confirm that black clouds are gathering over the commodity? Let’s jump right into the charts (charts courtesy of http://stockcharts.com) and try to find out.
Crude Oil
Let’s start today’s Oil Investment Update with the short-term picture of crude oil.
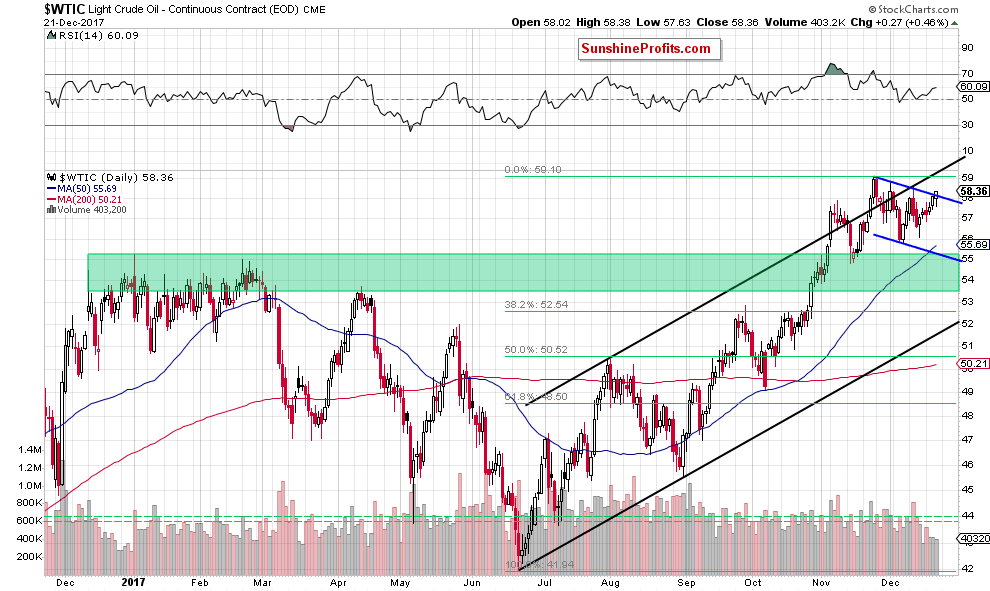
The first thing that catches the eye on the daily chart is the breakout above the upper border of the very short-term blue declining trend channel. Although this is a positive event, we have some doubts about further improvement.
Why?
When we take a closer look at the above chart, we see that the size of volume, which accompanied yesterday’s increase was smaller than what we saw on Tuesday and Wednesday. Such situation raises doubts about oil bulls’ strength and further rally – especially when we compare it to the size of volume during declines.
Additionally, the space for gains is limited as the recent highs, the upper border of the black rising trend channel, the medium- and long-term resistances are very close.
Let’s take a closer look at the weekly chart below.
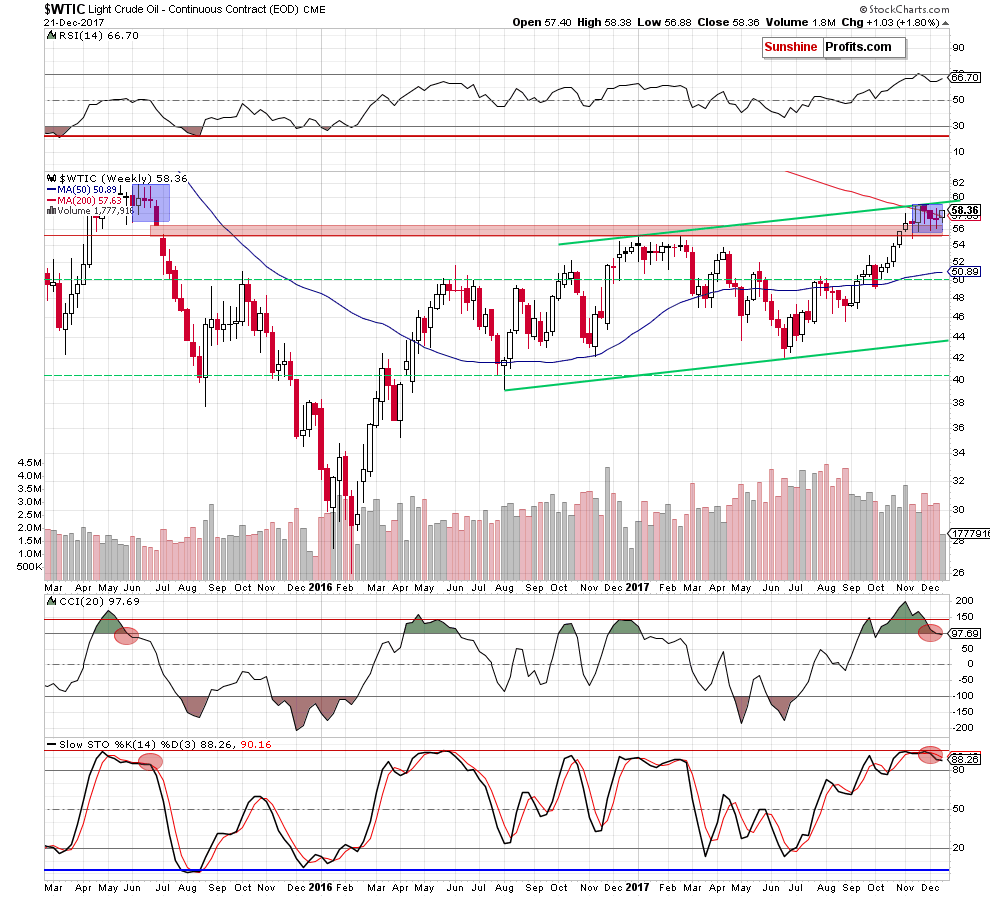
Looking at the above chart, we clearly see that although light crude came back above the 200-week moving average, it’s not a bullish development anymore, because we saw similar price action several times in the previous weeks and none of these invalidations brought significant growth.
Additionally, the sell signals generated by the medium-term indicators remain in cards, suggesting lower prices of black gold in the coming weeks.
On top of that, when we focus on the above chart, we can notice one more negative fact – a similarity to what we saw in June 2015. Back then, crude oil also remained in the consolidation for several weeks (marked with blue). What’s interesting, these were similar levels to those, which we observe on the charts now (the November peak was in the middle of the 2015 consolidation). What happened after that? As you see on the weekly chart, the breakdown below the lower line of the formation preceded not only the red gap, but also a significant decline in the following weeks.
And speaking about similarities… analyzing the medium-term chart, we noticed one more interesting resemblance. Let’s take a look at the weekly chart once again.
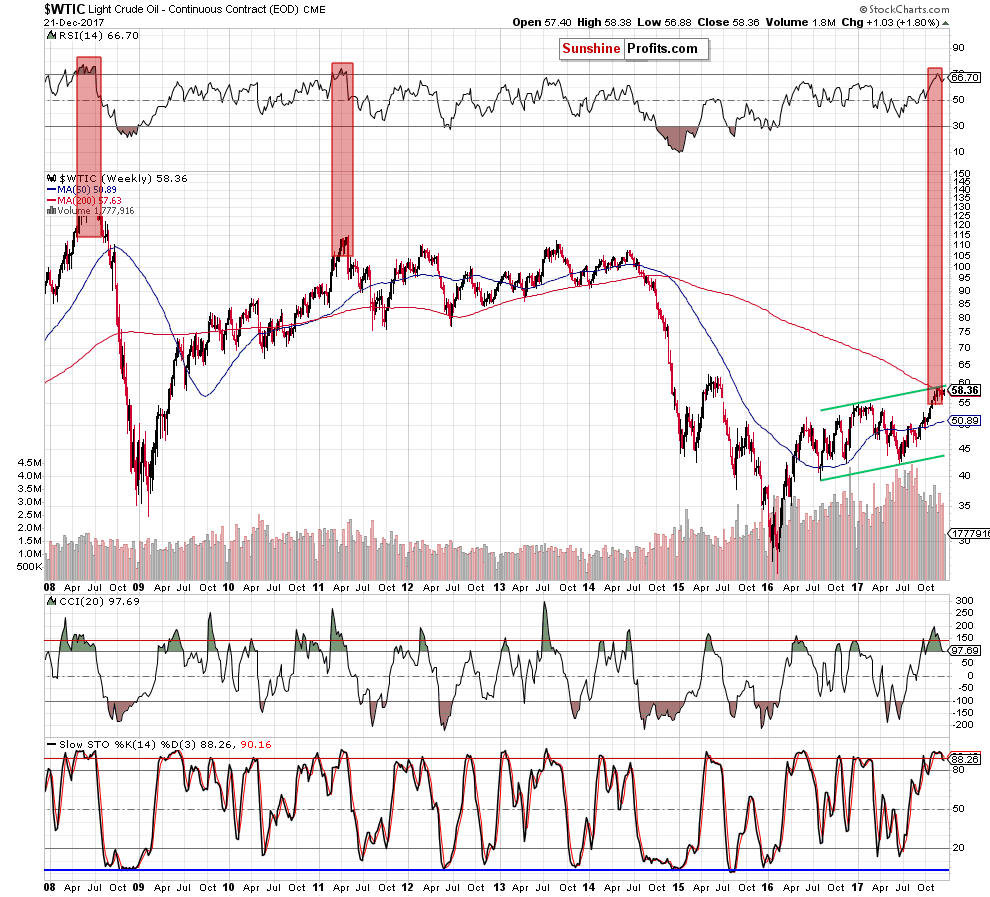
From this perspective, we see that the RSI climbed above the level of 70 only 3 times since almost 10 years. Such high reading of the indicator preceded the 2008 crude oil all time high and the May 2011 peak. In both these cases, we saw sizable declines in the following weeks, which suggests that history may repeat itself once again soon – especially when we factor in the proximity to the major resistance zone marked on the long-term chart.
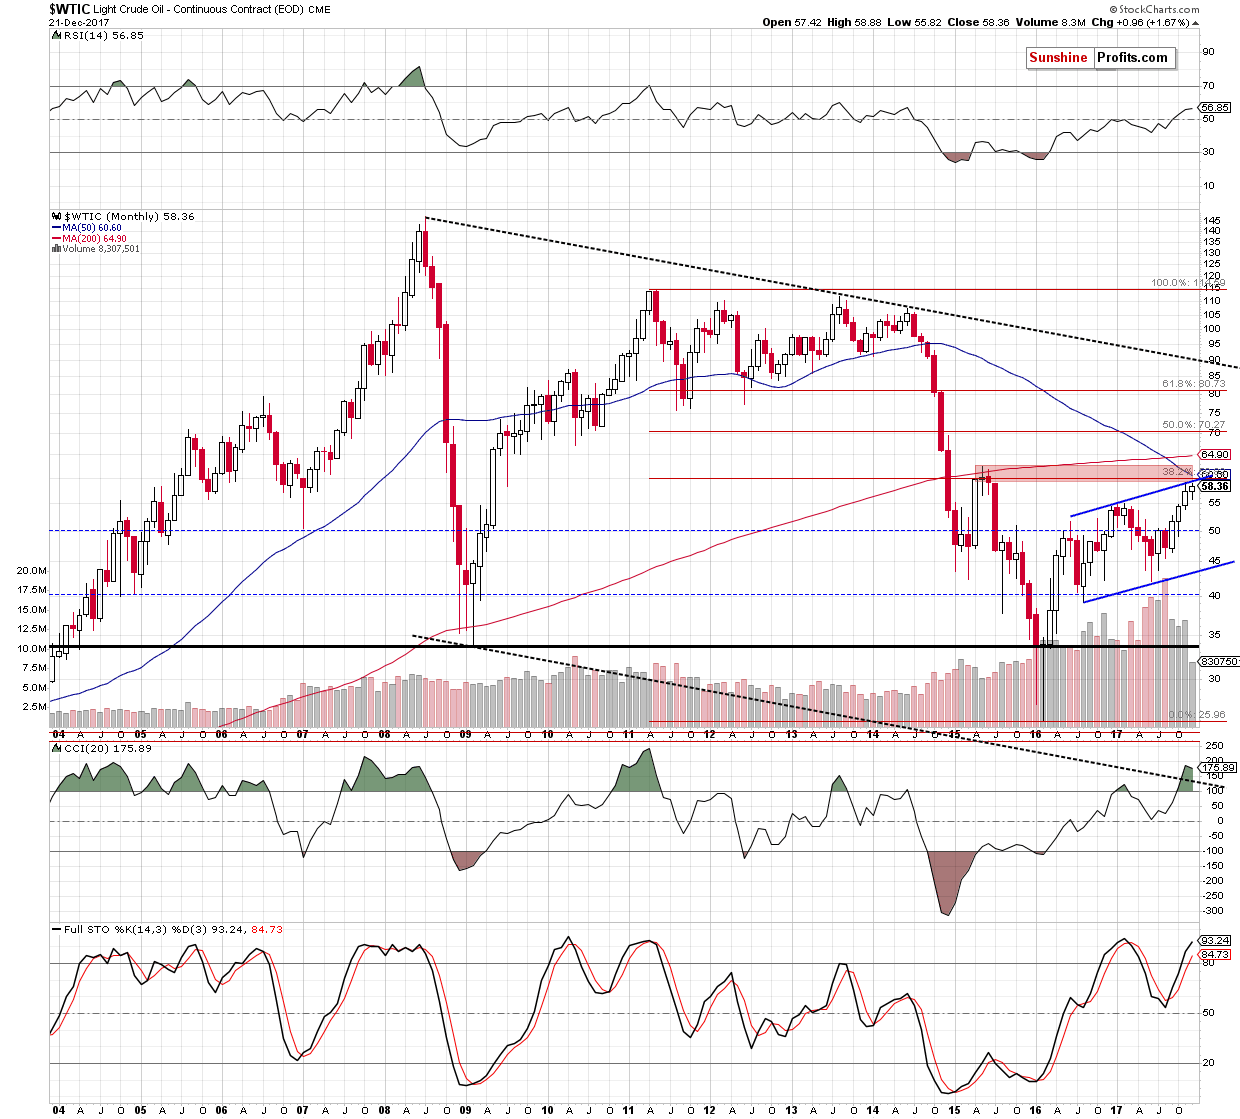
Looking at the monthly chart, we see that crude oil is trading not only below the upper border of the trend channel, but also under the very important red zone (created by the 2015 peaks), which remains the major resistance since mid-2015. As you see, this area is also reinforced by the 50-month moving average and the 38.2% Fibonacci retracement based on the entire 2011-2016 downward move.
What does it mean for crude oil and the bulls? In our opinion, as long as there is in breakout above this key resistance zone, the way to higher prices is blocked. In other words, a reversal and bigger move to the downside are just around the corner.
Taking all the above into account, you probably wonder how low could crude oil fall in the coming weeks. We will try to answer this question after analyzing the current situation in our interesting ratios.
Ratio Analysis
Let’s start this section with the long-term chart of the oil-to-gold ratio.
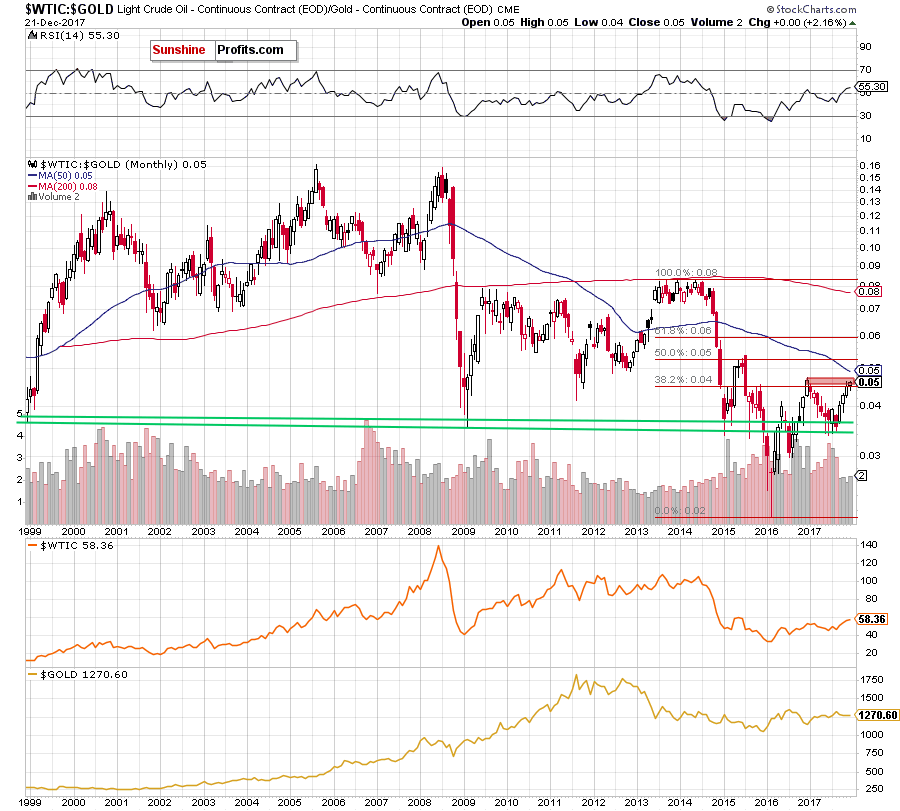
Earlier this month, the ratio bounced off the December low, broke above the 38.2% Fibonacci retracement and approached the November peak. At the first sight it seems a positive development, but we should keep in mind that the ratio remains in the red resistance zone. Therefore, in our opinion, as long as there is no breakout above this important area a reversal and declines are very likely – especially when we factor in the fact that we saw a similar situation at the beginning of the year. As a reminder, back then the bulls failed, which translated into declines in the following months.
When we focus on the medium-term chart below, we can also see additional bearish signs.
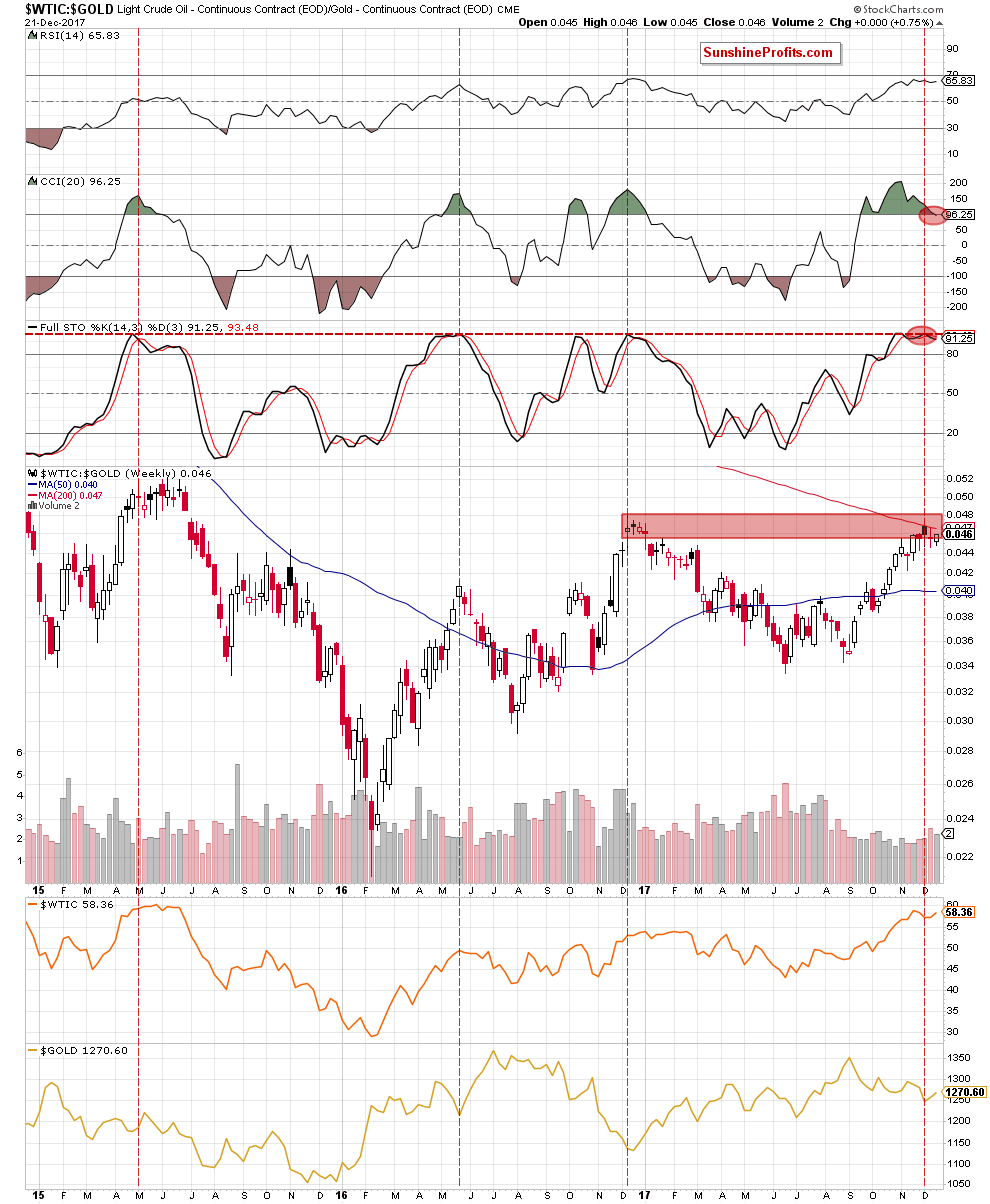
Firstly, the ratio is trading not only in the red resistance zone, but also below the 200-week moving average. Secondly, the sell signals generated by the CCI and the Stochastic Oscillator remain in cards, supporting oil bears.
At this point it is also worth remembering what we wrote about the Stochastic Oscillator behavior in the previous month:
(…) we would like to draw your attention to several similar situations to the current one. As you see on the above chart, there are red dashed horizontal and vertical lines marked on the indicator, which point to its highest levels since May 2015. What’s interesting in all these cases such high readings of the indicator preceded bigger moves to the downside. Therefore, in our opinion, the probability that we’ll see reversal and declines (…) is very likely – especially when we factor in the fact that there are similar regularities on the weekly chart of the oil-to-silver ratio below.
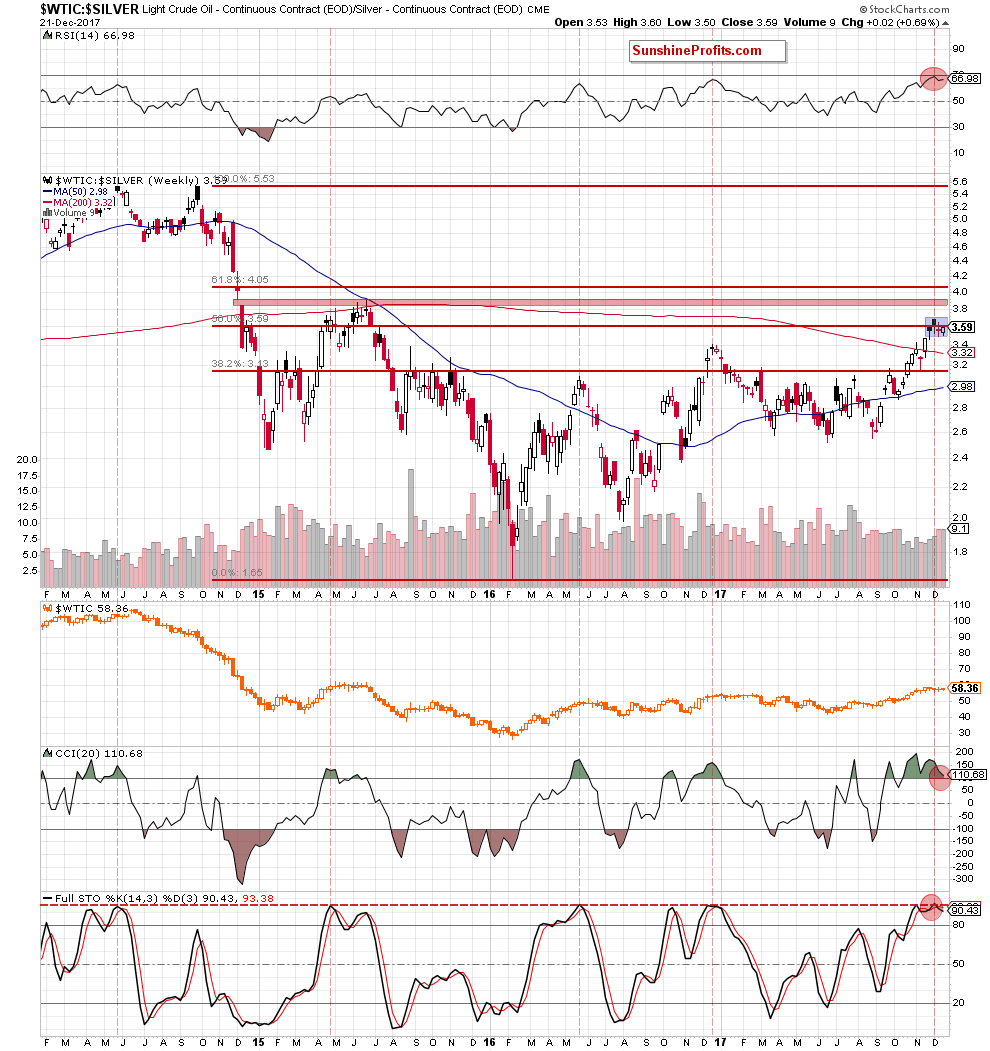
From this perspective, we see not only the above-mentioned regularity in the Stochastic Oscillator, but also two sell signals generated by this indicator and the CCI. Of top of that, the ratio invalidated a tiny breakout above the 50% Fibonacci retracement, which doesn’t bode well for further improvement. Why?
As you see on the chart, not far from current levels is also the red gap (created in December 2014), which serves as the major resistance for two years. In May and June 2015, the bulls tried to close it and break above the gap, but all attempts failed, which resulted in a significant decline if the following months. Taking all the above into account, we believe that the space for gains is limited and lower values of the ratio are very likely at the beginning of 2018.
What does it mean for crude oil? Looking at the above charts, we can notice a positive correlation between black gold and precious metals. Therefore, declines in these ratios will likely affect negatively the price of light crude in the following weeks.
Will the relationship between crude oil and oil stocks confirm this pro bearish scenario? Let’s examine the charts below to find out.
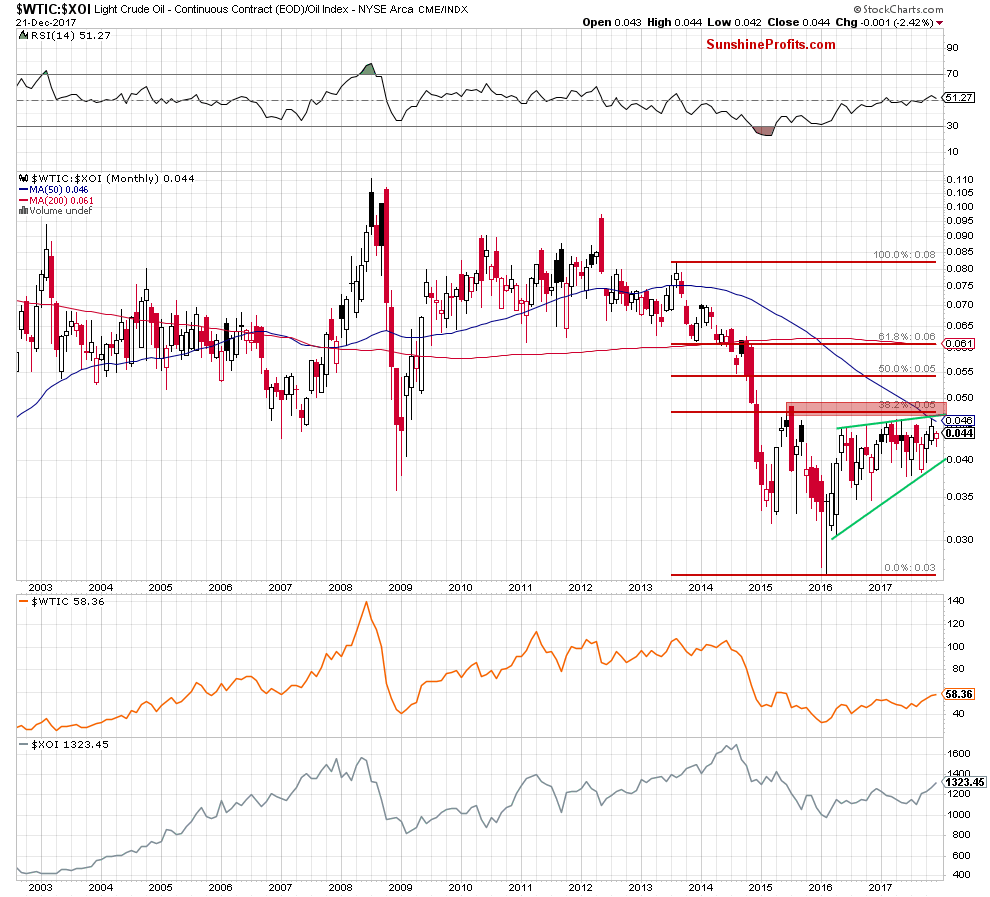
Looking at the long-term chart, we see that the overall situation hasn’t changed much as the ratio remains in the green rising wedge under a very important red resistance zone created by the July 2015 high, the 38.2% Fibonacci retracement and the 50-month moving average.
Having said that, let’s examine the medium-term chart below.
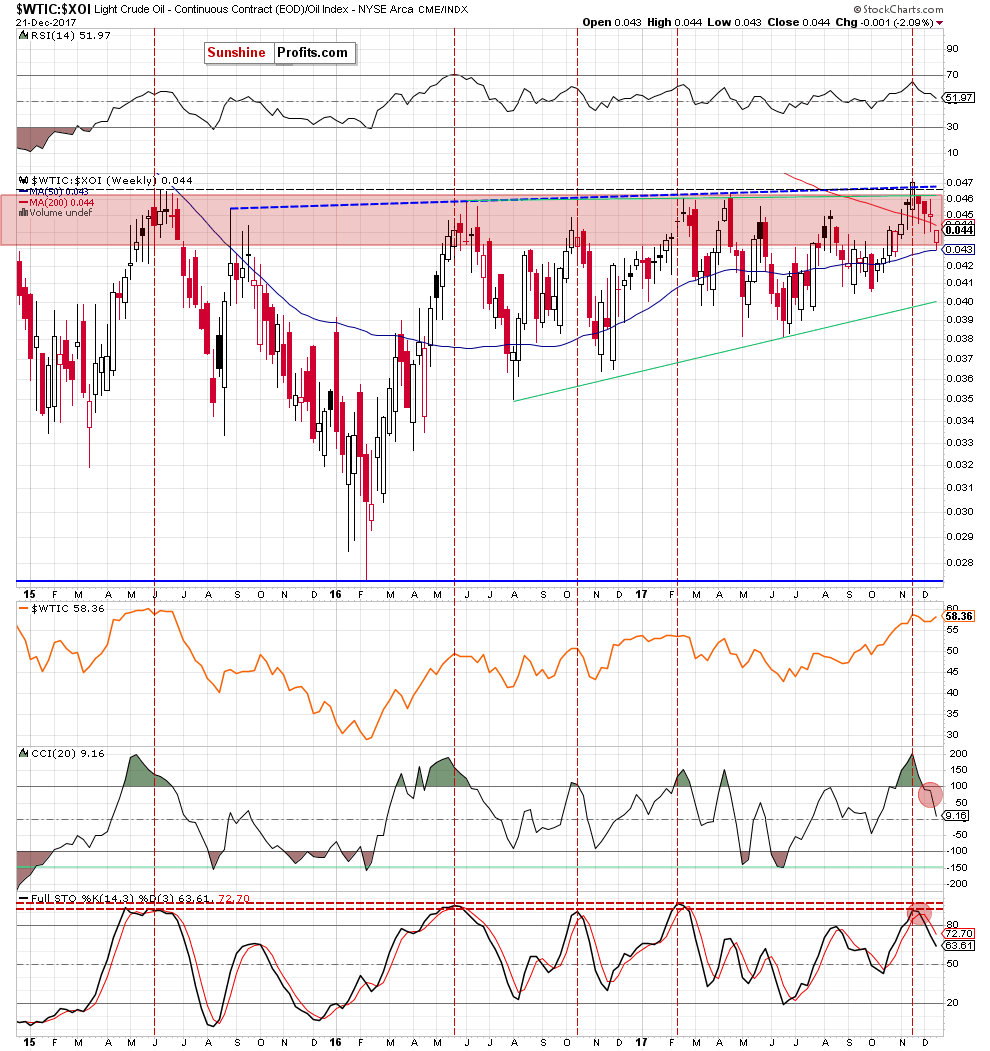
In our last Oil Investment Update, we wrote the following:
(…) the combination of the key red resistance zone and the 200-week moving average stopped oil bulls, triggering a small pullback.
What’s next? Although the moving average may not stop further increases, we clearly see that in all previous similar situations, the upper border of the red resistance zone (the upper border of the 2014 gap) was strong enough to stop rallies (in June, August 2015, in June October 2016 and in February, April, May and August 2017). Therefore, in our opinion, another reversal and further declines are just around the corner. If this is the case and the ratio extends losses, the initial downside target for the bears will be around 0.043, where the 50-week moving average is.
From today’s point of view, we see that the situation developed in line with the above scenario and the ratio declined in the recent weeks, reaching our downside target earlier this week. As you see, the 50-week moving average triggered a rebound, but will we see further improvement? Looking at the current position of the indicators (the sell signals and their negative impact remain in place), we think that even if the ratio moves a bit higher from here, the next bigger move will be to the downside.
If this is the case, and the ratio breaks below the blue moving average, we’ll see a test of the lower border of the green rising wedge in the following weeks.
How such price action could affect the price of crude oil? Although the correlation between the ratio and the commodity has slightly decreased, many examples from the past clearly show that the decreases in the ratio corresponded to the decreasing oil prices. Therefore, in our opinion, another move to the south will be more or less visible in both cases - the ratio and crude oil.
Finishing this part of our Oil Investment Update, let’s take a look at the current situation on the non-USD (WTIC:UDN ratio) chart of crude oil. As a reminder, UDN is the symbol for the PowerShares DB US Dollar Index Bearish Fund, which moves in the exact opposite direction to the USD Index. Since the USD Index is a weighted average of the dollar's exchange rates with world's most important currencies, the WTIC:UDN ratio displays the value of crude oil priced in "other currencies".
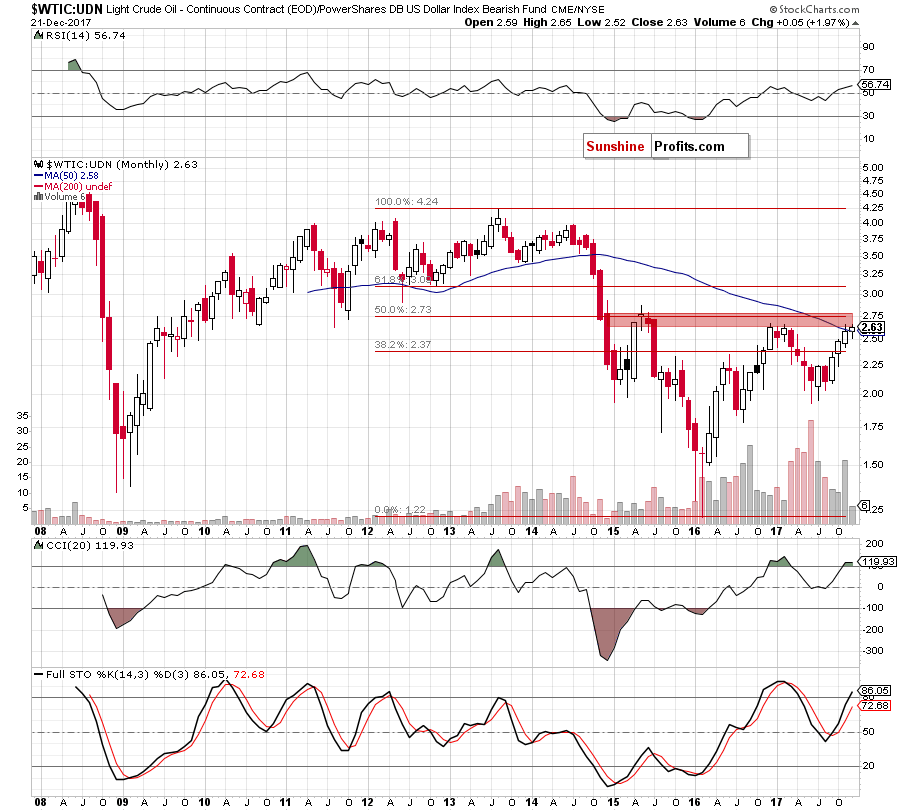
The first thing that catches the eye on the long-term chart is the breakout above the 50-month moving average. Although this seems a bullish development, please keep in mind that there are several sessions until the end of the year, which may change the appearance of this chart - just like last month.
Back then, the ratio increased above this resistance, but then reversed and canceled this move, invalidating the breakout as the red resistance zone (created by the 50% Fibonacci retracement, December 2014 high, May, June and July 2015 peaks, December, January and February 2016 highs (in terms of intra-month highs and opening values) managed to stop the bulls for the ninth time in a row.
What does it mean to us? In our opinion, as long as this key resistance continue to block the way to the north higher values of the ratio are not likely to be seen. This also suggests that we won’t see higher prices of crude oil priced in U.S. dollars until the breakout above this area.
Before we analyze the current situation in oil stocks, we would like to draw your attention to one more interesting similarity to the past. Let’s take a look at the weekly chart below.
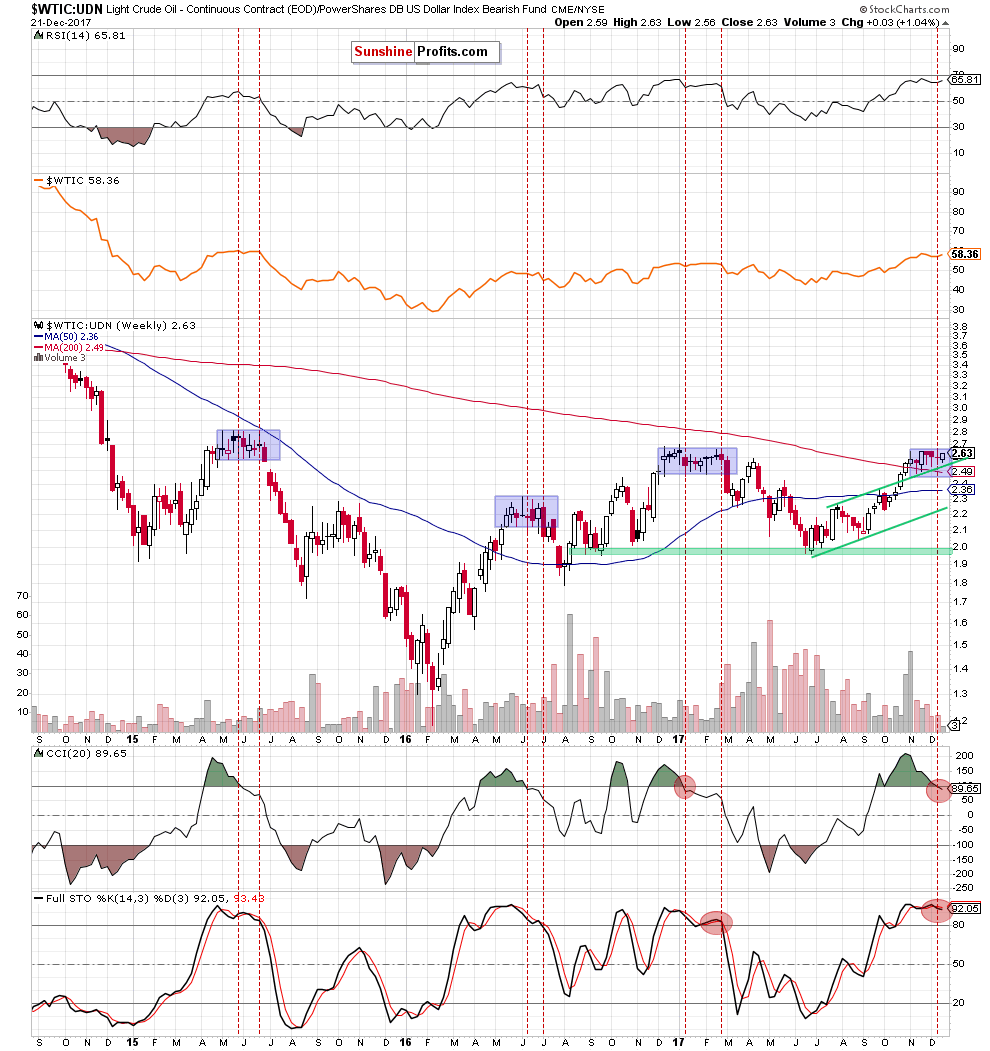
From this perspective, we see that the ratio remains in the blue consolidation – similarly to what we saw in May and June 2015, May and June 2016, December 2016 and January 2017. In all these cases, consolidations indicated the end of the upward moves, preceding smaller or larger declines in the following weeks. Additionally, the CCI and the Stochastic Oscillator generated the sell signals (exactly the same as in the case of previous consolidations), increasing the probability of another bigger move to the downside later this month or at the beginning of January.
Oil Stocks
Let’s examine the NYSE Arca Oil Index (XOI) to find out what the current outlook for oil stocks is.
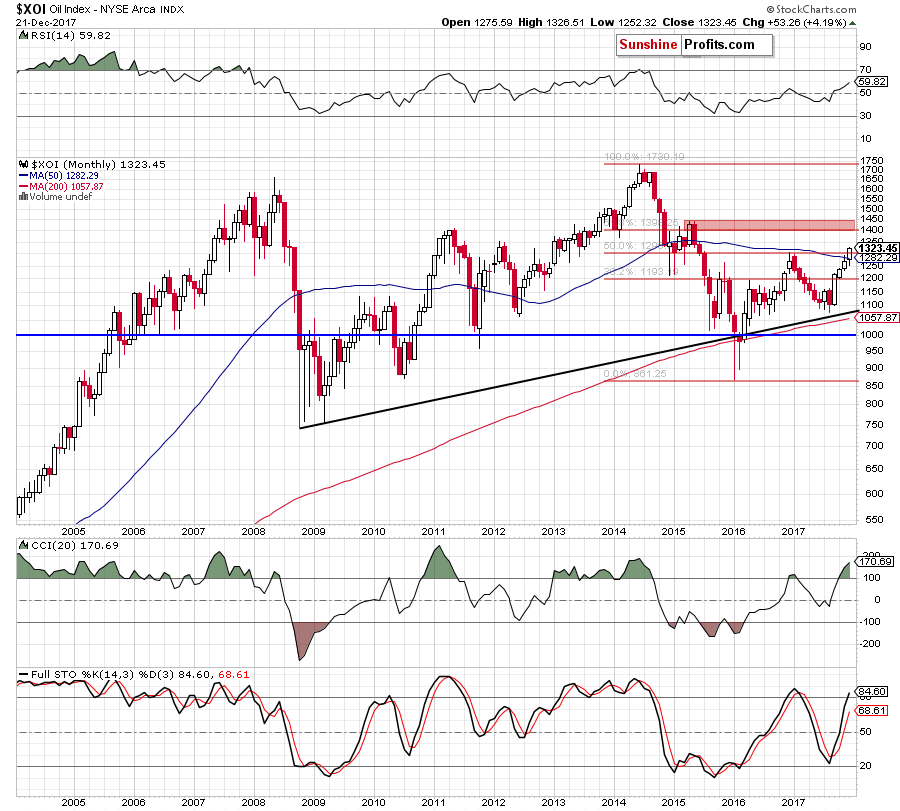
Looking at the long-term chart of oil stocks, we see that the XOI index extended gains in December, breaking above the 50% Fibonacci retracement, the December 2016 and January 2017 highs and the 50-month moving average. This is a bullish development, which opened the way to the red resistance zone created by the 61.8% Fibonacci retracement, the barrier of 1,400 and the April and May 2015 highs.
Nevertheless, when we take a closer look at the medium-term chart, we can see a few disturbing factors that can stop buyers in the coming weeks.
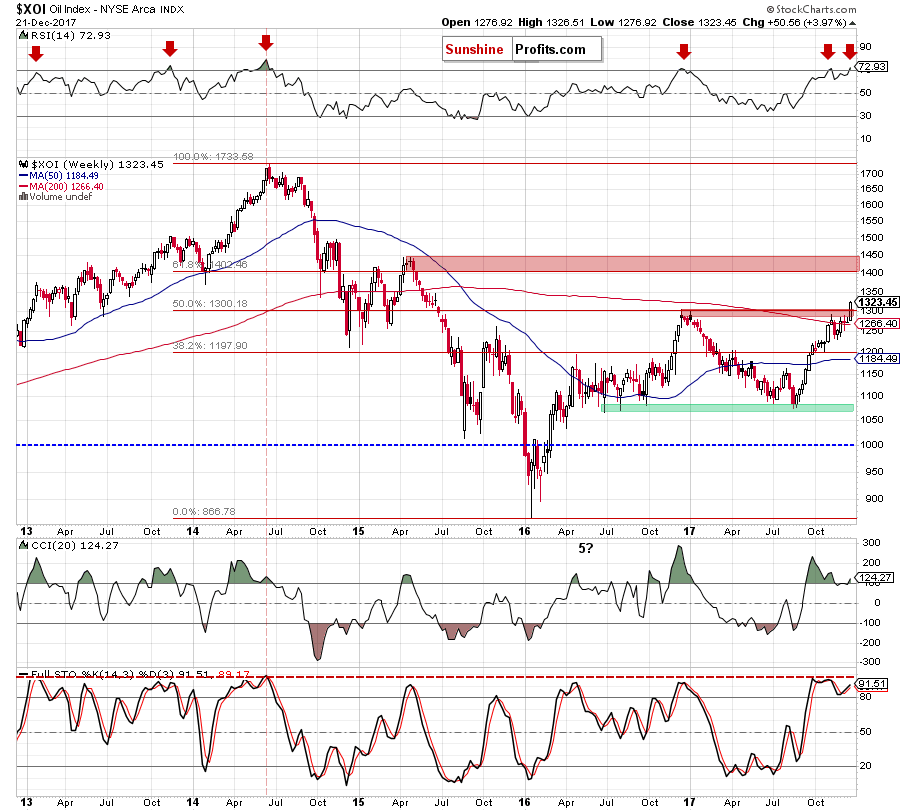
What do we mean? Looking at the above chart, we clearly see that although the CCI invalidated the earlier sell signal and the Stochastic Oscillator generated buy signal, they both remain in their overbought areas, which increases the probability of re-generating negative signals. Additionally, the RSI increased above the level of 70 – for the fifth time in four years. In all previous cases (except last month) such high readings of the indicator preceded bigger moves to the downside. Therefore, we think it's worth keeping an eye on oil stocks and observing the index's behavior around the barrier of 1,400, because there is a high probability that we will see a reversal in this area.
Scenarios
Just like a month ago, today’s Oil Investment Update includes scenarios of what could happen in the coming weeks. Naturally, we will continue to monitor the market in the coming days and if anything invalidates our long-term outlook we will send you an additional message.
- Bullish scenario
If crude oil extended gains and breaks above the November peak, we’ll see a test of the upper border of the back, rising trend channel marked on the daily chart. If this resistance is broken, we may see an increase to the upper border of the green rising trend channel seen on the weekly chart (currently around $59.33) or even a test of the red resistance zone seen on the monthly chart, which is created by the 38.2% Fibonacci retracement, the May and June 2015 peaks ($61.82- $62.58) and the 50-month moving average (currently at $60.60). If this key resistance area is broken, the way to $65 or even to the level of $70 will be open. - Bearish scenario
If the commodity extends losses the first downside target will be around $54.42-$55.24, where the early 2017 highs are. If this support is broken, the next targets for oil bears will be around: $52.54 (the 38.2% Fibonacci retracement), $52 (the lower border of the black rising trend channel at the moment of writing these words), $50.52 (the 50% retracement and the August 2017 high) or even around $49.10, where the October low is.
Summary
Although crude oil rose to a new 2017 peak slightly above $59 since our previous Oil Investment Update was published, the overall situation hasn’t changed much since then, because the commodity was trading in a fairly narrow price range (less than $ 3) between the early December low of $55.82 and the above-mentioned 2017 peak. This week, light crude approached once again the key resistance zone, but there was no breakout above it. This is a repeat of what we already saw earlier this year and there are no bullish implications of this move. At the same time, our ratios increased to their major resistance areas, giving oil bears even more reasons to act in the following weeks. Additionally, the sell signals generated by the weekly indicators (not only in the case of crude oil, but also in the case of the above-mentioned ratios) remain in cards, supporting oil bears and lower prices of crude oil at the end of the year. Therefore, in our opinion, if oil bulls show their weakness once again just below the resistance zones, we’ll see reversals (in ratios and crude oil) that will cause (at least) a partly realization of the above-mentioned bearish scenario in the following weeks.
This completes this month’s Oil Investment Update. Our next Oil Investment Update is scheduled for Friday, January 8, 2018. Oil Trading Alerts subscribers will additionally receive similar but shorter alerts on a daily basis (or more than once a day when the situation requires it). You – Oil Investment Updates subscribers – will receive short Investment Alert messages should the outlook for the medium or long term change before the next Update is posted.
Thank you.
Nadia Simmons
Forex & Oil Trading Strategist
Oil Investment Updates
Oil Trading Alerts

