

In recent weeks, it was hard to avoid the topic of crude oil, turning on the TV or opening a newspaper. Developments in the Middle East, escalating tensions between Saudi Arabia and Iran, the upcoming meeting of OPEC and non-OPEC ministers as well as the Baker Hughes reports, crude oil and its products inventories were mainly in the interest of investors.
Since our last Oil Investment Update, light crude extended gains and hit fresh 2017 highs. Black gold’s rally, which began in early October, has been mainly driven by growing indications that the crude market was finally starting to rebalance and hopes that the OPEC cuts agreement would be extended beyond March 2018.
Thanks to these circumstances, the price of the commodity almost touched the level of $58, which increased the probability of the test of the barrier of $60 in the previous week. Despite geopolitical tensions, which usually support the price of black gold, light crude stopped its rally after an unexpected increase in crude oil inventories. Additionally, Friday Baker Hughes report showed that the number of oil rigs operating in the U.S. rose by 9 to 738, which was the highest level in almost a month.
And speaking of the drilling activity… As you remember, in May, OPEC producers agreed to extend production cuts until March 2018, but the price of the commodity declined under the barrier of $50. Without a doubt, market participants were disappointed that producers hold the cut at 1.8 million bpd – especially when we take into account the fact that the earlier production-cut deal didn’t bring expected impact on global inventory levels. Why? Such situation was mostly caused by growing U.S. drilling activity. And here the main questions arise: will history repeat itself once again and OPEC won’t cut production cuts? Or maybe the producers learned a lesson from the previous events and this time the organization would satisfy investors? What happened with the number of oil rigs operating in the U.S. since then? They increased from 703 in May to 768 in August. Although we saw “declines” in the following weeks, the last week’s rebound may suggest that the U.S. oil producers are preparing to increase the output levels further at current prices. Therefore, in our opinion, even if the late November OPEC and non-OPEC meeting brings some cuts in output, they will have to be significant to overshadow the U.S. production and discourage the U.S. drillers. Who is good? Who is bad? Who will support crude oil and who will sink it, making wrong decisions?
We can’t be completely sure what the answers to these questions will be as we don’t have a crystal ball, which can predict the future, but we have something else - a series of charts, showing the current situation in black gold and its relationship with other elements of the market: precious metals and stock market, which helped us many times in the past to predict the direction of the next move. So let’s jump right into the charts (charts courtesy of http://stockcharts.com) and try to find out what can we expect in the coming weeks.
Crude Oil
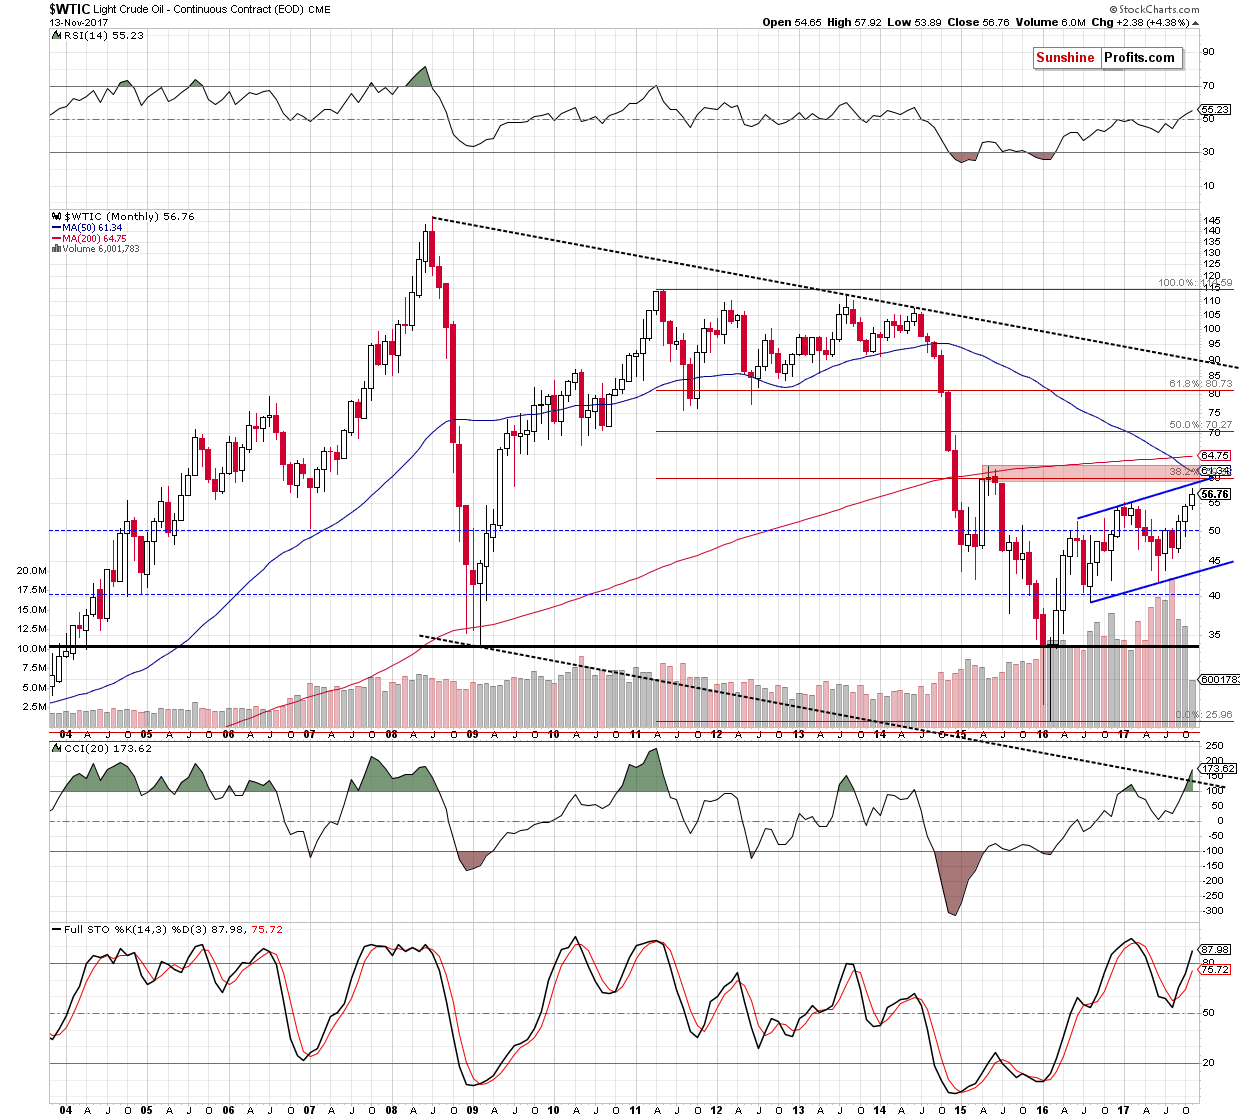
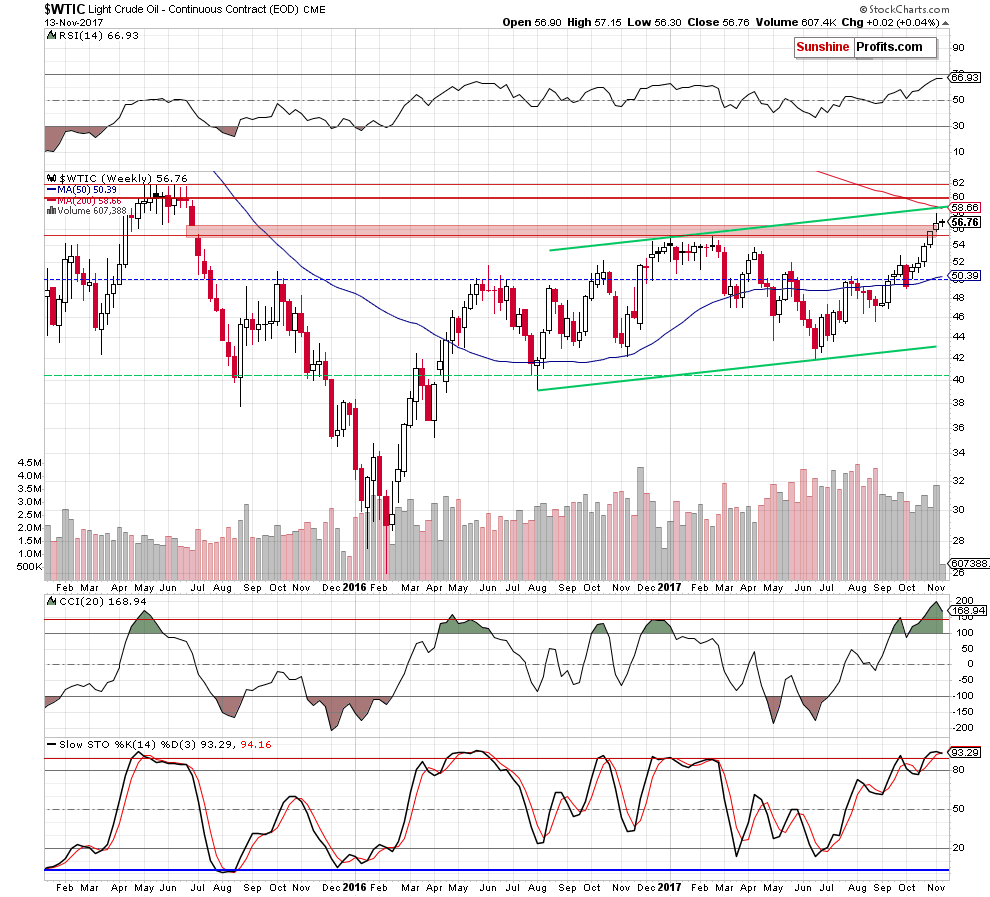
From the monthly and weekly perspective, we see that crude oil extended gains, hit fresh 2017 highs, climbed above the upper border of the red resistance zone and closed the gap in the previous week. The combination of these positive signals suggested that we could see further improvement.
Nevertheless, not far from the last week levels, we noticed the 38.2% Fibonacci retracement, the upper border of the green rising trend channel and the 200-week moving average, which together create a very important resistance zone and block the way to higher levels (in other words, as long as there is no breakout above then, higher prices of crude oil are not likely to be seen).
What’s interesting, we noticed one more interesting fact – the size of the last 3 candlesticks were getting smaller, which suggests that oil bulls were losing their power from week to week. Similar situations we saw in March and April 2017, in September and October 2016, in May 2016. In these previous cases, such smaller bodies of the candlesticks preceded reversals and declines, which increases the probability that history will repeat itself once again and we’ll see lower prices of black gold in the coming weeks.
And speaking about similarities... Before we move to the very short-term chart, we have additional interesting thing for you - take a look at the monthly chart and check the bodies of the last 3 monthly candlesticks... Yes, you're absolutely right - the situation looks almost identical, but in the larger scale. What does it suggest? In our opinion, even if light crude moves a bit higher once again a reversal and bigger declines are just a matter of time.
Having said the above, let’s examine the daily chart.
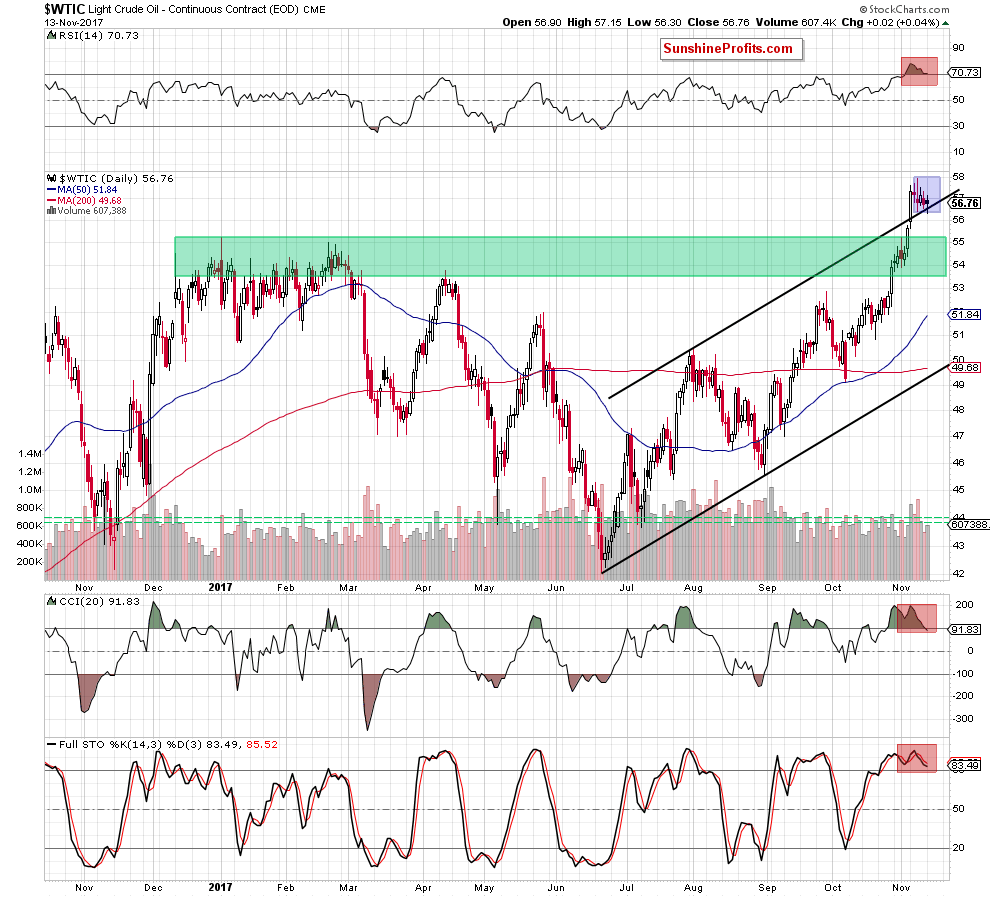
Looking at the daily chart, we clearly see that nothing really happened recently as crude oil wavered around the upper border of the black rising trend channel since almost a week. At this point, someone could say that the commodity invalidated the earlier breakdown under this line yesterday, which was a bullish signal.
But was it really bullish? In our opinion, it wasn’t. Why? Firstly, the shape of the candlestick suggested that the power of the buyers and the sellers was almost equal as the difference between the opening and closing price was only 14 cents. Secondly, the commodity was still trading in the blue consolidation, which meant that as long as there is no breakout above the upper border of the formation another move to the upside is not likely to be seen.
Today’s session showed that the abovementioned assumptions were right, because oil bears pushed black gold quite sharply lower, which resulted in an invalidation of the breakout above the black rising trend channel.
This is a very negative development, which will turn into bearish if the commodity closes today’s session under the above-mentioned line. Is it possible? In our opinion, it is very likely, because the RSI slipped to the level of 70, the CCI and the Stochastic Oscillator generated the sell signals, which together suggests that a bigger move to the downside is just around the corner.
What could happen if we see such price action? We will answer this question after analyzing the current situation in our interesting ratios, which helped us to predict the direction of the next move many times in the past.
So stay with us, try not to scroll to the end of today's Oil Investment Update and let’s check together the relationship between crude oil and gold.
Ratio Analysis
Let’s start this section with the long-term chart of the oil-to-gold ratio.
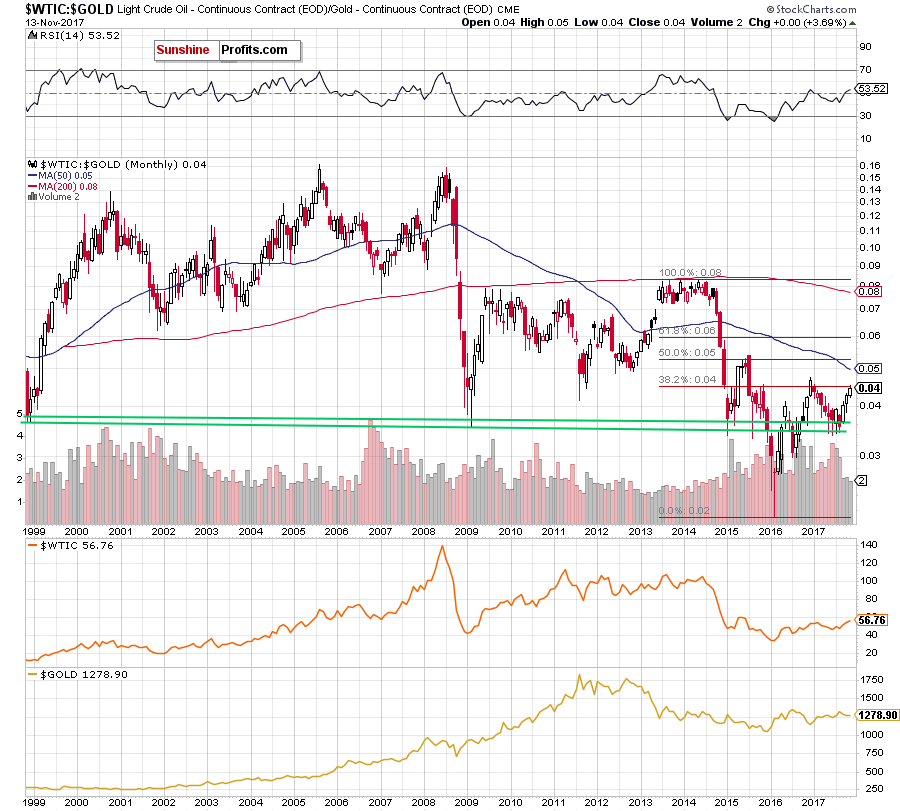
As you see on the above chart, the ratio extended gains, which resulted in a climb to the 38.2% Fibonacci retracement earlier this month. What does it suggests? As you know from our previous updates, this is the first important retracement, which usually is strong enough to stop or (at least) pause bulls. Therefore, the recent price action suggests that we could see a reversal and declines – similarly to what we saw at the beginning of the year.
Additionally, when we focus on the medium-term chart below, we can see some more bearish signs.
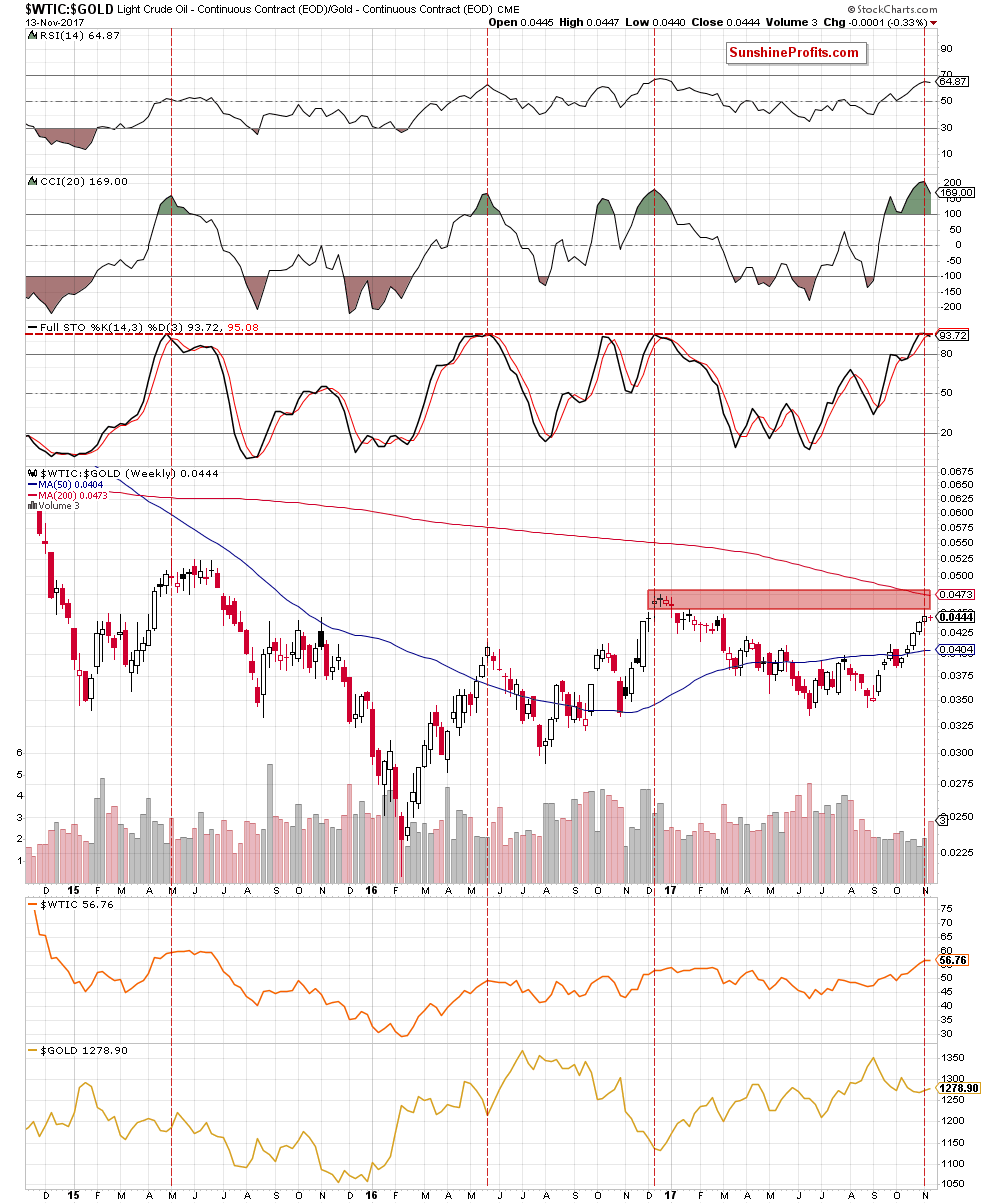
Firstly, similarly to what we wrote in the case of the long-term chart of crude oil itself, recent white candlesticks created in the previous weeks were getting smaller, which suggests that the power of buyers is decreasing and reversal in the near future should not surprise us – especially when we factor in the proximity to the red resistance zone created not only by the above-mentioned Fibonacci retracement, but also by the January highs.
Additionally, the Stochastic Oscillator generated the sell signal, giving the bears another reason to act. Since we are already here with this indicator, we would like to draw your attention to several similar situations to the current one. As you see on the above chart, there are red dashed horizontal and vertical lines marked on the indicator, which point to its highest levels since May 2015. What’s interesting in all these cases such high readings of the indicator preceded bigger moves to the downside. Therefore, in our opinion, the probability that we’ll see reversal and declines in not far future is very likely – especially when we factor in the fact that there are similar regularities on the weekly chart of the oil-to-silver ratio below.
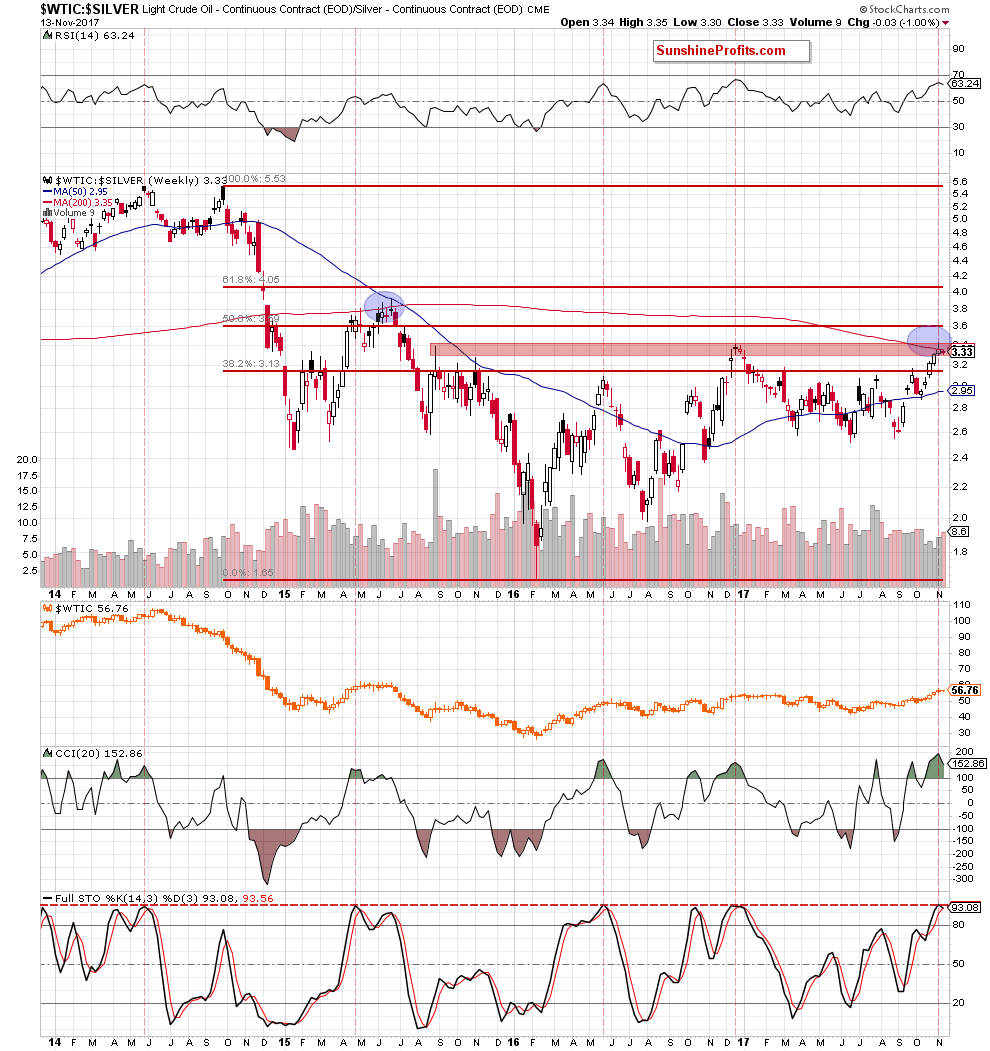
From this perspective, we can also see that the ratio increased to very important zone marked with red and created by the August 2015 high and December 2016 peaks. Additionally, this area is reinforced by the 200-week moving average, which helped bears stop their opponents in June 2015 (we marked both situations with blue).
Are there any other negative signs on the above chart? Yes, you’re right - the Stochastic Oscillator also generated the sell signal.
Once we already know what the relationship between oil and precious metals looks like, let’s check the oil – general market link.
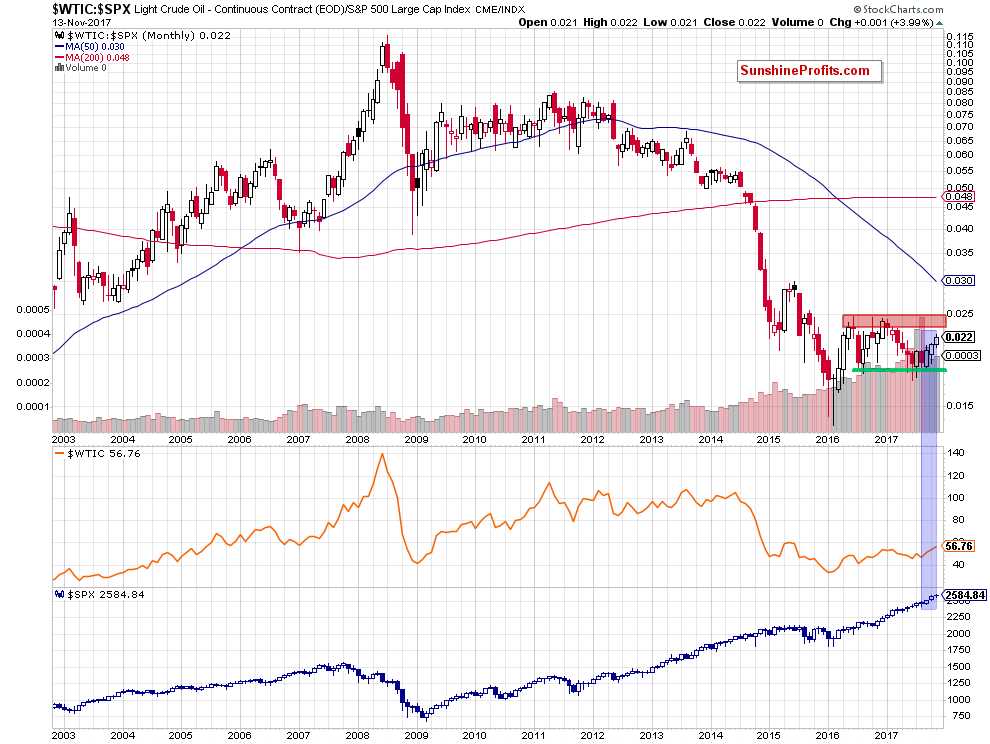
The long-term picture does not give us too many clues about future movements as the ratio remains between the red resistance zone (created by the 2016 and 2017 highs) and the green support area. Nevertheless, the size of the recent candlesticks can be disappointing for many bulls as they getting smaller. Although this month candlestick is not finished yet, we have to unanimously admit that October candlestick was smaller than the previous one, which raises some doubts about the strength of the upward move.
Will the medium-chart be more useful and abundant in the tips on future moves? Lets check.
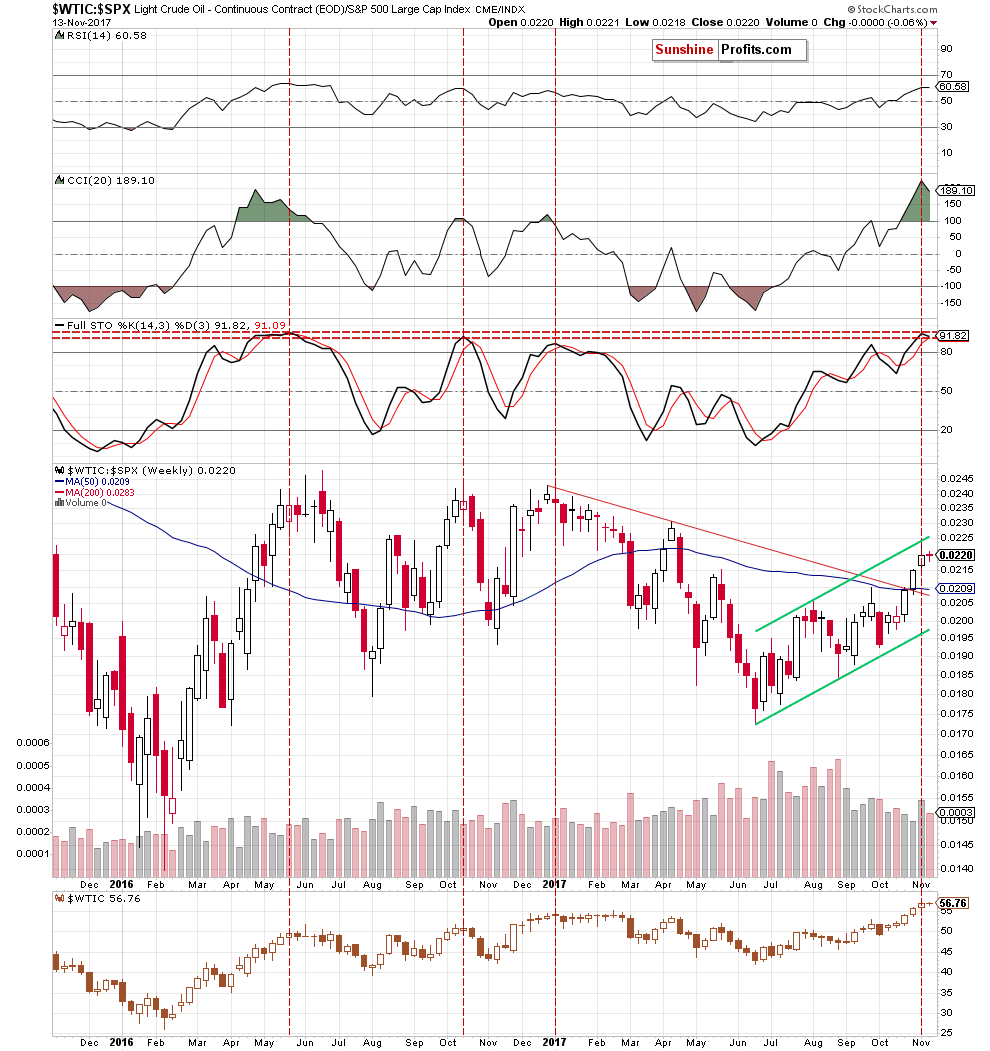
The first things that probably caught your eye were white candlesticks created in the previous weeks. Nevertheless, we would also like to point out that the ratio increased to the upper border of the green rising trend channel in the previous week and then pulled back a bit. This suggests that the bulls will have to break above this resistance line before they open the way to higher levels. Will they succeed? The current position of the CCI and the Stochastic Oscillator favors the bears and lower values of the ratio in the following weeks.
Let's summarize what we have checked so far ... the oil-to-gold ratio – checked, the oil-to-silver – checked, the oil-to-stock ratio – checked. Didn’t we forget about something? Yes you are right once again - we didn’t check the relationship between crude oil and oil stocks.
Let's do it right away and examine the weekly chart of the oil-to-oil stocks ratio below.
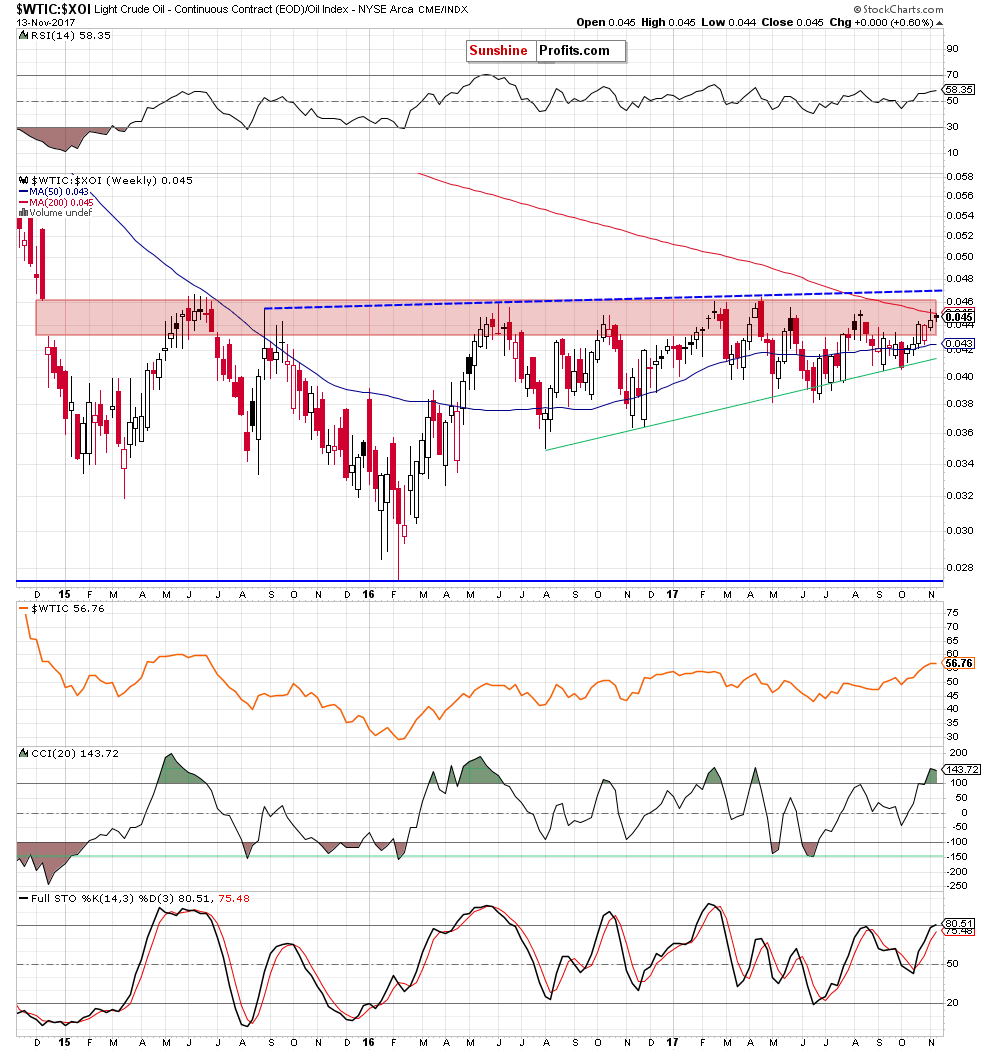
On the medium-term chart, we see that although the ratio moved higher in the previous weeks, the combination of the key red resistance zone and the 200-week moving average stopped oil bulls, triggering a small pullback.
What’s next? Although the moving average may not stop further increases, we clearly see that in all previous similar situations, the upper border of the red resistance zone (the upper border of the 2014 gap) was strong enough to stop rallies (in June, August 2015, in June October 2016 and also in February, April, May and August 2017). Therefore, in our opinion, another reversal and further declines are just around the corner. If this is the case and the ratio extends losses, the initial downside target for the bears will be around 0.043, where the 50-week moving average is.
What does it mean for crude oil? You will know just after the analysis of oil stocks, which will end our November Oil Investment Update.
Oil Stocks
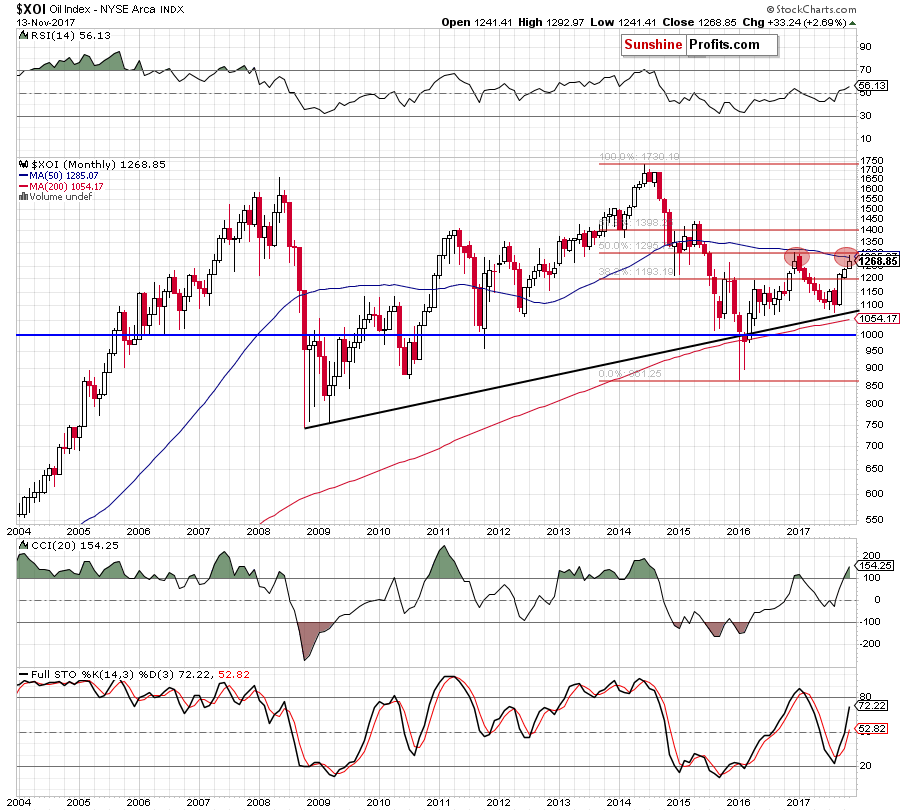
Looking at the long-term chart of oil stocks, we see that the XOI index increased and climbed to the important resistance zone created by the 38.2% Fibonacci retracement and the 50-month moving average earlier this month. As you see, we had similar situation in December 2016.
Back then, the combination of these resistances was strong enough to stop bulls and trigger a significant downward move in the following months. Taking into account these similarities, we think that history may repeat itself here and we’ll see lower prices of oil stocks in the coming month(s).
Will the medium-term chart give oil bears more reasons to act? Let’s check.
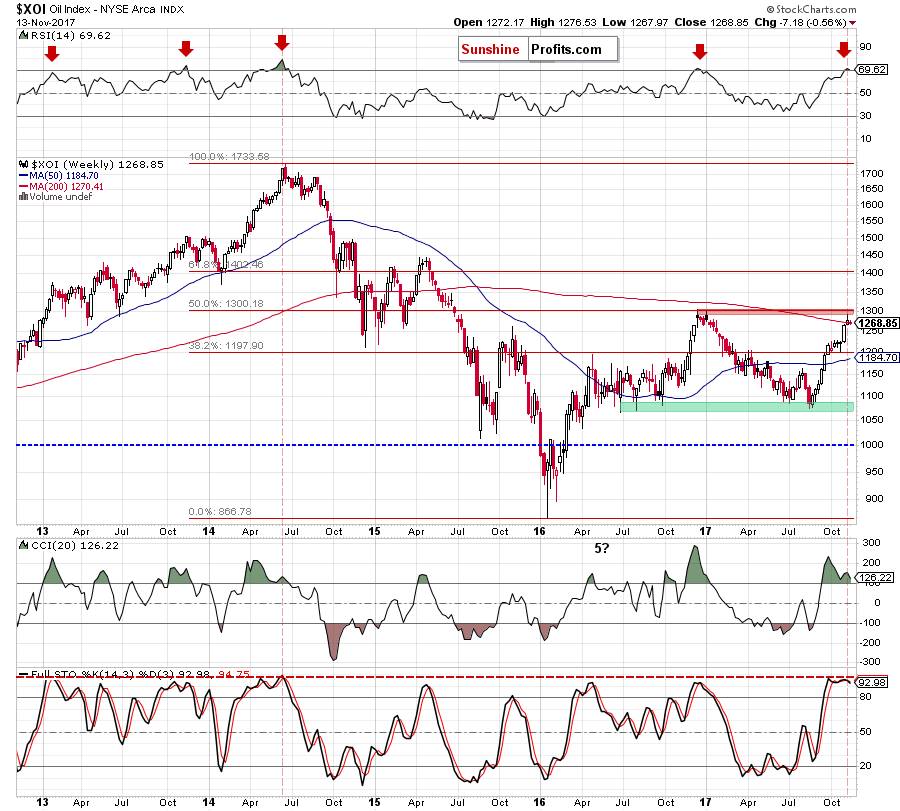
From this perspective, we see that the RSI generated the sell signal – similarly to what we saw in June 2014 and December 2016.In both these cases, they were one of the first signs of a change in trend and preceded significant declines. Additionally, there are negative divergences between the XOI and the CCI, which together with the sell signal generated by the Stochastic Oscillator increases the probability of a bigger move to the downside in the coming weeks.
How low could oil stocks go? We think that the daily chart give us the best answer to this question.
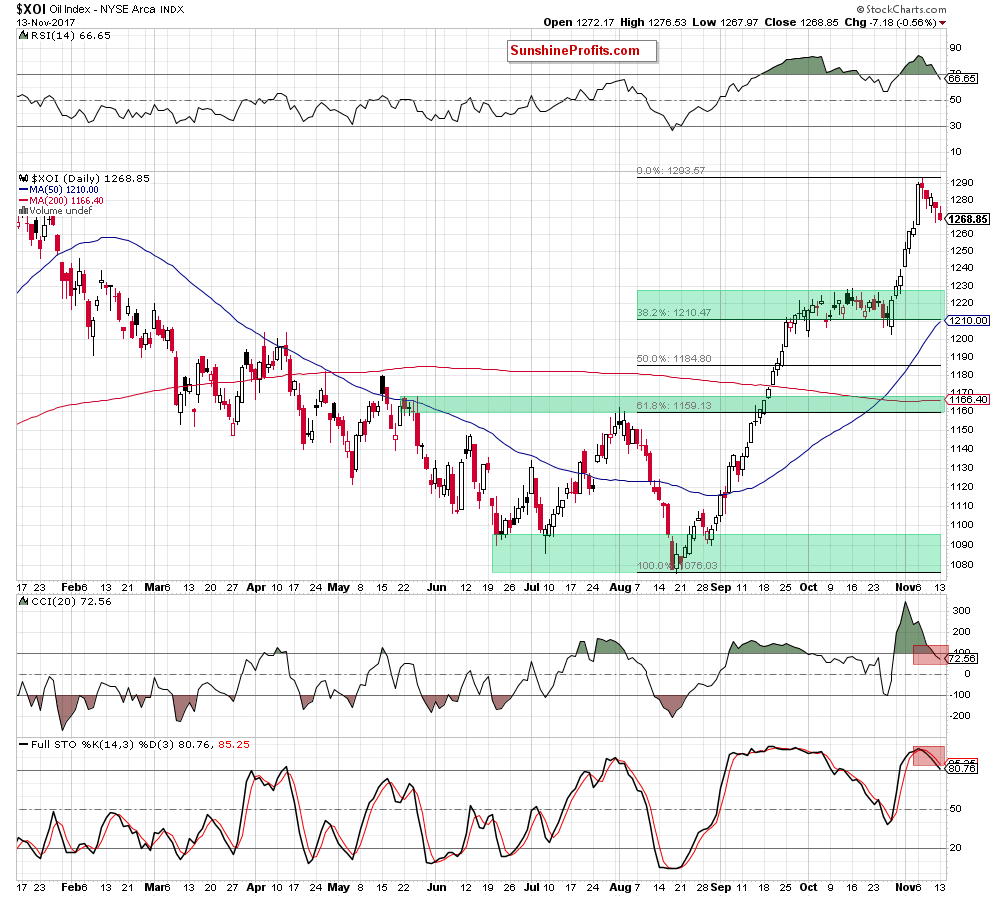
On the above chart, we see that if the XOI extends declines from current levels, the initial downside target for oil bears will be the first green support zone (around 1,210-1,228) created by the 38.2% Fibonacci retracement and the mid-October highs. If it is broken, we may see a test of the 50% retracement or even a comeback to the August high, which is also reinforced by the 61.8% Fibonacci retracement (the second green support zone).
Scenarios
Just like a month ago, today’s Oil Investment Update includes scenarios of what could happen in the coming weeks. Naturally, we will continue to monitor the market in the coming days and if anything invalidates our long-term outlook we will send you an additional message.
- Bullish scenario
If crude oil increases and breaks above the upper border of the blue consolidation seen on the daily chart (the 2017 peak), we may see an increase to the next resistance zone created by the 38.2% Fibonacci retracement, the upper border of the green rising trend channel and the 200-week moving average (around $58.66-$60.05). If these important resistances are broken, the next targets for oil bulls will be: the May 2015 high of $62.58, the 200-month moving average at $64.75 (at the moment of writing these words) and the 50% Fibonacci retracement together with the level of $70. - Bearish scenario
If the commodity extends losses the first downside target will be around $54.42-$55.24, where the early 2017 highs are. If this support is broken, the next targets for oil bears will be around: $52 (the late May and late September highs), $49.50 (the lower border of the black rising trend channel at the moment of writing these words), the October low of $49.10.
Summary
Let's combine all the elements that we analyzed in the preceding paragraphs. Firstly, crude oil approached the very important zone created by the 38.2% Fibonacci retracement, the upper border of the green rising trend channel and the 200-week moving average. Secondly, oil bears pushed the commodity lower earlier today which will likely translate into invalidation of the breakout above the upper border of the black rising trend channel seen on the daily chart (if we see such price action, it will be a bearish development). Thirdly, the weekly and daily indicators generated the sell signals, giving oil bears another reason to act. Fourthly, candlesticks created in the previous weeks are getting smaller, increasing the probability of the reversal and another move to the downside. Last but not least, the Stochastic Oscillator (in the case of oil-to-gold, oil-to-silver and oil-to-stocks ratios) increased to the levels, which preceded reversals and declines many times in the past. What does it mean for crude oil? As you know from our previous updates, there are positive correlation between the above-mentioned ratios and crude oil which means that if they reverse and decline, it will likely translate into lower prices of crude oil in the coming week(s) – similarly to what we saw in the previous months. Connecting the dots, the technical picture of crude oil and ratios suggests that reversal and lower prices of black gold are just ahead of us and we‘ll see (at least) a partly realization of the above-mentioned scenario in the following weeks.
This completes this month’s Oil Investment Update. Our next Oil Investment Update is scheduled for the beginning of December 2017. Oil Trading Alerts subscribers will additionally receive similar but shorter alerts on a daily basis (or more than once a day when the situation requires it). You – Oil Investment Updates subscribers – will receive short Investment Alert messages should the outlook for the medium or long term change before the next Update is posted.
Thank you.
Nadia Simmons
Forex & Oil Trading Strategist
Oil Investment Updates
Oil Trading Alerts

