

Briefly: in our opinion, full (300% of the regular position size) speculative short positions in mining stocks are justified from the risk/reward point of view at the moment of publishing this Alert.
The Fed has decided, and the Fed has spoken. And the markets have reacted in tune with their previous trends. In other words, the bearish outlook for the PMs remains very much intact.
Here’s the key chart for us, in light of the profitable short position in the miners that we have. While our short position is in the junior miners, it is the GDX ETF that is more important, as its actions are observed by more market participants.
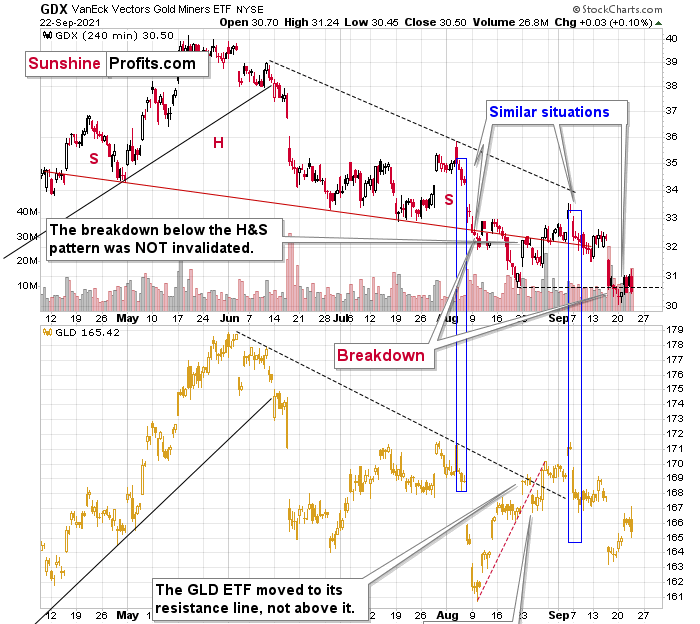
The GDX ETF confirmed the breakdown to new 2021 lows, and it did so after trying to rally. This makes the most recent price action even more similar to what we saw in mid-August after the previous breakdown.
The situation was already extremely bearish previously, but it’s getting ridiculously bearish now.
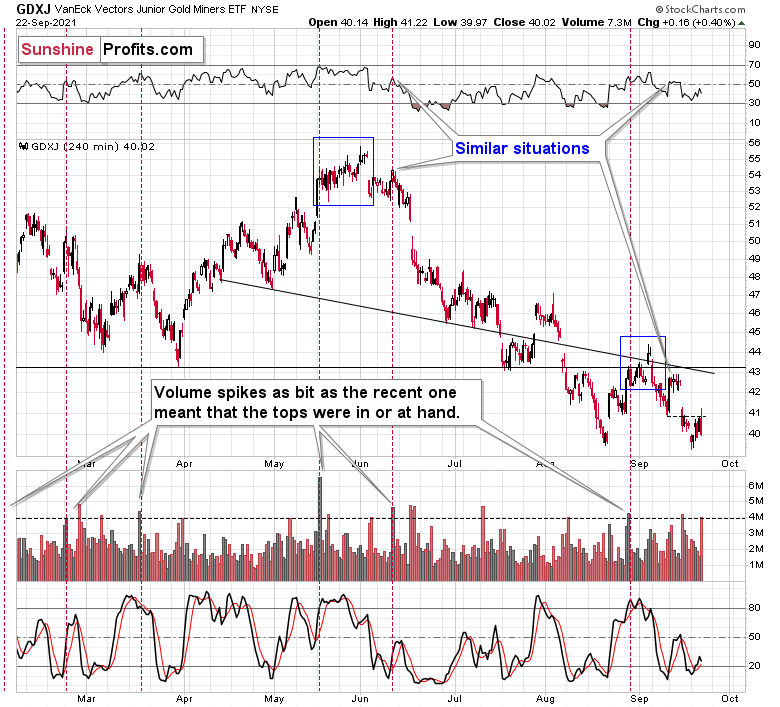
The GDXJ ETF also continued to move back and for the below the previous September lows. Despite the intraday attempt to move higher, it ended the session mere $0.16 higher.
So, nothing really changed – the outlook for the miners remains clearly bearish.
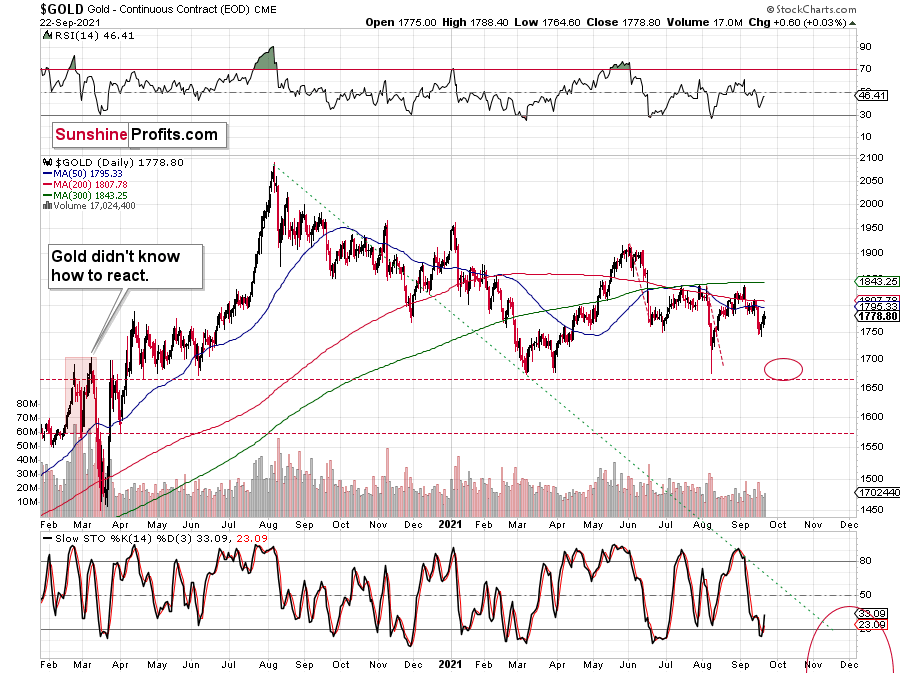
Gold ended yesterday’s session relatively unchanged, so practically everything that I described in yesterday’s video commentary remains up-to-date. If you haven’t had the chance to watch it so far, I encourage you to do so today, tomorrow, or over the weekend.
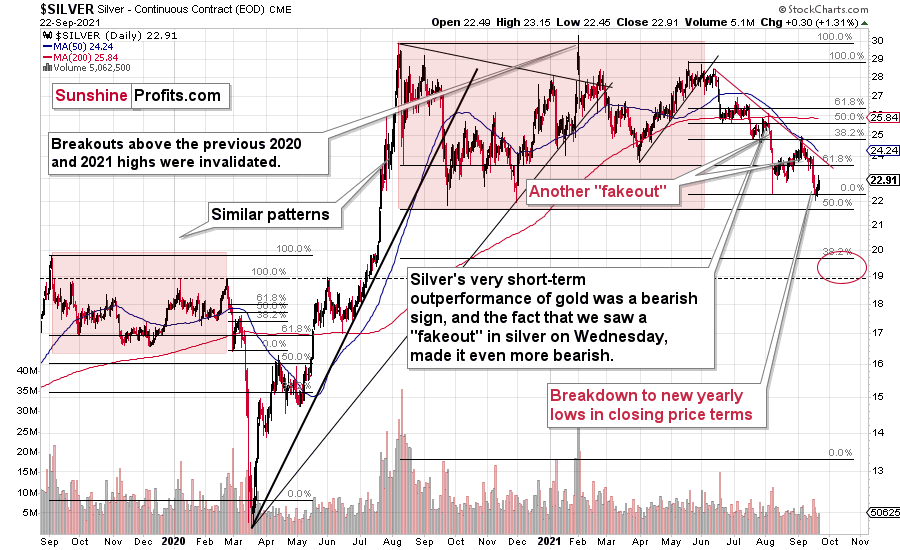
Despite yesterday’s $0.30 rally, silver didn’t invalidate its previous breakdown to new yearly lows, so the outlook remains clearly bearish also from this point of view.
The USD Index moved higher yesterday, and the precious metals sector didn’t decline, which might be viewed as a sign of strength of the latter, but I don’t see it in this way. Why? Because yesterday’s session was an exception from the rule due to the importance of the news that accompanied it – Fed’s decisions and comments. These days tend to be rich in sudden price swings in all directions as investors and traders try to guess what the news is going to be and then they are unsure how to react to the news when it finally hits the market. Consequently, yesterday’s lack of declines in the PMs is not a sign of their strength – it was likely a more-or-less random kind of reaction. If we see more of that, the implications might change, but that’s not the case right now.
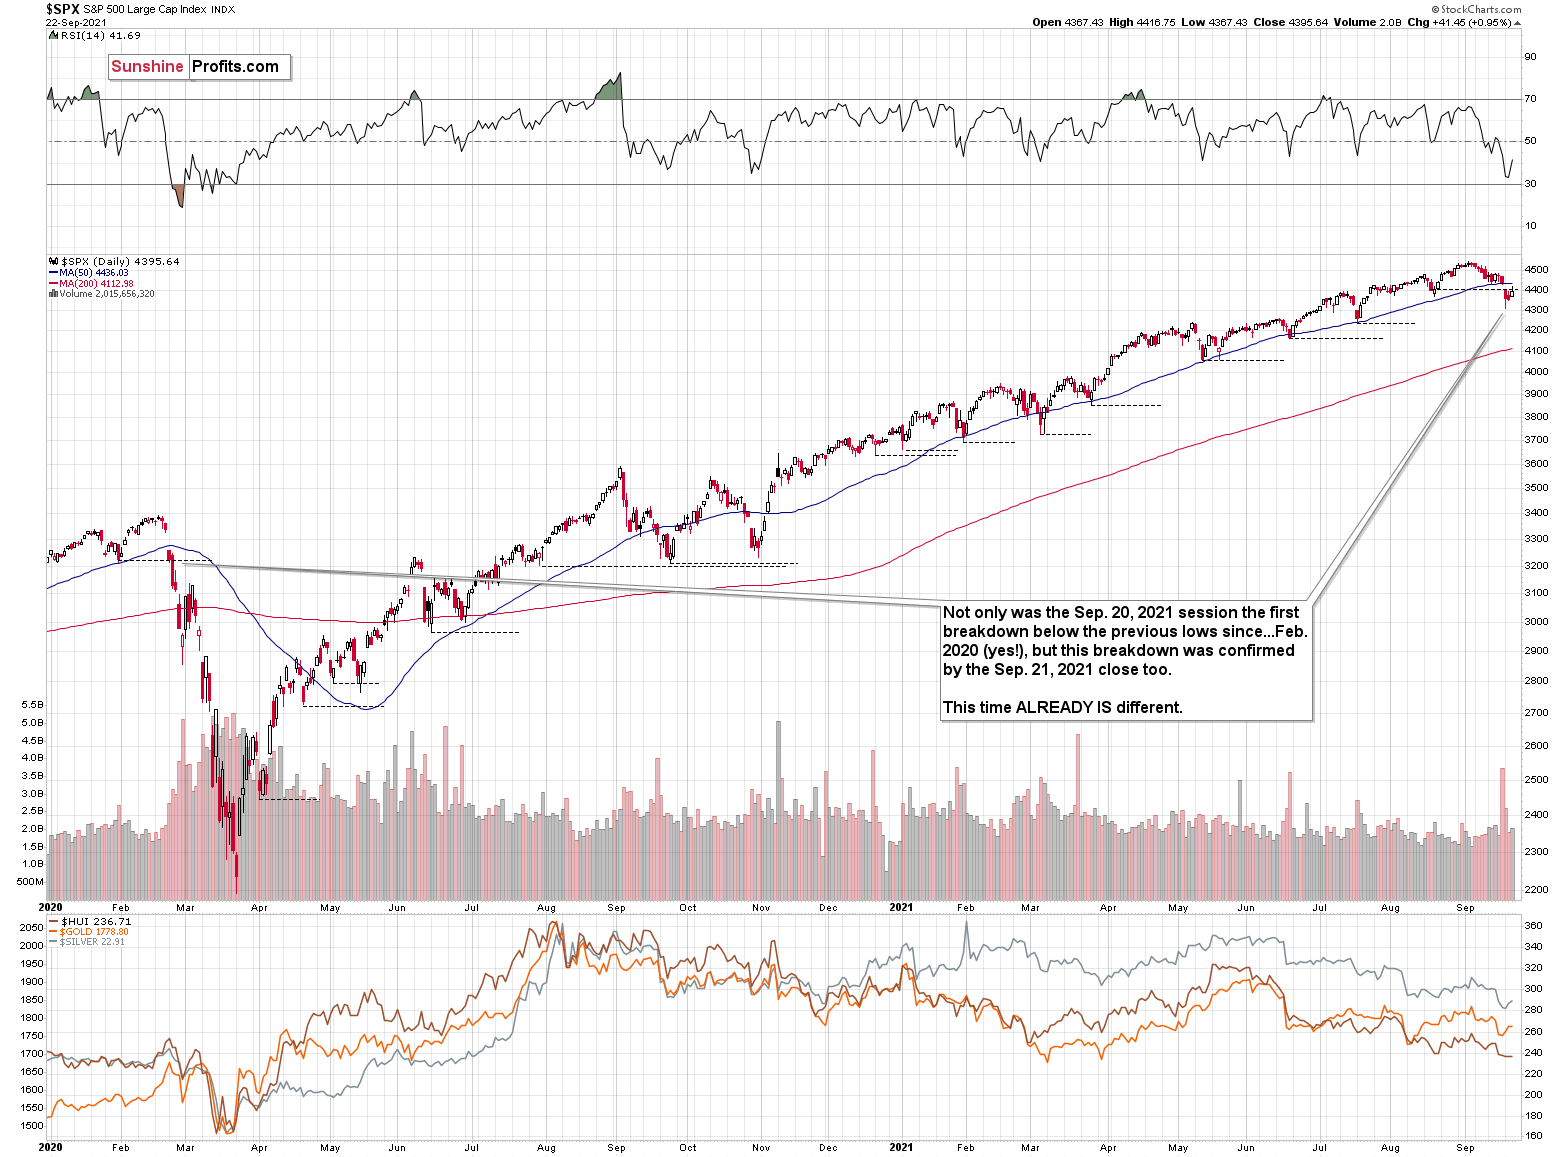
Finally, while the S&P 500 moved above the mid-August lows in intraday terms, please note that yesterday was the third consecutive close below the mid-August bottom in closing price terms. This means that from this point of view, the breakdown was confirmed. The S&P 500 futures are higher in today’s pre-market trading, but they are just a few index points above the mid-August lows (closing prices), so it’s too early to say that the breakdown was invalidated – we would need to see a close above those lows (4,400.27) to say that
Summing up, the outlook for the next few months for the precious metals sector remains very bearish.
Having said that, let’s move to the fundamental part of today’s analysis.
You Don’t Say, Jay
With Jerome Powell, Chairman of the Fed, sounding more hawkish on Sep. 22 than many market participants expected, the central bank chief officially gave investors “advanced notice.” And because the devil is in the details, the Fed’s summary of economic projections let the cat out of the bag. For context, the Fed released its economic outlook at 2 p.m. ET. But because the algorithms focus on headlines (they don’t read reports), the initial response was ‘PMs up, USD Index down.’ However, the mood music materially changed during Powell’s press conference.
To begin, the FOMC increased its 2021 Personal Consumption Expenditures (PCE) Index projection from a 2.4% year-over-year (YoY) rise to a 3.4% YoY rise in June. At the time, I wrote: even more revealing, the original projection was made only three months ago. Thus, the about-face screams of inflationary anxiety.
Please see below:
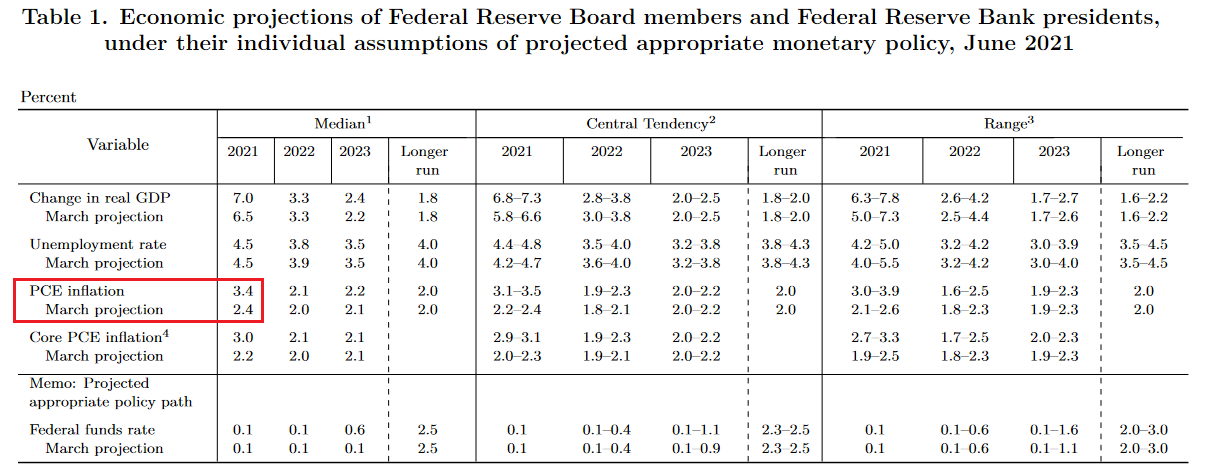 Source: U.S. Fed
However, while I’ve been warning for months that Powell remains materially behind the inflation curve, the FOMC increased its 2021 PCE Index projection from 3.4% YoY to 4.2% YoY and increased its 2022 projection by 10 basis points (0.10%) on Sep. 22. For context, the committee also reduced its 2021 real GDP growth forecast and increased its 2021 U.S. unemployment rate forecast (stagflation anyone?).
Please see below:
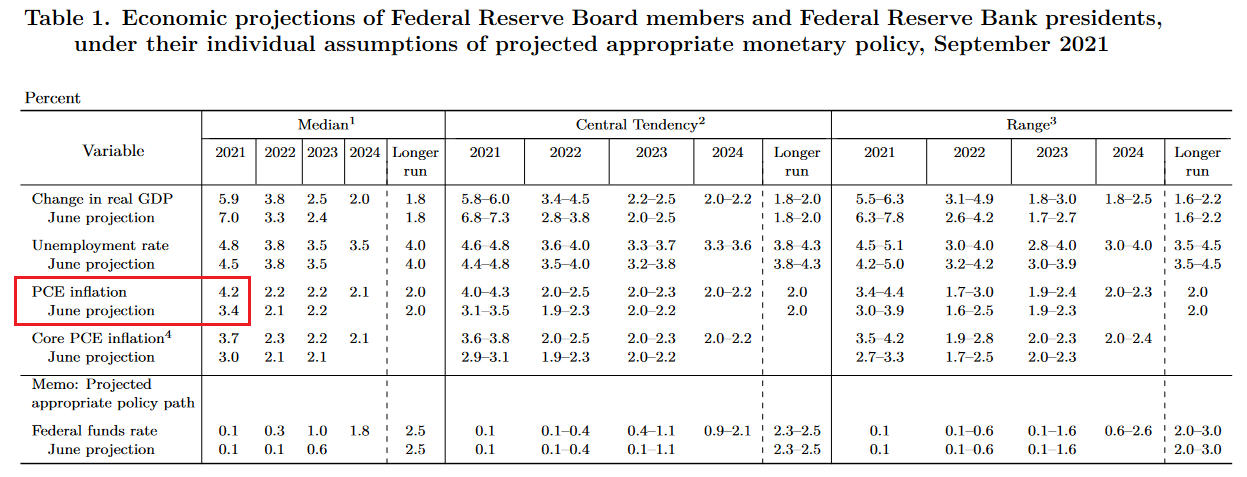 Source: U.S. Fed
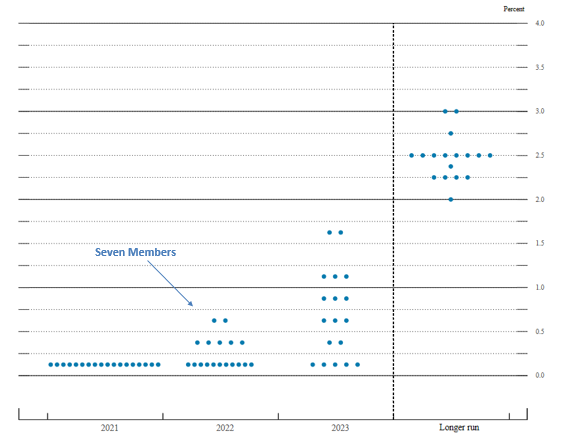
What’s more, the FOMC’s June ‘dot plot’ had seven FOMC participants signaling at least one rate hike in 2022 and 13 FOMC participants signaling at least one rate hike in 2023. For context, there are 18 participants in total.
Please see below:
 Source: U.S. Fed
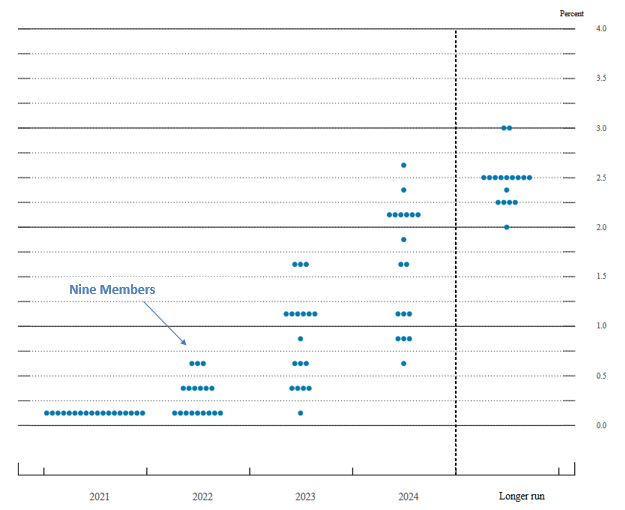
Conversely, the FOMC’s September ‘dot plot’ has nine FOMC participants signaling at least one rate hike in 2022 and 17 FOMC participants signaling at least one rate hike in 2023.
Please see below:
 Source: U.S. Fed
To explain, the vertical scale on the right side of the chart represents the U.S. federal funds rate and the blue dots depict Fed officials’ projections for the rate and when they will likely materialize. If you analyze the arrow near the left side of the chart, you can see that nine members expect the U.S. federal funds rate to range between roughly 0.25% and 0.75% in 2022. In addition, 17 Fed officials expect the U.S. federal funds rate to range between roughly 0.25% and 1.75% in 2023. Thus, surging inflation has the FOMC increasingly hawked up.
Look at All These Hawks!
Furthermore, while the FOMC’s press release was quite vague (hence, ‘PMs up, USD Index down’), Powell stepped up the hawkish rhetoric during his press conference. For context, the initial statement read:
“Last December, the Committee indicated that it would continue to increase its holdings of Treasury securities by at least $80 billion per month and of agency mortgage‑backed securities by at least $40 billion per month until substantial further progress has been made toward its maximum employment and price stability goals. Since then, the economy has made progress toward these goals. If progress continues broadly as expected, the Committee judges that a moderation in the pace of asset purchases may soon be warranted. These asset purchases help foster smooth market functioning and accommodative financial conditions, thereby supporting the flow of credit to households and businesses.”
However, acknowledging the data outlined in the summary of economic projections, Powell admitted that inflation is “well ahead” of what’s considered “substantial further progress” and when asked about the labor market’s impact on his taper timeline, he said:
“For me it wouldn’t take a knockout, great, super-strong employment report. It would take a reasonably good employment report for me to feel like that test is met. Others on the committee, many on the committee, feel the test is already met. Others want to see more progress.”
More importantly, though, he added:
“Many on the committee feel that substantial further progress test for employment has been met... I guess my own view is the test for substantial further progress on employment is all but met.”
Above all else, though, the most important takeaway from Powell’s press conference was his belief that the taper could conclude by the middle of 2022. He said:
“Participants generally view, so long as the recovery remains on track, a gradual tapering process that concludes around the middle of next year is likely to be appropriate.”
Gradual? For context, there is nothing gradual about that taper timeline. With ~$120 billion worth of bond purchases poised to hit zero in roughly nine months, the accelerated liquidity drain is extremely bullish for the USD Index.
Please see below:
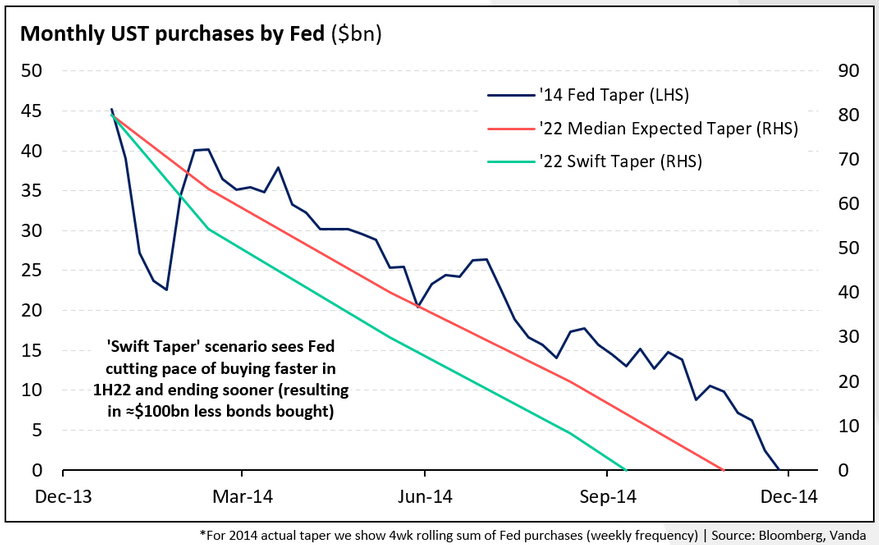
To explain, the dark blue line above tracks the pace of the Fed’s taper following its announcement in December 2013, while the orange line above tracks the consensus estimate this time around. However, if you focus your attention on the light blue line, you can see that Powell’s taper timeline pushes QE to zero in advance of both the precedent set in 2014 and the current consensus estimate. Thus, the man at the top is now leading the charge rather than resisting it.
When Will I See You Again, My European Friend?
On top of that, while I’ve written on several occasions that the Fed and the European Central Bank (ECB) are worlds apart, their relative hawkishness (or lack thereof) remains extremely important. With the EUR/USD accounting for nearly 58% of the movement of the USD Index, the performance of the former materially impacts the performance of the latter. And with the ECB revealing during its monetary policy meeting on Sep. 9 that net APP purchases will still be reinvested “for an extended period of time past the date when [the ECB] starts raising the key ECB interest rates, and in any case for as long as necessary to maintain favorable liquidity conditions and an ample degree of monetary accommodation,” the diverging monetary paths should pressure the FED/ECB ratio, and in turn, pressure the EUR/USD.
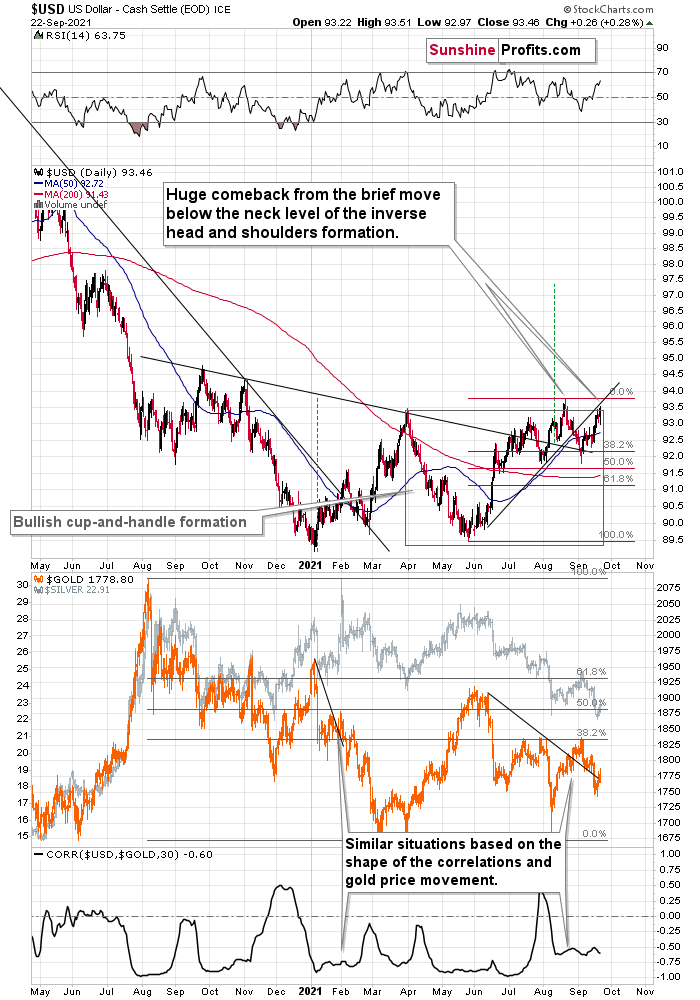
Likewise, while the EUR/USD sunk below 1.1700 as the drama unfolded on Sep. 22, the USD Index and gold headed in opposite directions.
Please see below:
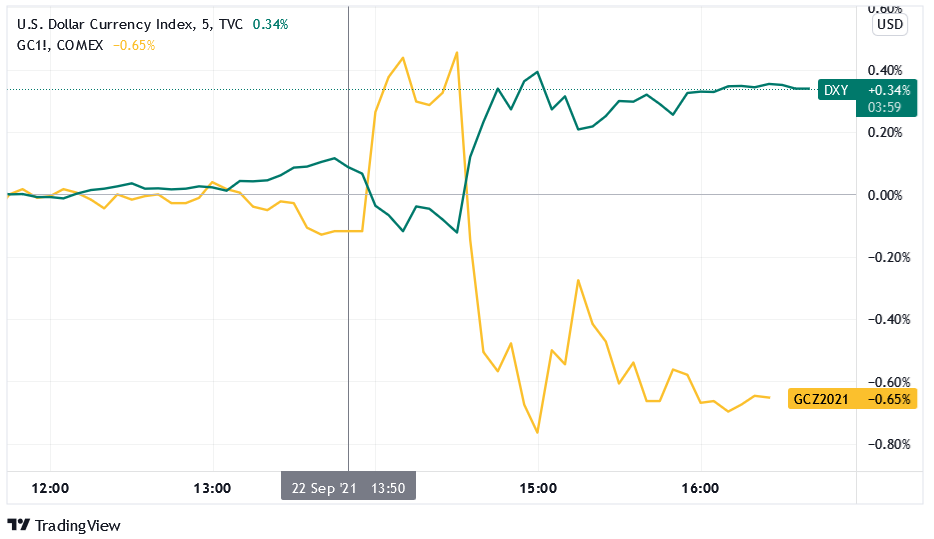
To explain, the gold line above tracks the gold futures price, while the green line above tracks the USD Index. If you analyze the middle of the chart, you can see that gold initially spiked at 2 p.m. ET after the FOMC released its monetary policy statement. However, with the algorithms buying headlines and not reading the FOMC’s summary of economic projections, the optimism was short-lived and reality re-emerged at 2:30 p.m. ET once Powell verbalized the report.
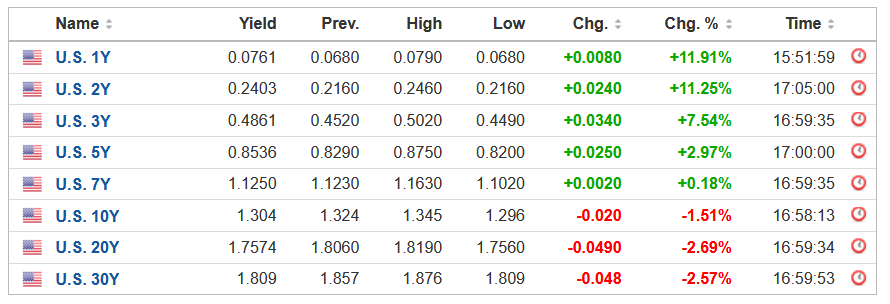
Finally, while the song and dance along the U.S. Treasury curve played out once again – with the short-end surging and the long-end falling – the bond market’s long-term economic pessimism was on full display.
For context, I wrote on Aug. 17:
With the U.S. 10-Year Treasury yield weighed down by rational skepticism – the Fed’s liquidity drain, taper timeline and the Delta variant have depressed economic sentiment. As a result, the U.S. economy will have to prove its long-term durability and bond investors will not give it the benefit of the doubt. However, while the impact of the Delta variant remains real, it’s likely another bump in the road. As a result, the mosaic of fundamentals implies a medium-term target for the U.S. 10-Year Treasury yield of 1.75%.
Please see below:
 Source: Investing.com
However, while rising short-term interest rates are just as damaging to the PMs’ performance, if Powell’s taper timeline comes to fruition, the elephant’s bid underwriting lower long-term interest rates could test investors’ mettle in the coming months.
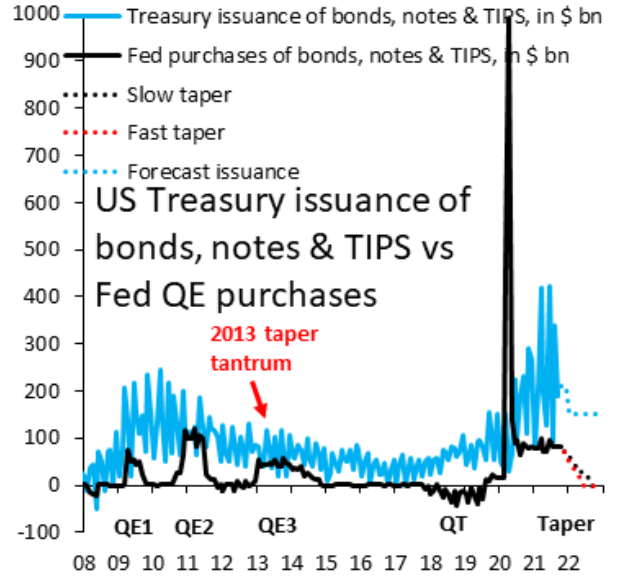 Source: IIF/Robin Brooks
To explain, the black line above tracks the Fed’s QE purchases, while the blue line above tracks Treasury issuances by the U.S. federal government. If you analyze the red and blue dotted lines on the right side of the chart, you can see that if Powell’s taper timeline materializes, it will result in the largest gap between U.S. Treasury issuances and QE purchases of all time. As a result, bond investors’ mantra of ‘don’t fight the Fed’ could have the opposite effect in 2022.
In conclusion, the PMs’ performance was mixed on Sep. 22, while the USD Index further validated its bullish breakout. And with Powell obliterating the dovish narrative along the way, a taper that concludes in mid-2022 is profoundly bearish for the PMs. As a result, their medium-term outlooks remain quite treacherous, and the PMs should confront lower lows in the coming months.
Overview of the Upcoming Part of the Decline
- It seems to me that the corrective upswing in gold is over, and the big decline seems to be already underway.
- It seems that the first stop for gold will be close to its previous 2021 lows, slightly below $1,700. Then it will likely correct a bit, but it’s unclear if I want to exit or reverse the current short position based on that – it depends on the number and the nature of the bullish indications that we get at that time.
- After the above-mentioned correction, we’re likely to see a powerful slide, perhaps close to the 2020 low ($1,450 - $1,500).
- If we see a situation where miners slide in a meaningful and volatile way while silver doesn’t (it just declines moderately), I plan to switch from short positions in miners to short positions in silver. At this time, it’s too early to say at what price levels this could take place, and if we get this kind of opportunity at all – perhaps with gold close to $1,600.
- I plan to exit all remaining short positions when gold shows substantial strength relative to the USD Index while the latter is still rallying. This might take place with gold close to $1,350 - $1,400. I expect silver to fall the hardest in the final part of the move. This moment (when gold performs very strongly against the rallying USD and miners are strong relative to gold after its substantial decline) is likely to be the best entry point for long-term investments, in my view. This might also happen with gold close to $1,375, but it’s too early to say with certainty at this time. I expect the final bottom to take place near the end of the year, perhaps in mid-December.
- As a confirmation for the above, I will use the (upcoming or perhaps we have already seen it?) top in the general stock market as the starting point for the three-month countdown. The reason is that after the 1929 top, gold miners declined for about three months after the general stock market started to slide. We also saw some confirmations of this theory based on the analogy to 2008. All in all, the precious metals sector is likely to bottom about three months after the general stock market tops.
- The above is based on the information available today, and it might change in the following days/weeks.
You will find my general overview of the outlook for gold on the chart below:
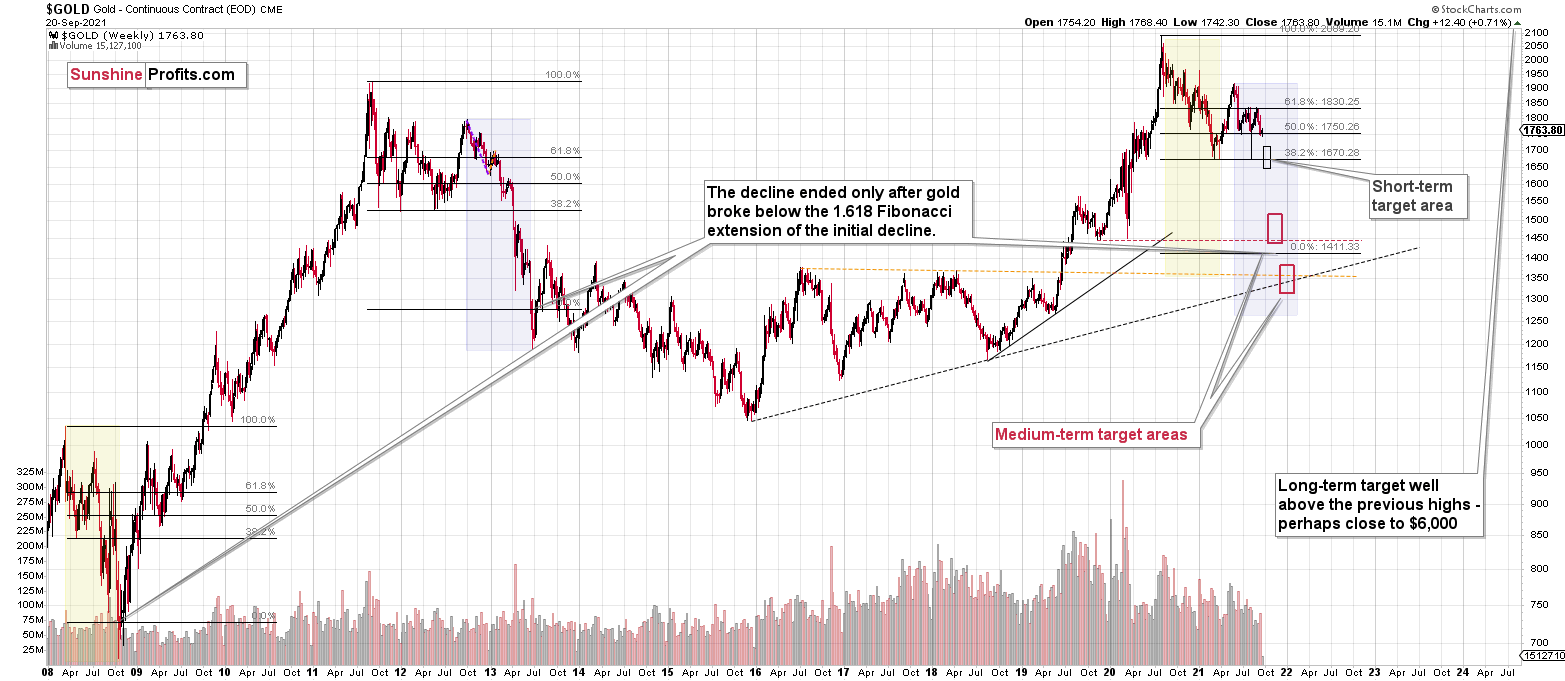
Please note that the above timing details are relatively broad and “for general overview only” – so that you know more or less what I think and how volatile I think the moves are likely to be – on an approximate basis. These time targets are not binding or clear enough for me to think that they should be used for purchasing options, warrants or similar instruments.
Summary
To summarize, the outlook for the precious metals sector remains extremely bearish for the next few months.
The decline to new lows in the GDX and silver as well as strength that we saw in the USD Index were important short-term confirmations for the bearish case, but the key two long-term factors remain the analogy to 2013 in gold and the broad head and shoulders pattern in the HUI Index. They both suggest much lower prices ahead.
It seems that our profits from the short positions are going to become truly epic in the following weeks.
After the sell-off (that takes gold to about $1,350 - $1,500), I expect the precious metals to rally significantly. The final part of the decline might take as little as 1-5 weeks, so it's important to stay alert to any changes.
Most importantly, please stay healthy and safe. We made a lot of money last March and this March, and it seems that we’re about to make much more on the upcoming decline, but you have to be healthy to enjoy the results.
As always, we'll keep you - our subscribers - informed.
By the way, we’re currently providing you with the possibility to extend your subscription by a year, two years or even three years with a special 20% discount. This discount can be applied right away, without the need to wait for your next renewal – if you choose to secure your premium access and complete the payment upfront. The boring time in the PMs is definitely over, and the time to pay close attention to the market is here. Naturally, it’s your capital, and the choice is up to you, but it seems that it might be a good idea to secure more premium access now while saving 20% at the same time. Our support team will be happy to assist you in the above-described upgrade at preferential terms – if you’d like to proceed, please contact us.
To summarize:
Trading capital (supplementary part of the portfolio; our opinion): Full speculative short positions (300% of the full position) in mining stocks are justified from the risk to reward point of view with the following binding exit profit-take price levels:
Mining stocks (price levels for the GDXJ ETF): binding profit-take exit price: $35.73; stop-loss: none (the volatility is too big to justify a stop-loss order in case of this particular trade)
Alternatively, if one seeks leverage, we’re providing the binding profit-take levels for the JDST (2x leveraged) and GDXD (3x leveraged – which is not suggested for most traders/investors due to the significant leverage). The binding profit-take level for the JDST: $16.96; stop-loss for the JDST: none (the volatility is too big to justify a SL order in case of this particular trade); binding profit-take level for the GDXD: $35.46; stop-loss for the GDXD: none (the volatility is too big to justify a SL order in case of this particular trade).
For-your-information targets (our opinion; we continue to think that mining stocks are the preferred way of taking advantage of the upcoming price move, but if for whatever reason one wants / has to use silver or gold for this trade, we are providing the details anyway.):
Silver futures upside profit-take exit price: unclear at this time - initially, it might be a good idea to exit, when gold moves to $1,683
Gold futures upside profit-take exit price: $1,683
HGD.TO – alternative (Canadian) inverse 2x leveraged gold stocks ETF – the upside profit-take exit price: $11.38
Long-term capital (core part of the portfolio; our opinion): No positions (in other words: cash
Insurance capital (core part of the portfolio; our opinion): Full position
Whether you already subscribed or not, we encourage you to find out how to make the most of our alerts and read our replies to the most common alert-and-gold-trading-related-questions.
Please note that we describe the situation for the day that the alert is posted in the trading section. In other words, if we are writing about a speculative position, it means that it is up-to-date on the day it was posted. We are also featuring the initial target prices to decide whether keeping a position on a given day is in tune with your approach (some moves are too small for medium-term traders, and some might appear too big for day-traders).
Additionally, you might want to read why our stop-loss orders are usually relatively far from the current price.
Please note that a full position doesn't mean using all of the capital for a given trade. You will find details on our thoughts on gold portfolio structuring in the Key Insights section on our website.
As a reminder - "initial target price" means exactly that - an "initial" one. It's not a price level at which we suggest closing positions. If this becomes the case (like it did in the previous trade), we will refer to these levels as levels of exit orders (exactly as we've done previously). Stop-loss levels, however, are naturally not "initial", but something that, in our opinion, might be entered as an order.
Since it is impossible to synchronize target prices and stop-loss levels for all the ETFs and ETNs with the main markets that we provide these levels for (gold, silver and mining stocks - the GDX ETF), the stop-loss levels and target prices for other ETNs and ETF (among other: UGL, GLL, AGQ, ZSL, NUGT, DUST, JNUG, JDST) are provided as supplementary, and not as "final". This means that if a stop-loss or a target level is reached for any of the "additional instruments" (GLL for instance), but not for the "main instrument" (gold in this case), we will view positions in both gold and GLL as still open and the stop-loss for GLL would have to be moved lower. On the other hand, if gold moves to a stop-loss level but GLL doesn't, then we will view both positions (in gold and GLL) as closed. In other words, since it's not possible to be 100% certain that each related instrument moves to a given level when the underlying instrument does, we can't provide levels that would be binding. The levels that we do provide are our best estimate of the levels that will correspond to the levels in the underlying assets, but it will be the underlying assets that one will need to focus on regarding the signs pointing to closing a given position or keeping it open. We might adjust the levels in the "additional instruments" without adjusting the levels in the "main instruments", which will simply mean that we have improved our estimation of these levels, not that we changed our outlook on the markets. We are already working on a tool that would update these levels daily for the most popular ETFs, ETNs and individual mining stocks.
Our preferred ways to invest in and to trade gold along with the reasoning can be found in the how to buy gold section. Furthermore, our preferred ETFs and ETNs can be found in our Gold & Silver ETF Ranking.
As a reminder, Gold & Silver Trading Alerts are posted before or on each trading day (we usually post them before the opening bell, but we don't promise doing that each day). If there's anything urgent, we will send you an additional small alert before posting the main one.
Thank you.
Przemyslaw Radomski, CFA
Founder, Editor-in-chief

