

Briefly: in our opinion, no speculative positions in gold, silver, or mining stocks are justified from the risk/reward point of view at the moment of publishing this Alert. We closed our previous long positions in mining stocks yesterday, taking enormous profits off the table. If you didn't manage to close them yesterday, in our opinion exiting them today would be a good idea. We will enter short positions in the miners once gold moves to $1,690.
As stated in the title - yesterday was indeed THE day. It was the day when the reward to risk ratio peaked in case of our long positions in mining stocks. Miners could rally today, or they could decline today (and we'll elaborate in the following paragraphs), and overall the situation right now is too unclear to justify a long position. In fact, it's too unclear to justify any position, but we expect things to clarify before too long - likely before the end of the week. This means that we will likely open speculative short positions shortly.
But let's get back to what happened yesterday.
Yesterday, we sent you an intraday Alert in which we let you know that we think that it would be a good idea to exit the long positions 5 to 7 minutes before the end of yesterday's session.
And here's what happened at the end of yesterday's session.
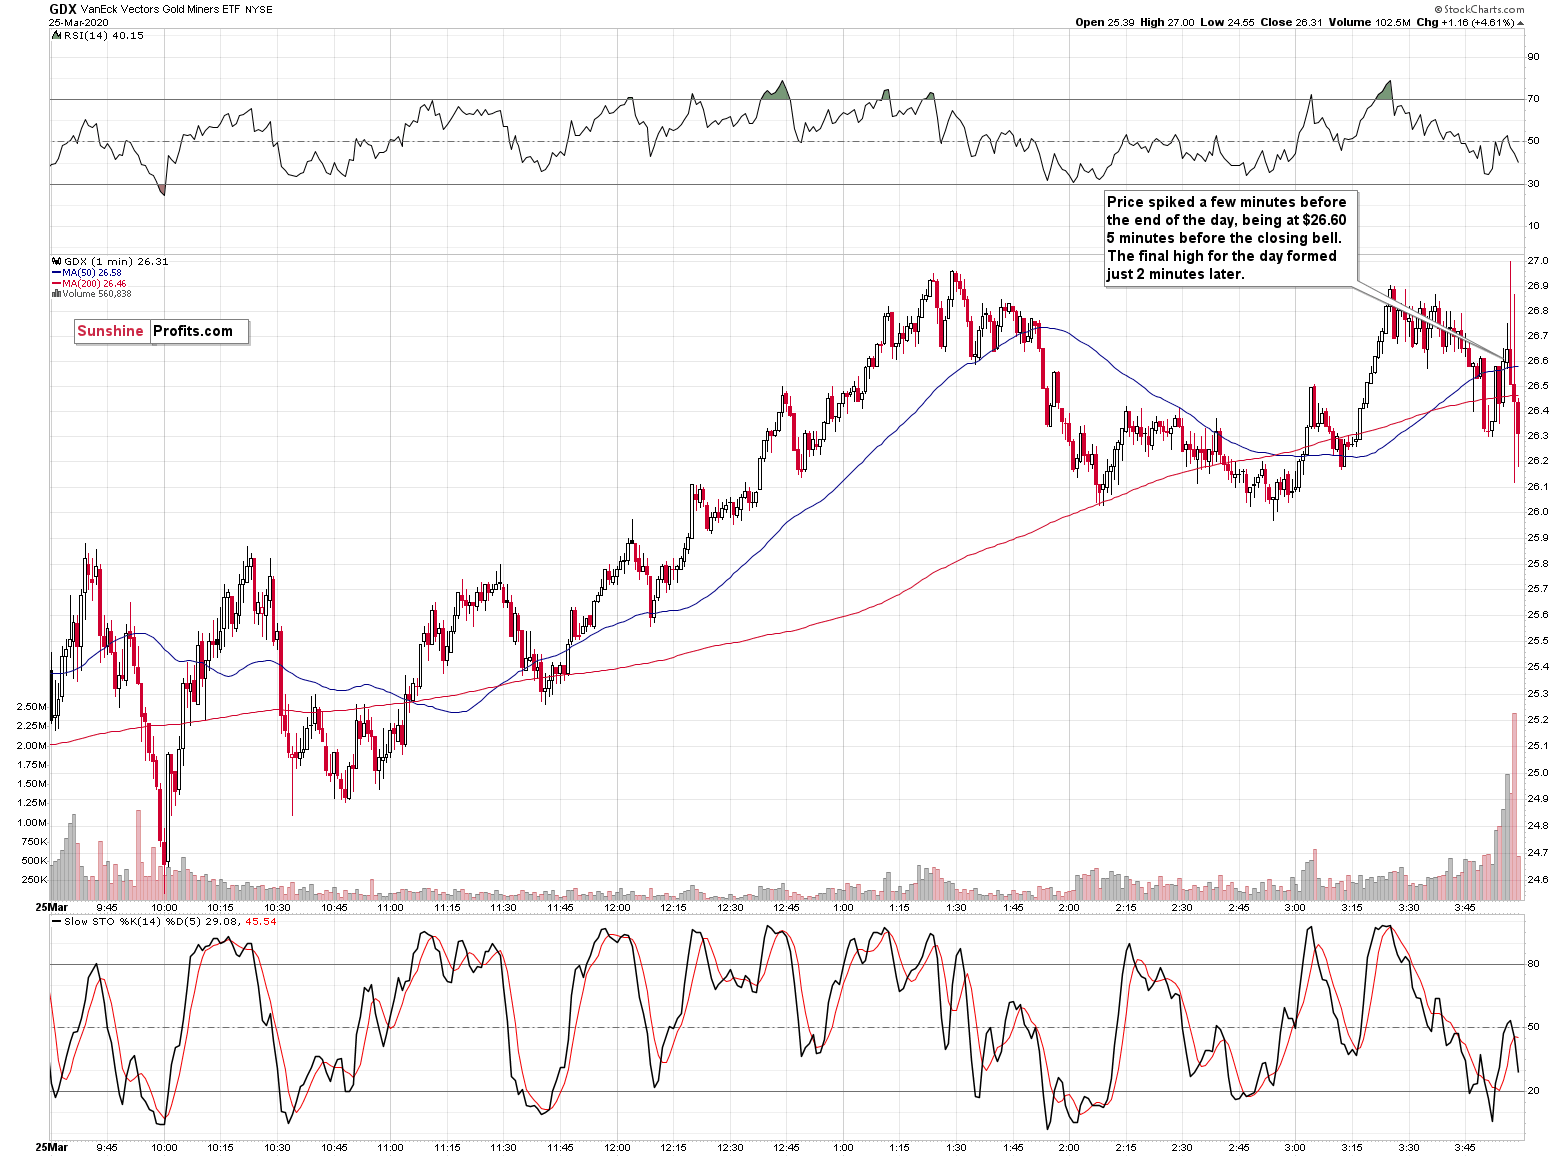
The GDX ETF value spiked and created the daily high just 2 minutes after the above-described time frame. GDX closed the session visibly below the prices that were available in the preceding 16 minutes. Why are we mentioning 16 minutes? Because we sent yesterday's intraday Alert 16 minutes before the end of the session.
This is relatively little time for one to act, so we would like to explain why it wasn't sent earlier. After all, we could have written it in advance, right?
Well, we did write the intraday Alert in advance - actually a few hours before the end of the session. We tried to estimate what the situation would look like later in the day, assuming that our previous price targets will have been reached. However, as we were finishing writing that analysis, it became obvious that these targets might not be reached at all during the day, making the entire previous text relatively useless. So, we wrote another one starting from the scratch. The latter was based on closing the entire position at the market. And when we were finishing writing this text, we realized that it would be better to actually wait with exiting the position until the very final part of the session. That was based on gold's very short-term rally during the session, which appeared to be the final rally that would be analogous to the final upswing that we saw in 2008, and it was based on the recent tendency of the mining stocks to rally in the final part of the session. This means that we actually had to write the third intraday Alert yesterday (the two previous were simply never published / sent). And we did.
Of course, writing is not the only thing that we did. Actually, it was the smaller part of what the work involved. What we were doing, is tracking all the key markets minute by minute. We rarely go into the intraday moves, but yesterday was particularly important. Moreover, I - PR - also got support from the best intraday technical trader that I know - my wife (Nadia Simmons, who is providing i.a. our Day Trading Signals). So, we were tracking all the quick intraday changes, considering the resistance levels, and... Trying to write an analysis that would take all this up-to-date information and that would also be timely at the moment it was published - the situation changed very quickly.
The work was completed about 30 minutes before the end of the session. However, it turned out that our server got very slow and it took a relatively long time to send the intraday Alert to you. It seems that a lot of people were checking our website at the same time, looking for an update. Ironically, this was exactly what prevented us from publishing and sending it several minutes earlier.
We are writing all this to explain that we were actually doing our very best to deliver the analysis to you sooner. Unfortunately, there are some limitations to the newsletter form of providing our services that we can't eliminate. In case of other arrangements that we have with our clients, who are accredited investors, we can enter the trades ourselves without all the technicalities involved with writing, testing, and sending the newsletter, however, that's not something that we can provide through the Alerts.
Anyway, just 3 minutes before the end of the session the GDX topped, so we were very close to getting you the best exit price that was possible yesterday. Gold is soaring today, after the 3M+ jobless claims, and so far (at the moment of writing these words), the market price 5 minutes after the markets opened (when we are writing this) for the GDX ETF is $27.02 That's even a bit higher than yesterday's exit price.
Regardless of whether you exited the long positions that we entered with GDX at about $17, 5 minutes before yesterday's close or early today - the profits that you just made are astronomical - congratulations.
In case one was not able to exit the long positions yesterday, we strongly suggest exiting them as soon as possible. This is even more important in case of the leveraged ETNs (NUGT and JNUG) as their prices would be particularly vulnerable to declines. I repeat - do not hold these positions hoping that miners will get even higher. The risk in that bet would be enormous.
Let's look into the future.
In our view, the future looks pretty much like 2008, but more dramatic, and much faster. In yesterday's regular Gold & Silver Trading Alert, we described the analogy to 2008 in terms of time, and this analogy remains in place. We will quote the key part as it's very important to determine what's likely just around the corner.
The 2008 and 2020 Comparisons
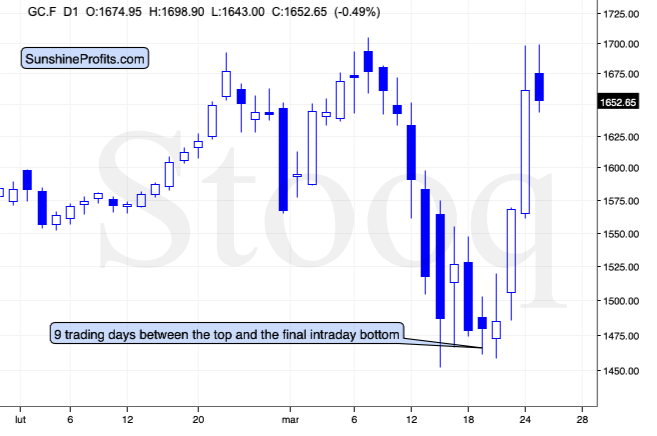
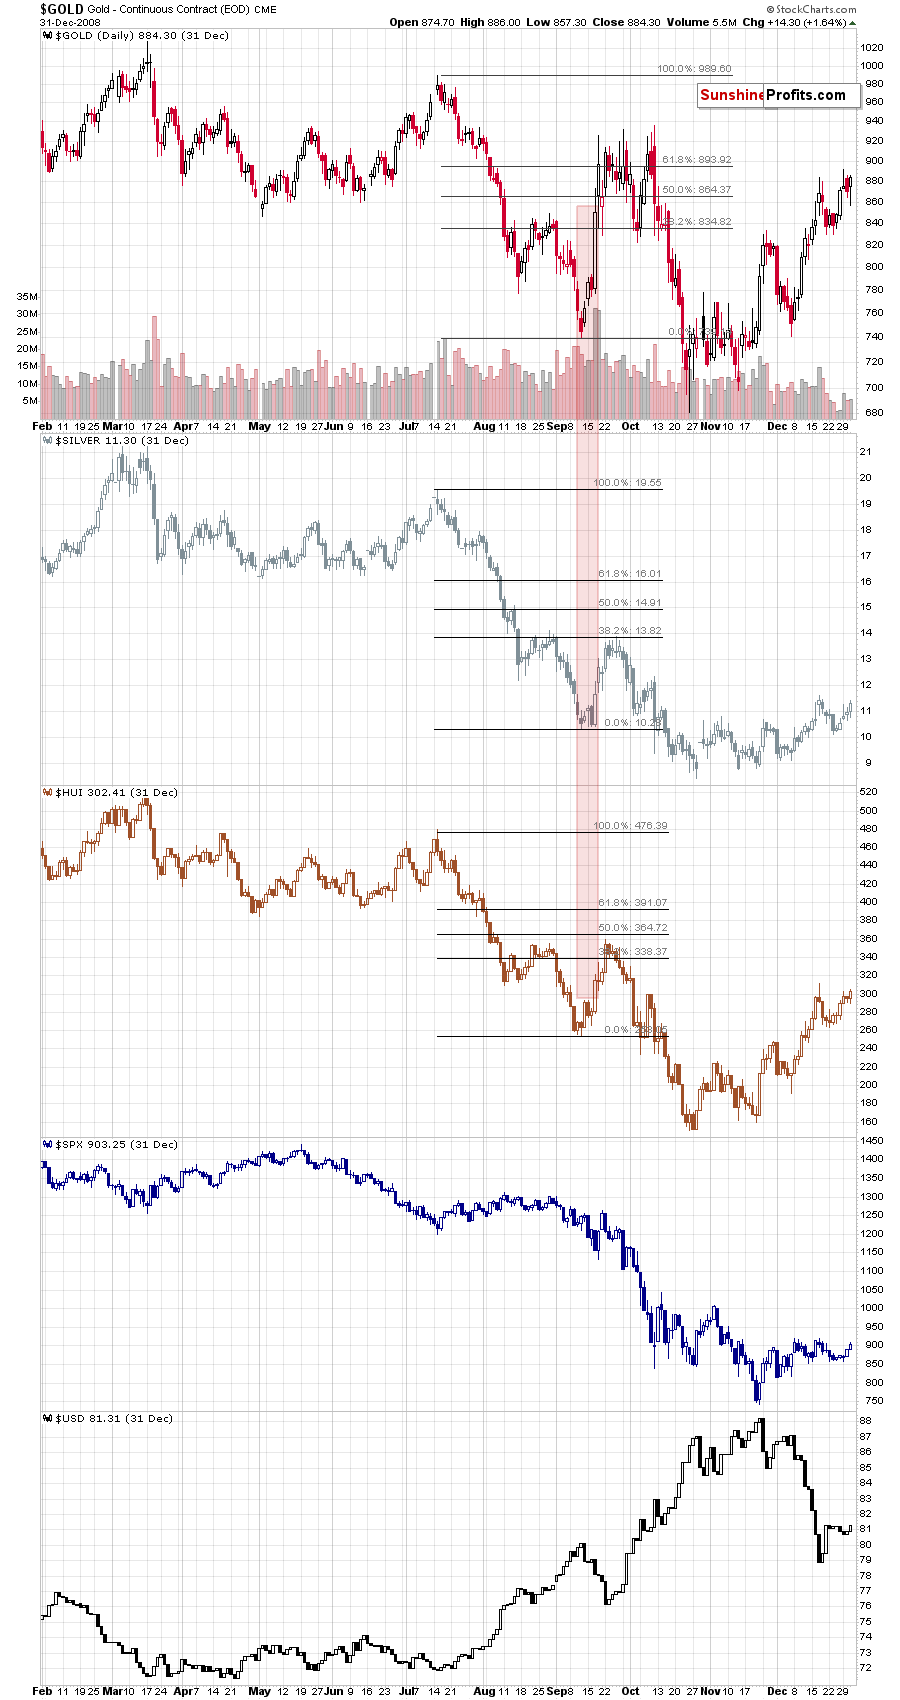
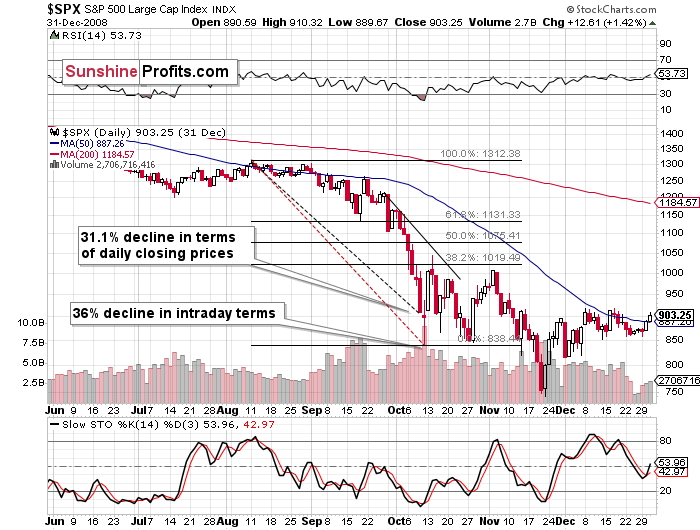
It took 9 trading days for gold to decline from its top to the final intraday bottom, before starting the powerful comeback.
In 2008, it took 41 days. It seems that things are developing about 4.5 times faster now, than they were developing in 2008. More precisely: 41/9 = 4.56 times.
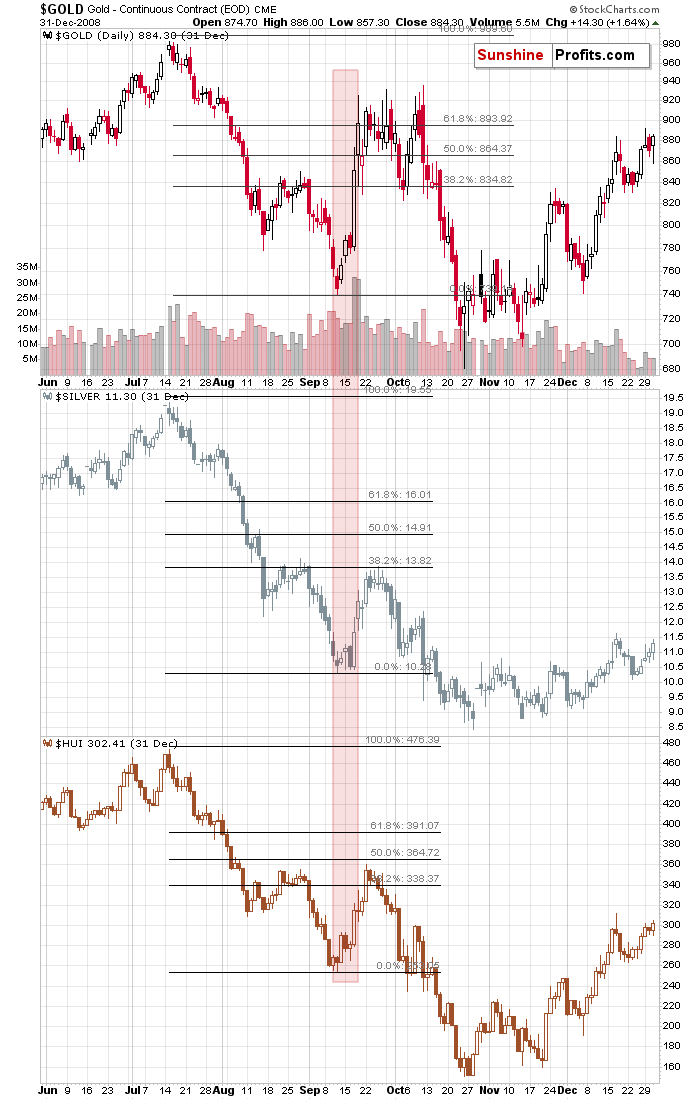
Please note that the decline that preceded the sharp upswing in gold, is also somewhat similar to what we saw recently. There was an initial slide in gold that ended in mid-August 2008, then we saw a correction and then another slide and a bottom in early September. This year, we saw an initial bottom in mid-March, and the final one a few days ago.
Back in 2008, it took 23 trading days for gold to reach its initial bottom and it then took another 18 days for the final short-term bottom to form. 56.1% of the downswing was to the initial bottom, and the 43.9% of the downswing was between the initial and final bottom.
And now? It took 5 out of 9 trading days for gold to reach the initial bottom, and the remaining 4 days were the time between the bottoms. That's 55.6% and 44.4% respectively.
This is very important, because it shows that the shape of the move is indeed very similar now.
This means that we can most likely draw meaningful conclusions for the current situation based on how the situation developed back in 2008.
Back then, gold moved back and forth close to the initial top. That's what gold has been doing so far today - which serves as another confirmation for the analogy.
Back in 2008, gold topped over the period of 16 trading days. Dividing this by 4.56 provides us with 3.5 days as the target for the end of the topping pattern since its start. The pattern started yesterday, which suggests that gold could top tomorrow or on Friday.
The situation gets more interesting as we dig in more thoroughly...
There are 24 hours in a day. Dividing this by the factor of 4.56 provides us with 5.26. This means that if we could create a chart with 5.26 hour candlesticks, the price moves in gold should be analogous (in terms of how we see them on the chart) to their daily performance from 2008. The closest that we have available are the 4-hour candlesticks.
Let's check how gold performed recently from this perspective, and compare it to its daily performance from 2008.
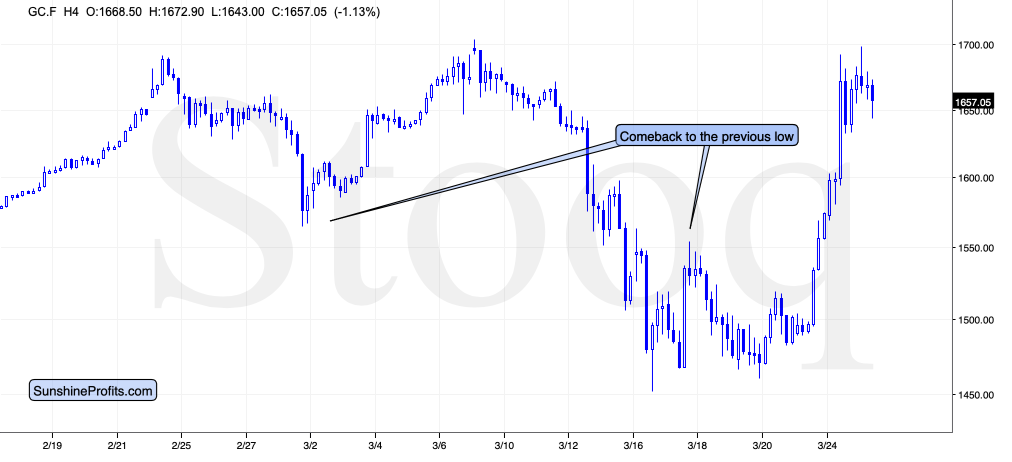
The price moves are remarkably similar.
Even the March 17, 2020 upswing took gold to analogous price level! Gold temporarily topped very close to the previous (Feb 28) low. That's in perfect analogy to how high gold corrected in late August 2008 - it moved up to the early May 2008 high.
The link to 2008 truly is the key right now.
Based on the 2008 - now analogy, it seems likely that stocks, silver, and miners have already topped or that they will top this week. In fact, it seems that gold is on its way to form the final - third - high later today. The similarity in terms of shape of gold's price moves is truly remarkable.
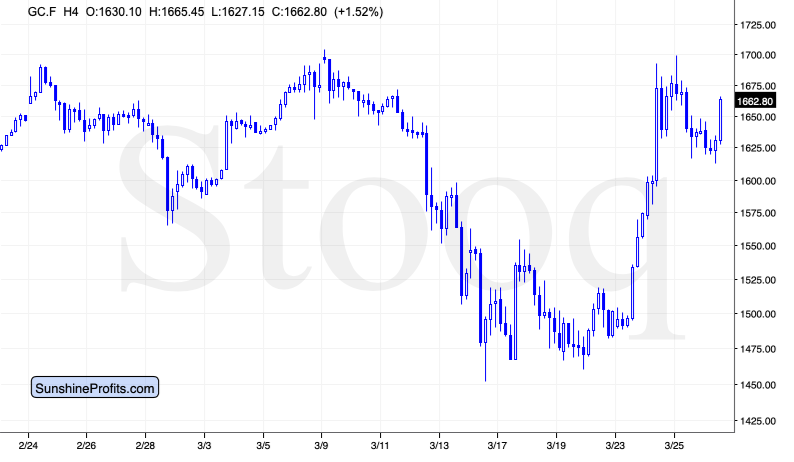
Gold is once again soaring after forming two intraday highs, with the second one being higher than the first one. That's exactly what happened during the 2008 topping pattern. Just like it was the case in 2008, gold first faked declining only to rally back up.
If the analogy remains intact - and we expect this to be the case - we think that gold will move very close to the previous highs - likely later today. And if not today, then tomorrow.
Please note that the current underlying bias is more bullish than it was in 2008. This year, the March high was higher than the February high and the most recent sharp upswing took gold practically back to the monthly high. In 2008, gold wasn't as strong.
Back in 2008, gold's third - and final - top formed a bit above the previous intraday highs. This time we also expect something similar. This time, however, due to the above-mentioned bullish bias, we think that gold will also manage to very temporarily break above the previous 2020 high. It would be likely to temporarily move to a new 2020 high and then quickly invalidate this breakout. This would create an excellent shorting opportunity for the precious metals sector.
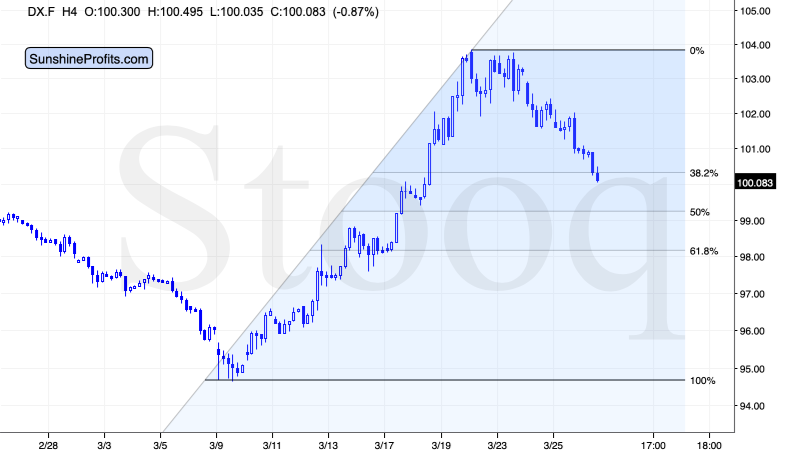
The USD Index just broke below its 38.2% Fibonacci retracement level, which means that it's now likely to head toward the 50% retracement. This approximately corresponds to the March 18 low. It seems that the USDX could bottom at this retracement while gold tests its yearly highs.
We can't rule out a situation in which the USDX declines all the way down to the 61.8% Fibonacci retracement level at about 98, but this level seems less likely to stop the decline than the 50% level - the latter is more in tune with how the situation developed in 2008.
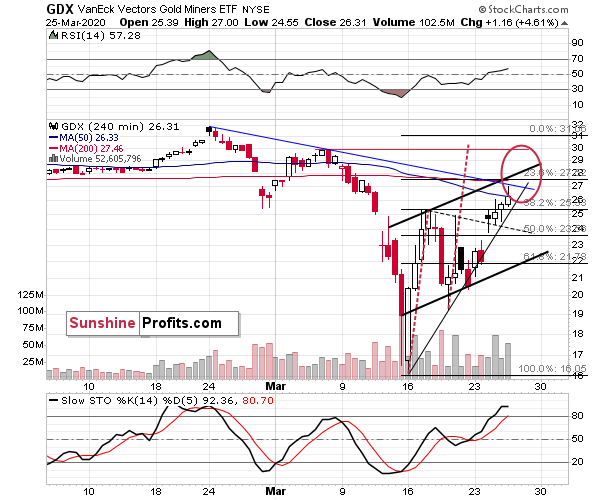
The GDX ETF rallied almost to its declining resistance yesterday, and that could have been the final top. It could be the case that based on gold's rally, miners will make a new high today, but it's far from being certain.
What is more certain (of course, there are no certainties in any market, what we mean here is that it's much more likely) is that miners will make an intraday attempt to move higher (along with gold) and that this attempt will fail.
As previously, a lot depends on how the situation develops in the stock market, but given that it developed practically exactly as it did in 2008 after a similarly big decline - and as we outlined previously - it seems that the top in the stock market might be already in. If this is the case, then the only thing driving miners higher would be gold's rally.
In 2008, the huge decline was corrected in the following way: first, a reversal, then a huge daily rally and then a session with daily back and forth movement. And what happened recently?
First, a reversal, then a huge daily rally, and then (yesterday) as session with daily back and forth movement.
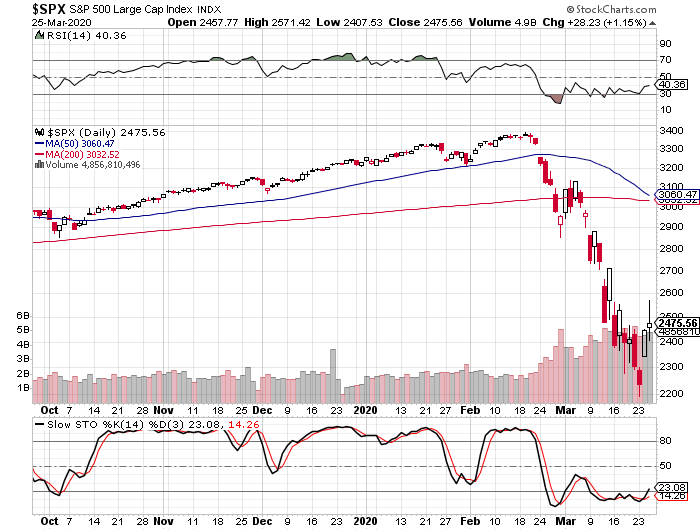
Based on the 2008-link, it seems that the rally in the general stock market might already be over.
It's actually quite remarkable how weak the stock market was despite all the stimulus money.
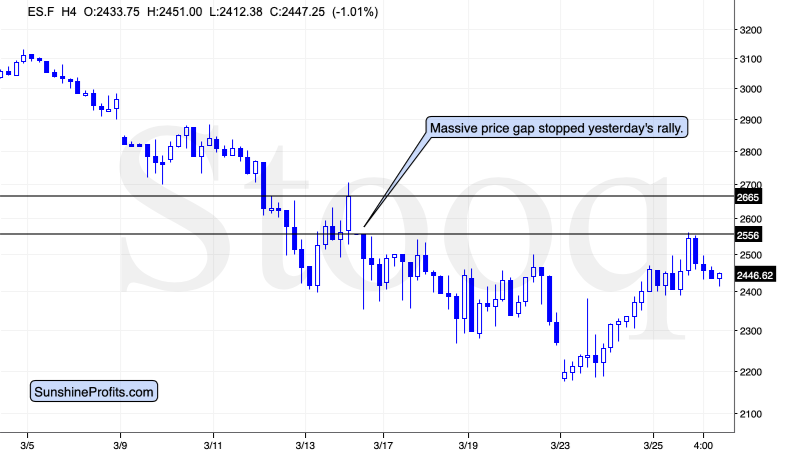
Stocks didn't manage to rally to their 38.2% Fibonacci retracement level. Instead, they were stopped by the lower border of the massive price gap. Based on the above chart alone, the stock market could move higher once again today, but based on the 2008 analogy it seems that it won't. Overall, the bullish implications of the situation on the stock market that we had previously described, appear to be gone.
Summary
Summing up, it seems that the rally in the precious metals market is about to be over, and we took enormous profits from our long positions in the mining stocks yesterday. If anyone didn't exit that position yesterday, we think that it would be a good idea to exit it as soon as possible. Based on the analogy to 2008 and also on other factors, it seems that entering the speculative short positions will be justified once gold breaks above $1,690. Some investors/traders may want to wait until gold moves a bit above the previous 2020 highs (and we might attempt to catch this fake breakout ourselves), but that's not what seems appropriate for most people. We expect gold to move above $1,690 later today or tomorrow.
By the way, we recently opened a possibility to extend one's subscription for a year with a 10% discount in the yearly subscription fee (the profits that you just took have probably covered decades of subscription fees...). It also applies to our All-Inclusive Package (if you didn't know - we just made huge gains shorting crude oil and are also making money on both the decline and temporary rebound in stocks). The boring time in the PMs is over and the time to pay close attention to the market is here - it might be a good idea to secure more access while saving 10% at the same time. Please contact us, if you'd like to take advantage of this offer.
Important: If your subscription got renewed recently, but you'd like to secure more access at a discount - please let us know, we'll make sure that the discount applies right away, while it's still active. Moreover, please note that you can secure more access than a year - if you secured a yearly access, and add more years to your subscription, each following year will be rewarded with an additional 10% discount (20% discount total). We would apply this discount manually - please contact us for details.
As always, we'll keep you - our subscribers - informed.
To summarize:
Trading capital (supplementary part of the portfolio; our opinion): Full speculative short positions (150% of the full position) in mining stocks (but not in gold nor silver) will be justified from the risk to reward point of view once gold moves to $1,690 with the following binding exit profit-take price levels:
Senior mining stocks (price levels for the GDX ETF): binding profit-take exit price: $17.22; stop-loss: none (the volatility is too big to justify a SL order in case of this particular trade); binding profit-take level for the DUST ETF: $5.98; stop-loss for the DUST ETF: none (the volatility is too big to justify a SL order in case of this particular trade)
Junior mining stocks (price levels for the GDXJ ETF): binding profit-take exit price: $20.22; stop-loss: none (the volatility is too big to justify a SL order in case of this particular trade); binding profit-take level for the JDST ETF: $5.29; stop-loss for the JDST ETF: none (the volatility is too big to justify a SL order in case of this particular trade)
Long-term capital (core part of the portfolio; our opinion): No positions (in other words: cash)
Insurance capital (core part of the portfolio; our opinion): Full position
Whether you already subscribed or not, we encourage you to find out how to make the most of our alerts and read our replies to the most common alert-and-gold-trading-related-questions.
Please note that the in the trading section we describe the situation for the day that the alert is posted. In other words, it we are writing about a speculative position, it means that it is up-to-date on the day it was posted. We are also featuring the initial target prices, so that you can decide whether keeping a position on a given day is something that is in tune with your approach (some moves are too small for medium-term traders and some might appear too big for day-traders).
Plus, you might want to read why our stop-loss orders are usually relatively far from the current price.
Please note that a full position doesn't mean using all of the capital for a given trade. You will find details on our thoughts on gold portfolio structuring in the Key Insights section on our website.
As a reminder - "initial target price" means exactly that - an "initial" one, it's not a price level at which we suggest closing positions. If this becomes the case (like it did in the previous trade) we will refer to these levels as levels of exit orders (exactly as we've done previously). Stop-loss levels, however, are naturally not "initial", but something that, in our opinion, might be entered as an order.
Since it is impossible to synchronize target prices and stop-loss levels for all the ETFs and ETNs with the main markets that we provide these levels for (gold, silver and mining stocks - the GDX ETF), the stop-loss levels and target prices for other ETNs and ETF (among other: UGLD, DGLD, USLV, DSLV, NUGT, DUST, JNUG, JDST) are provided as supplementary, and not as "final". This means that if a stop-loss or a target level is reached for any of the "additional instruments" (DGLD for instance), but not for the "main instrument" (gold in this case), we will view positions in both gold and DGLD as still open and the stop-loss for DGLD would have to be moved lower. On the other hand, if gold moves to a stop-loss level but DGLD doesn't, then we will view both positions (in gold and DGLD) as closed. In other words, since it's not possible to be 100% certain that each related instrument moves to a given level when the underlying instrument does, we can't provide levels that would be binding. The levels that we do provide are our best estimate of the levels that will correspond to the levels in the underlying assets, but it will be the underlying assets that one will need to focus on regarding the signs pointing to closing a given position or keeping it open. We might adjust the levels in the "additional instruments" without adjusting the levels in the "main instruments", which will simply mean that we have improved our estimation of these levels, not that we changed our outlook on the markets. We are already working on a tool that would update these levels on a daily basis for the most popular ETFs, ETNs and individual mining stocks.
Our preferred ways to invest in and to trade gold along with the reasoning can be found in the how to buy gold section. Additionally, our preferred ETFs and ETNs can be found in our Gold & Silver ETF Ranking.
As a reminder, Gold & Silver Trading Alerts are posted before or on each trading day (we usually post them before the opening bell, but we don't promise doing that each day). If there's anything urgent, we will send you an additional small alert before posting the main one.
Thank you.
Sincerely,
Przemyslaw Radomski, CFA
Editor-in-chief, Gold & Silver Fund Manager

