

Briefly: in our opinion, full (300% of the regular position size) speculative short positions in junior mining stocks are justified from the risk/reward point of view at the moment of publishing this Alert.
Gold futures rallied by almost $30 yesterday (1.43%), while silver moved up by almost a dollar (2.99%). Yet, junior miners were barely up. The GDX ETF ended the day just 0.89% higher, and the GDXJ ETF moved up by just 1.41%. GDXJ’s 1.41% might seem significant as it’s almost the same size as the daily upswing that we saw in gold (1.43%), but let’s not forget that the day-to-day price movement is usually magnified by miners. That wasn’t the case yesterday, but that silver outperformed gold on a very short-term basis was. This is a bearish combination, even though it might not “feel” bearish at all.
The overall feeling might be that the market is about to soar, and that it can be irrational and rally (despite spiking real interest rates) for so long that the following decline won’t matter. Or that all this doesn’t make sense, and gold will just go up for whatever reason.
We received many more messages yesterday (today’s analysis addresses almost all of them) than we usually receive usually and this could be an indication that the emotions surrounding the situation in the precious metals market are reaching their peak. There’s no guarantee, of course, but that’s what I’ve noticed over and over again – peak emotionality is closely connected to peak price. They tend to take place simultaneously or relatively close to each other. In other words, it seems that we won’t have to wait long for the PMs to start their next big move down.
How long can the gold market ignore its two key fundamental drivers: the USD Index and the real interest rates? Not that long, in my view. The way markets perform is shaped by emotions and various things that impact them. Fundamentals are one thing, but issues like war get in the middle of the way of patterns that could be played almost exactly as they did in the past. However, geopolitical events or one-of-a-kind news that don’t change the key fundamentals are very unlikely to trigger a lasting change in the trend. The only thing that they are likely to do is to change the shape of the similarity to a previous pattern or to cause a delay in action that “should” follow a certain technical signal.
Instead of a monthly correction, we could have a 1.5- or 2-month long correction. Or instead of a regular head-and-shoulders pattern, we could have one with two right shoulders or something along those lines. The bigger the picture that we’re taking into consideration, the smaller the deviations from the patterns are likely to be. That’s one of the reasons why long-term charts and the indications they provide are more important than the ones coming from medium- or short-term ones.
I’ve been discussing the real interest rates recently (and I will continue to do so as that topic continues to be very important for the future of precious metals’ and mining stocks’ prices), and we all know what the USD Index has been doing.
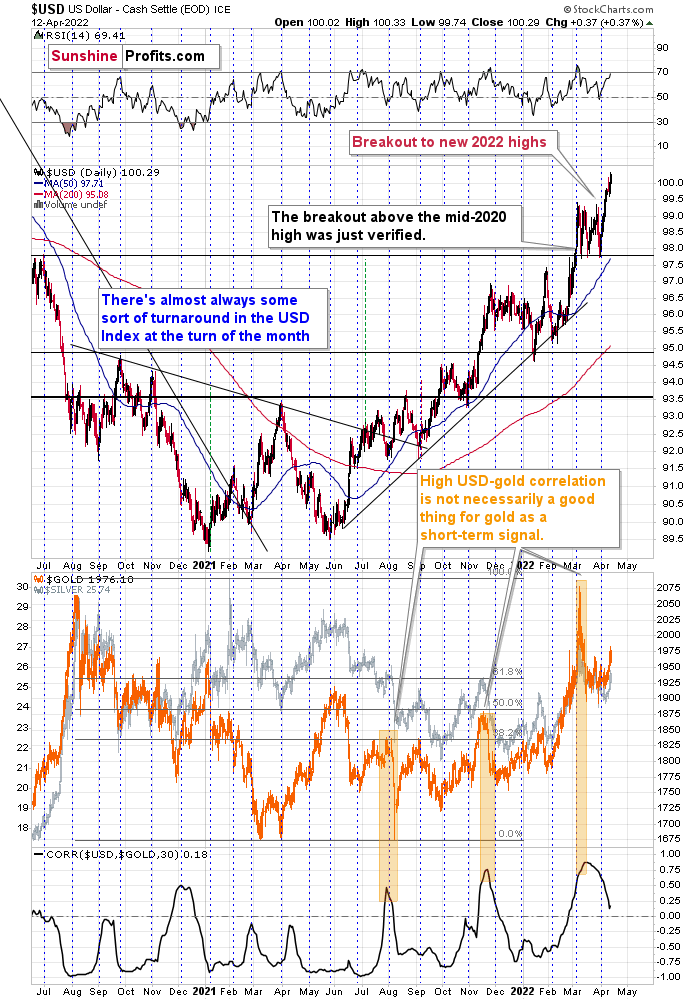
The USD Index is on a rise – a quite dramatic one.
Gold hasn’t responded to this profound rally just yet, as it seems to be still benefiting from the war concern factor. However – as analysis of previous wars shows – this factor is likely to become less and less important from the precious metals’ market point of view.
While we’re discussing currencies, it’s difficult not to mention the fact that the Russian central bank pegged the ruble to gold. Let’s take a closer look.
Still a Momentum Trade
While several asset classes have suffered immense stress in recent weeks, the PMs have remained relatively elevated. Moreover, concerns have arisen that since the Russian central bank pegged the ruble to gold, it has helped uplift the yellow metal.
For context, the Russian central bank announced on Mar. 25 that it would pay 5,000 rubles ($52) per gram of gold. This allowed the USD/RUB to garner an exchange rate of ~96.15 (5,000/52). However, the important point is that the policy was aimed at supporting the ruble, not the PMs.
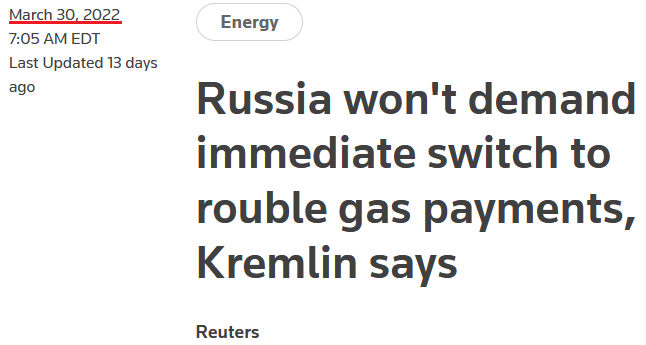
To explain, when Russia invaded Ukraine, NATO responded with seismic sanctions. As a result, the USD/RUB rallied to an all-time high of 121.21. However, the threats worked perfectly for Russia, as the USD/RUB is now at ~79.68 and lower than the 85.28 recorded pre-invasion. Furthermore, Russian President Vladimir Putin attempted the same feat when he said that all Russian gas exports would need to be paid for in rubles.
A Reuters article stated:
"Putin's order to charge 'unfriendly' countries in rubles for Russian gas boosted the Russian currency after it plunged to all-time lows when the West imposed sweeping sanctions on Moscow for its invasion of Ukraine. European gas prices also rocketed up."
However, with the ruble strengthening materially in recent weeks, the policy is no longer needed.
Please see below:
Likewise, it’s the same story for the PMs. After announcing the fixed peg on Mar. 25, the Kremlin scrapped that policy on Apr. 7, since the ruble is strong enough and doesn’t need any indirect support.
Please see below:
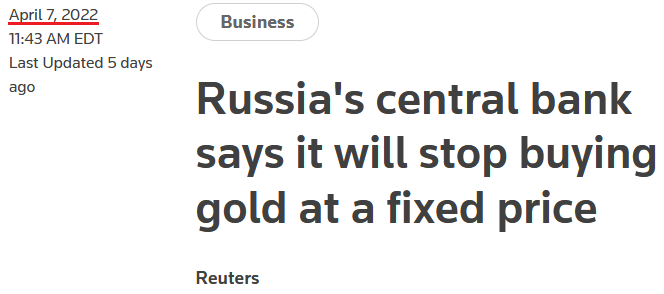
Furthermore, the Russian central bank cited a "significant change in market conditions" for reversing the policy. In a nutshell: since the ruble is stronger than it was before the invasion, the currency impact of sanctions is immaterial. Therefore, the central bank is happy to let the ruble float.
Please see below:
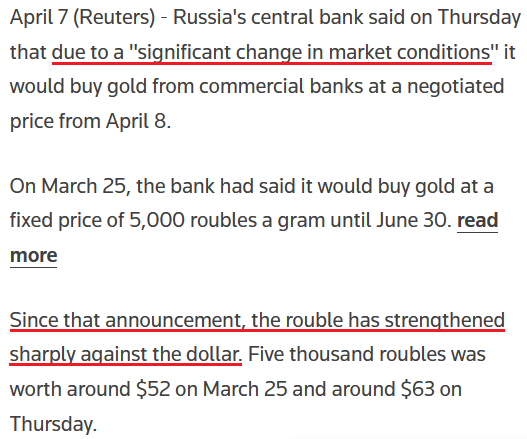
All in all, the moves made by the Russian central bank were designed to support the ruble. When a currency plunges, the FX-adjusted cost of imports skyrockets. As such, sanctions would cripple growth, inflation would rage, and the Russian economy would suffer stagflation on steroids. However, by stabilizing the currency, Russia solves half of the problem. Thus, while the recent developments may seem like they uplifted the PMs, they're largely immaterial from a medium-term perspective.
More importantly, the PMs' domestic fundamental outlooks continue to deteriorate. For example, the U.S. 10-Year real yield hit a new 2022 high of -0.12% on Apr. 11, and closed at -0.13% on Apr. 12. Moreover, while momentum keeps the yellow metal uplifted, history shows that the current gold price is unsustainable.
Please see below:
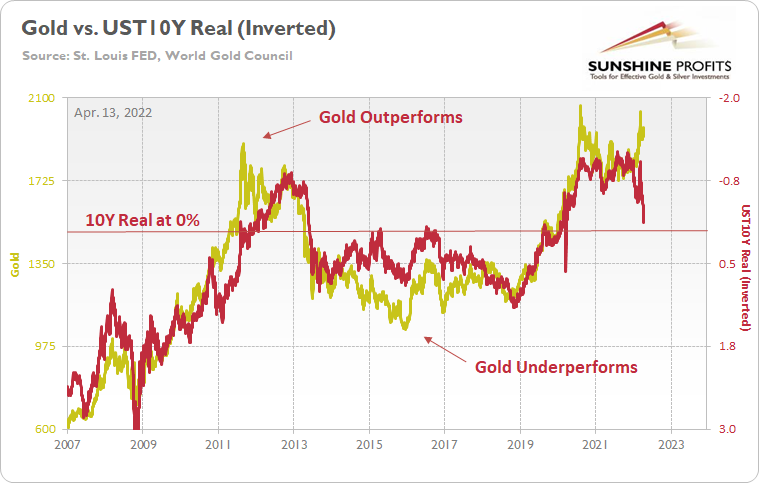
To explain, the gold line above tracks the price tallied by the World Gold Council, while the red line above tracks the inverted U.S. 10-Year real yield. For context, inverted means that the latter's scale is flipped upside down and that a rising red line represents a falling U.S. 10-Year real yield, while a falling red line represents a rising U.S. 10-Year real yield.
Moreover, I wrote on Apr. 11 that gold and the U.S. 10-Year real yield have a daily correlation of -0.92 since 2007. Therefore, we must ignore 15+ years of historical data to assume that gold's best days lie ahead.
To that point, the famous quote from John Maynard Keynes is relevant here. He said that "markets can stay irrational longer than you can stay solvent." In a nutshell: the price action can make investors second-guess themselves, even when the data supports the opposite conclusion. Furthermore, if you analyze the arrows above, you can see that investors' optimism helped gold outperform the U.S. 10-Year real yield in 2011, while investors' pessimism helped gold underperform the U.S. 10-Year real yield in 2015.
As a result, sentiment rules the day in the short term, and the algorithms move in whichever direction the wind is blowing. Therefore, we find ourselves in that situation now. With the Russia-Ukraine conflict increasing gold's geopolitical appeal, safe-haven momentum remains ripe. In addition, another 2022 high in the headline Consumer Price Index (CPI) also increases gold's inflation-hedge appeal. For context, the metric increased by 8.5% year-over-year (YoY) on Apr. 12.
Please see below:
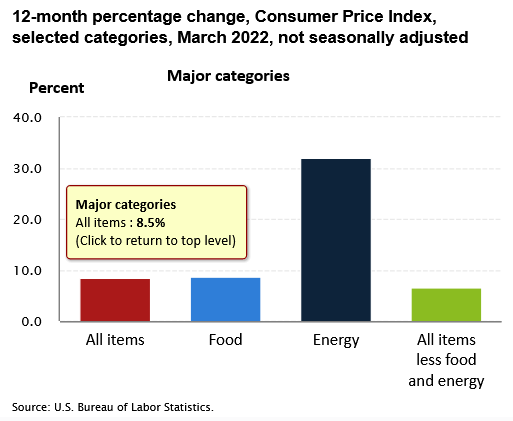
However, investors are short-sighted about the medium-term implications. While conventional wisdom implies that abnormally high inflation is bullish for the PMs, the reality is that pricing pressures awaken the Fed. Since positive real yields are essential to curb inflation, the Fed has to tighten financial conditions to achieve its goal.
To explain, I wrote on Apr. 5:
I warned throughout 2021 that a hawkish Fed and tighter financial conditions are bearish for the PMs. And while the fundamental expectation worked perfectly before the Russia-Ukraine crises erupted, the medium-term thesis is clearer now than it was then.
Please see below:
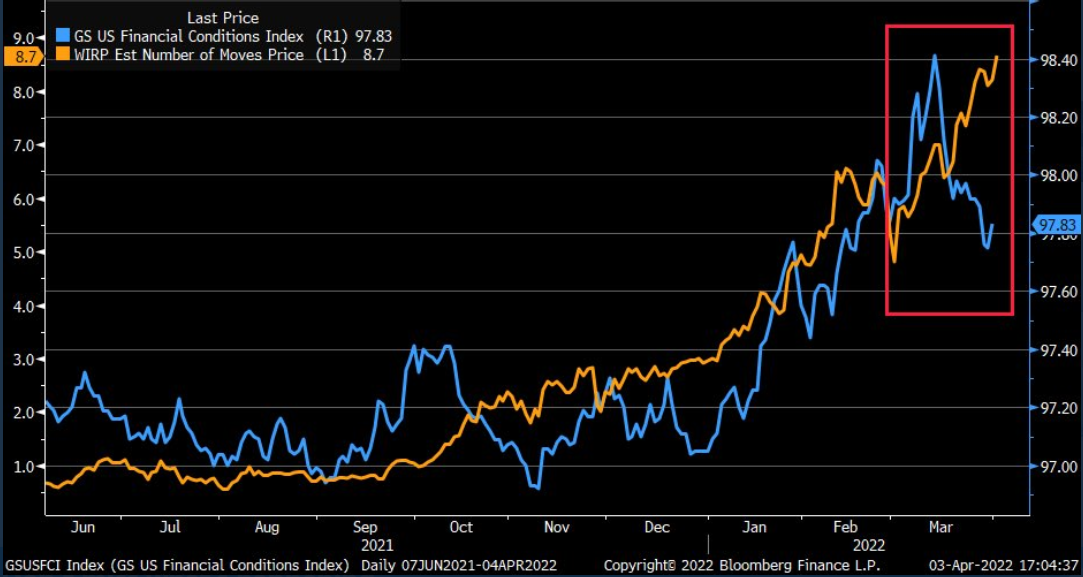
To explain, the orange line above tracks the number of rate hikes priced in by the futures market, while the blue line above tracks Goldman Sachs’ Financial Conditions Index (FCI). If you analyze the movement of the former, futures traders expect roughly nine rate hikes by the Fed in 2022.
However, if you focus your attention on the right side of the chart, you can see that the FCI has declined materially from its highs. Therefore, financial conditions are easier now than they were before the March FOMC meeting. However, the Fed needs to tighten financial conditions to calm inflation. But since market participants are not listening, Chairman Jerome Powell needs to amplify his hawkish rhetoric until the message hits home.
Think about it: if looser financial conditions are used to stimulate economic growth and inflation, how can the Fed calm the pressures without reversing the situation? Moreover, please remember that the current policy stance contributed to 8%+ annualized inflation. Thus, it’s unrealistic to materially reduce inflation from 8% to 2% without the Fed materially shifting the liquidity dynamics. Therefore, investors’ optimism will likely reverse sharply over the medium term.
To that point, while the implications of a higher FCI and higher real yields take time to play out, the Fed has upped the hawkish ante in recent days. In the process, both the bond and the stock market have changed their tones. Therefore, commodities like the PMs will likely be the last shoe to drop.
For additional context, I wrote on Feb. 2:
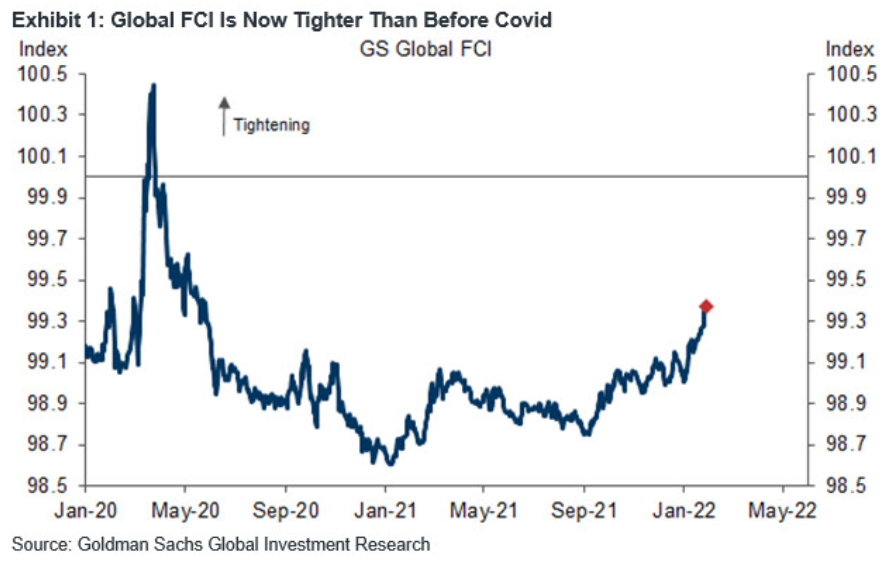
If you analyze the right side of the chart, you can see that the FCI has surpassed its pre-COVID-19 high (January 2020). Moreover, the FCI bottomed in January 2021 and has been seeking higher ground ever since. In the process, it's no coincidence that the PMs have suffered mightily since January 2021. Furthermore, with the Fed poised to raise interest rates at its March monetary policy meeting, the FCI should continue its ascent. As a result, the PMs' relief rallies should fall flat like in 2021.
Likewise, while the USD Index has come down from its recent high, it's no coincidence that the dollar basket bottomed with the FCI in January 2021 and hit a new high with the FCI in January 2022. Thus, while the recent consolidation may seem troubling, the medium-term fundamentals supporting the greenback remain robust.
Thus, while the USD Index has surpassed 100 and reflects the fundamental reality of a higher FCI and higher real yields, the PMs do not. However, the PMs are in la la land since the FCI is now at its highest level since the global financial crisis (GFC).
Please see below:
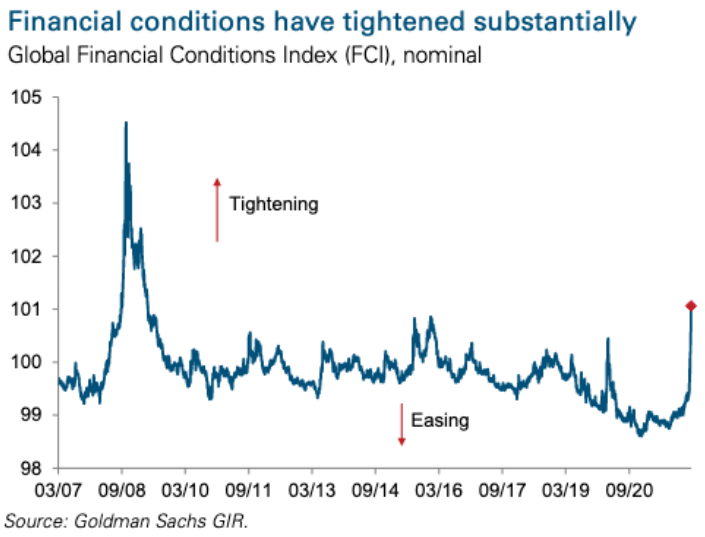
Also noteworthy, the FCI made quick work of the March 2020 high from the first chart above. Again, Fed officials know that higher real yields and tighter financial conditions are needed to curb inflation. That’s why they keep amplifying their hawkish message and warning investors of what lies ahead. However, with commodities refusing to accept this reality, they’ll likely be the hardest-hit once the Fed’s rate hike cycle truly unfolds.
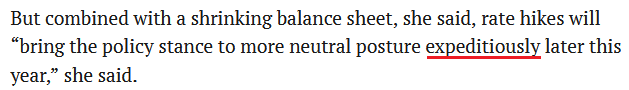
Speaking of which, Fed Governor Lael Brainard said on Apr. 12: “Inflation is too high, and getting inflation down is going to be our most important task.”
She added: “I think there’s quite a bit of capacity for labor demand to moderate among businesses by actually reducing job openings without necessitating high levels of layoffs.” As a result, she’s telling you that Fed officials will make it their mission to slow down the U.S. economy.
With phrases like “capacity for labor demand to moderate” and “reducing job openings” code for what has to happen to calm wage inflation, the prospect of a dovish 180 is slim to none. As such, this is bullish for real yields and bearish for the PMs.
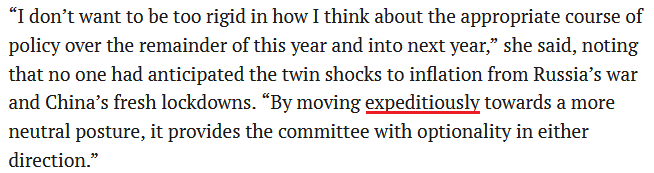
More importantly, notice her use of that all-important buzzword.
 Source: Reuters
And:
 Source: Reuters
Moreover, where do you think she got it?
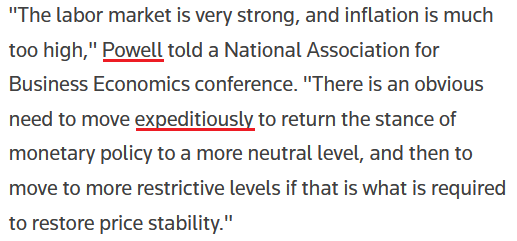 Source: Reuters
For context, Powell said that on Mar. 21. The bottom line? It’s remarkable how the PMs’ fundamentals can deteriorate so rapidly while sentiment remains so optimistic. However, while the Russia-Ukraine conflict keeps the momentum alive, it’s likely a long way down when the war premiums unravel.
Moreover, while real yields and financial conditions imply much lower prices for the PMs, they still have plenty of room to run over the medium term. As a result, while the permabulls may feel invincible, the fundamentals that drove the PMs’ performance over the last 15+ years couldn’t be more bearish.
In conclusion, the PMs rallied on Apr. 12, as momentum runs high across the commodity complex. However, investors either fail to foresee the medium-term consequences of the Fed’s rate hike cycle, or they simply don’t care. Either way, reality should re-emerge over the next few months, and once sentiment shifts, the PMs’ lack of fundamental foundations should result in profound drawdowns.
Technically, gold is still within a zig-zag-shaped correction, which is rather normal given the size of the recent decline.
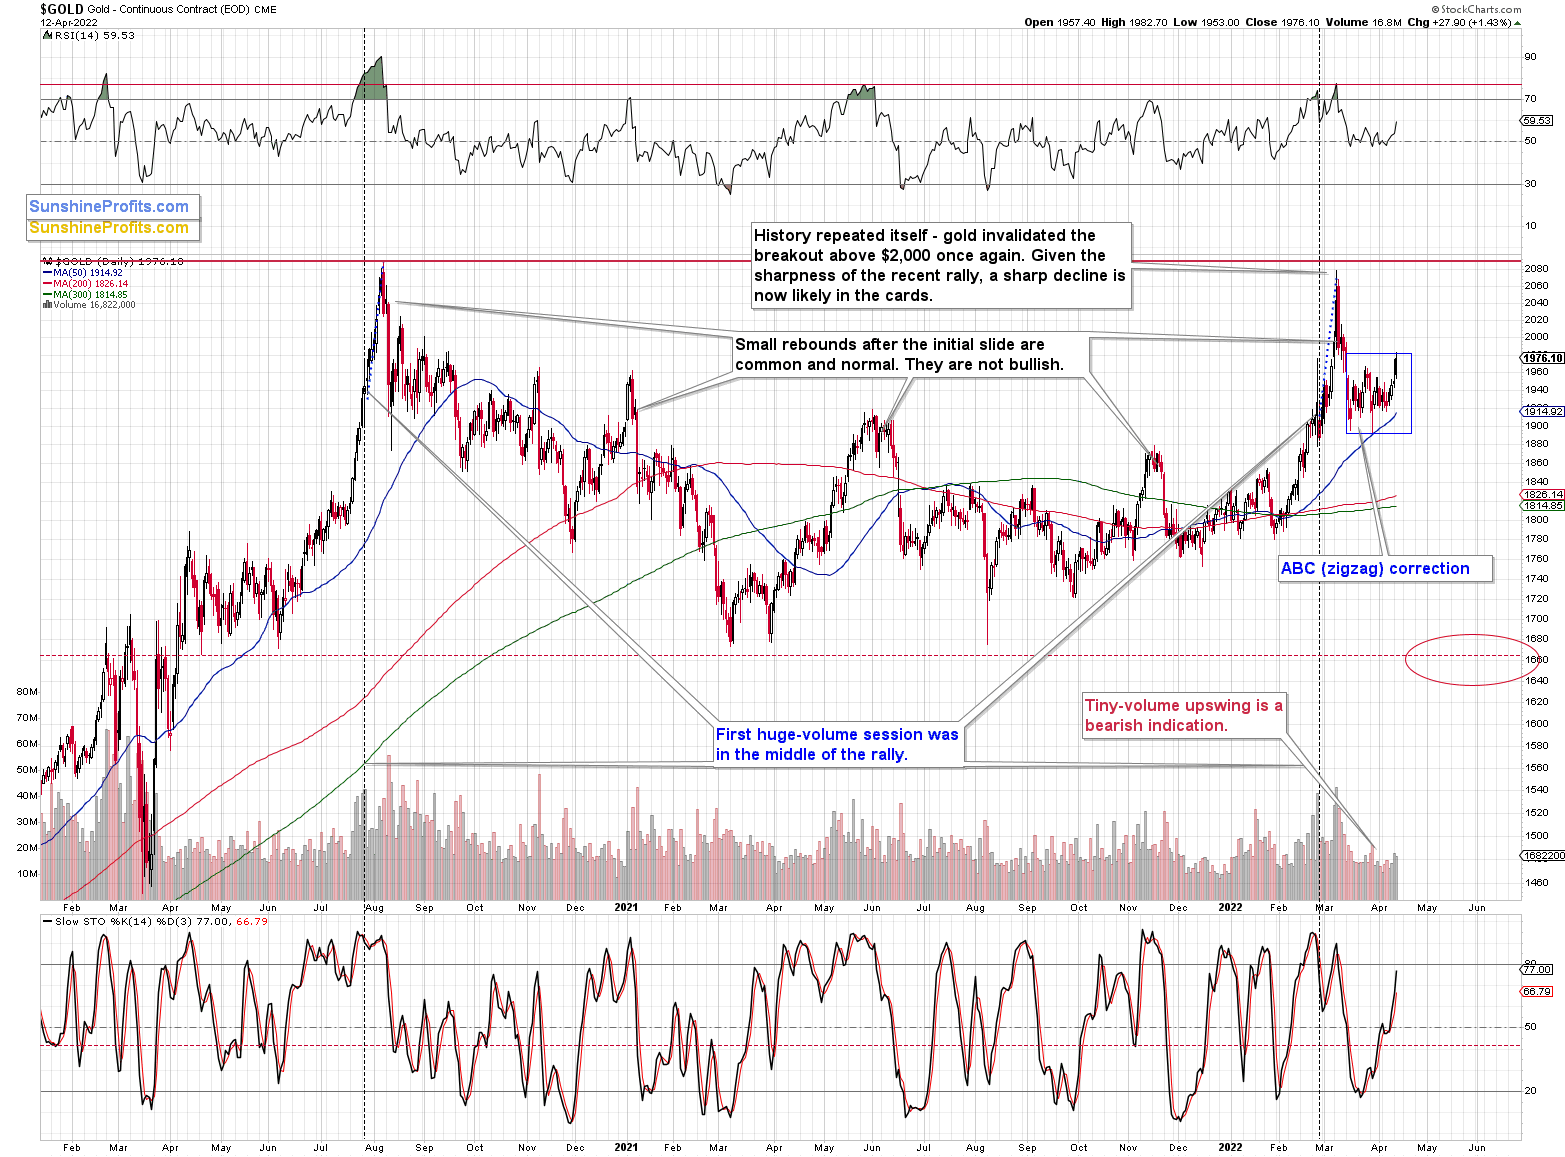
By the way, the correction is still smaller than what we saw in mid-2020. It means that the recent “rally” is well within the range of what could be considered a normal rebound within a bigger decline.
While gold moved above its mid-March high, junior miners moved back to the analogous level and turned down again.
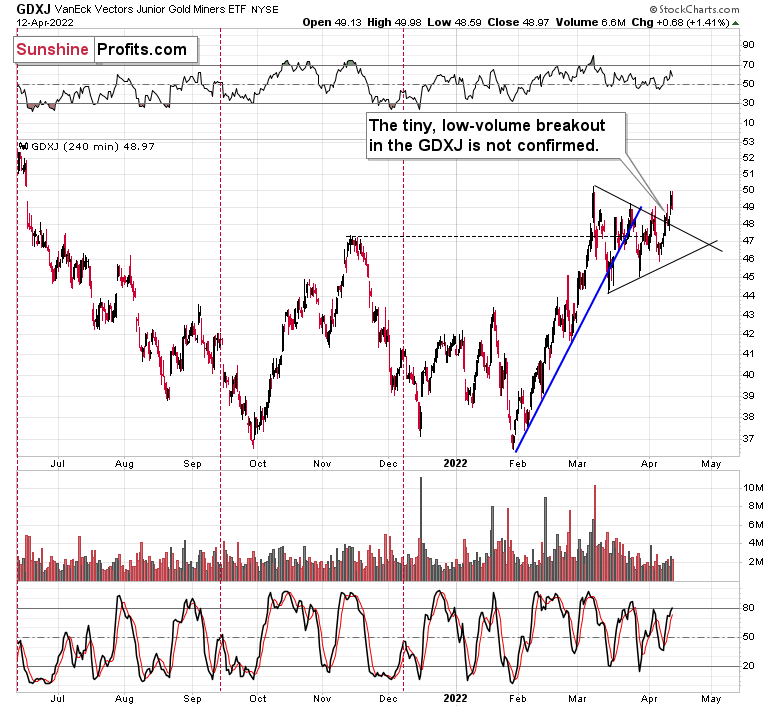
The GDXJ did manage to move above its triangle pattern, but the move took place on relatively low volume, so it’s doubtful whether the GDXJ will be able to hold onto this week’s gains. The daily close below even the late-March intraday high suggests that the rally might be over or very close to being over.
Silver’s very short-term strength also points to this being the likely outcome.
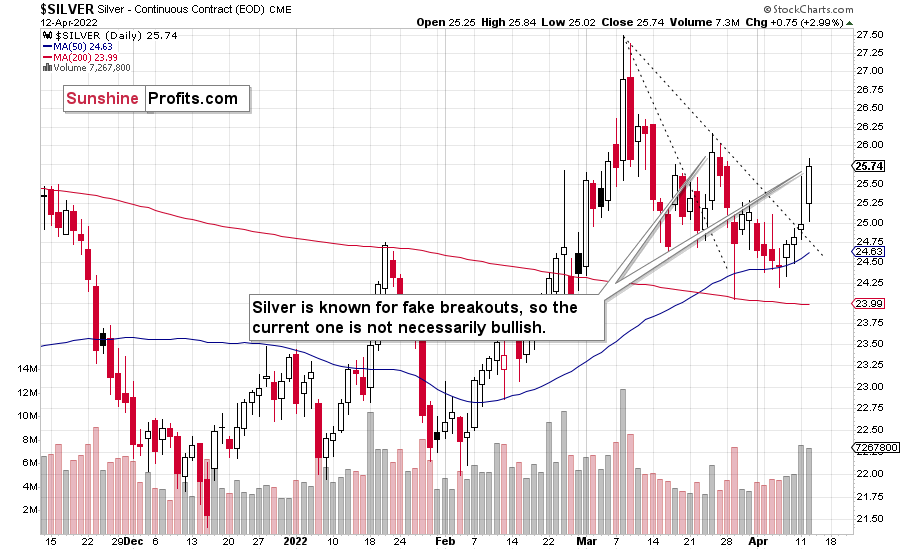
Silver is known for its fake breakouts, so the fact that we just saw one isn’t really bullish. In fact, I wrote about that several days ago – it was possible that it would happen, and it did. It didn’t change the outlook – what we see is in near-perfect tune with what we saw in 2012 – that’s the back-and-forth decline in gold and silver and the consolidation in the mining stocks.
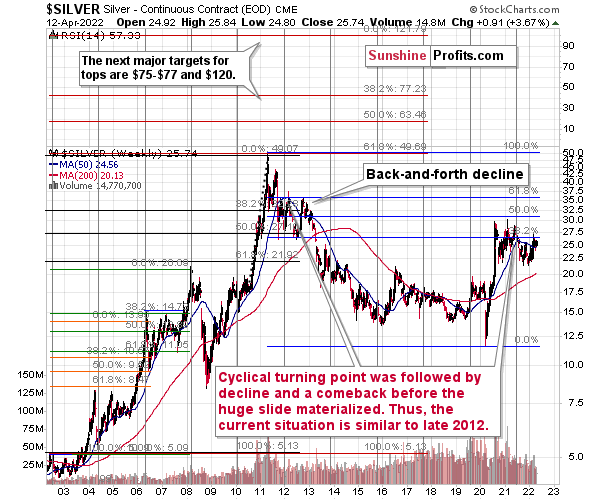
Please note the shape of the early art of the declines that followed the 2012 top in both precious metals. That’s what we’re seeing right now. The recent run-up in silver is likely the “back” part of the “back-and-forth decline” that is being repeated.
Let’s keep in mind that while gold and silver are repeating their 2012 performance, we can spot some analogies in GDXJ too.
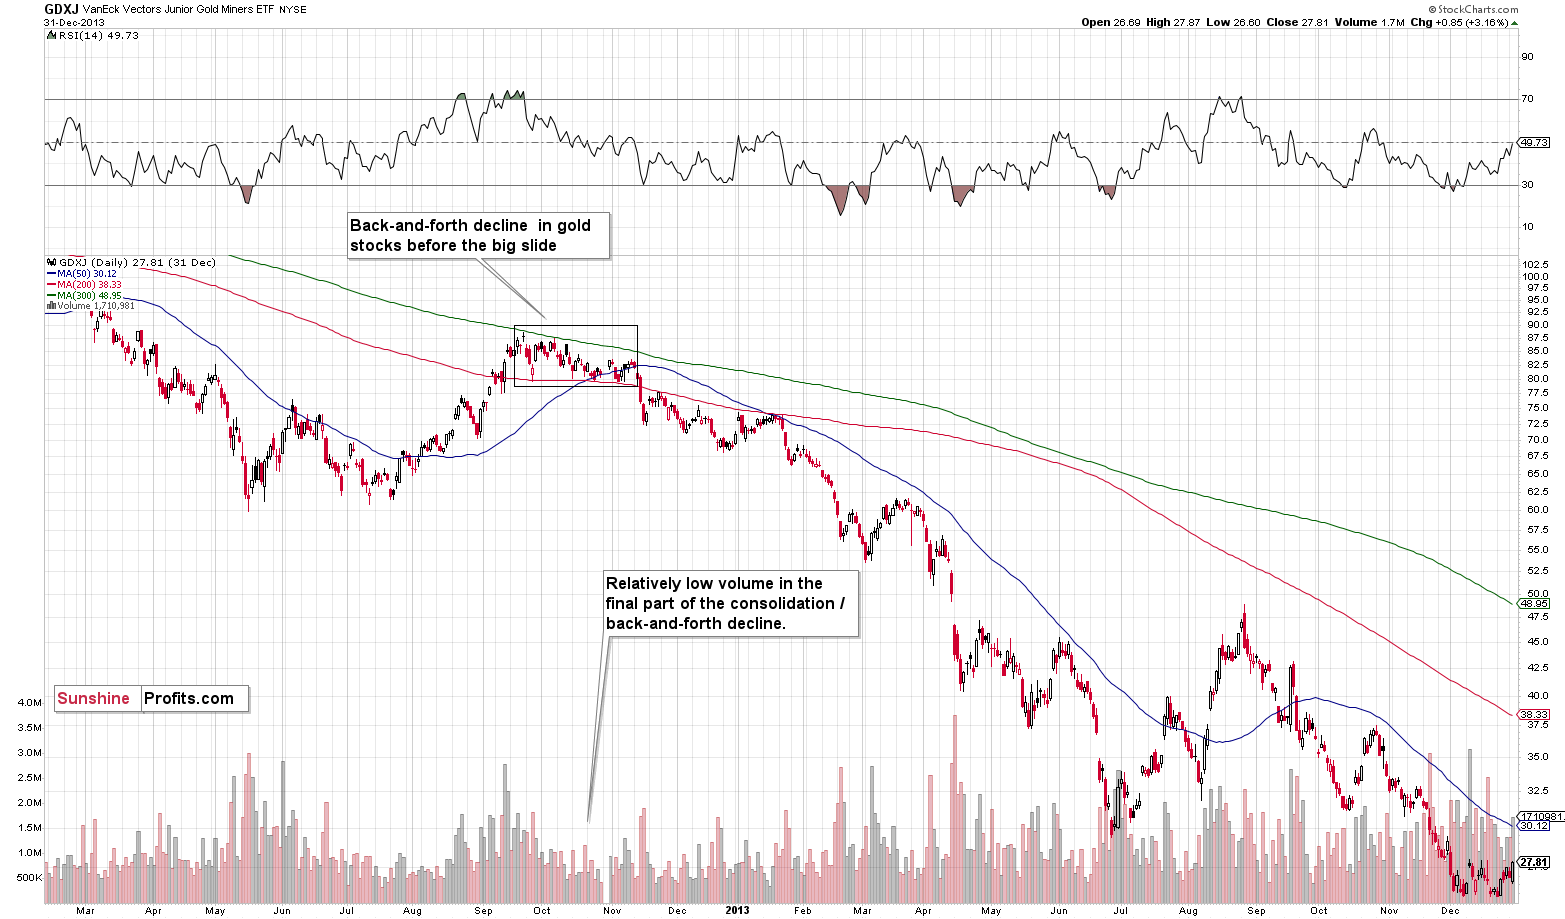
At first, in late-September 2012 and early-October 2012, junior miners consolidated, and then they declined, thus entering the back-and-forth decline mode. It happened on relatively low volume.
Right now, GDXJ is also after a consolidation that’s been taking place on relatively low volume and that followed a rather sizable short-term upswing.
What happened next in 2012?
Well, at the late-2012 top, the GDXJ closed at $87.83. Months later, it closed at $29.59, or roughly one third of its initial price. In other words, junior miners erased about two-thirds of their initial price. Yes, it was a great time for inversely trading instruments. The JDST wasn’t trading at that time yet, but DUST (which trades opposite to GDX) moved up by over 600%.
Even though the short-term outlook is somewhat unclear, the medium-term outlook for the precious metals sector remains very bearish, and the upside potential for the short positions in junior mining stocks remains enormous, in my opinion.
In my view, patience is likely to be very well rewarded.
Overview of the Upcoming Part of the Decline
- It seems to me that the post-decline consolidation is now over or very close to being over , and that gold, silver, and mining stocks are now likely to continue their medium-term decline.
- It seems that the first (bigger) stop for gold will be close to its previous 2021 lows, slightly below $1,800 . Then it will likely correct a bit, but it’s unclear if I want to exit or reverse the current short position based on that – it depends on the number and the nature of the bullish indications that we get at that time.
- After the above-mentioned correction, we’re likely to see a powerful slide, perhaps close to the 2020 low ($1,450 - $1,500).
- If we see a situation where miners slide in a meaningful and volatile way while silver doesn’t (it just declines moderately), I plan to – once again – switch from short positions in miners to short positions in silver. At this time, it’s too early to say at what price levels this could take place, and if we get this kind of opportunity at all – perhaps with gold close to $1,600.
- I plan to exit all remaining short positions once gold shows substantial strength relative to the USD Index while the latter is still rallying. This may be the case with gold close to $1,350 - $1,400. I expect silver to fall the hardest in the final part of the move. This moment (when gold performs very strongly against the rallying USD and miners are strong relative to gold after its substantial decline) is likely to be the best entry point for long-term investments, in my view. This can also happen with gold close to $1,375, but at the moment it’s too early to say with certainty.
- As a confirmation for the above, I will use the (upcoming or perhaps we have already seen it?) top in the general stock market as the starting point for the three-month countdown. The reason is that after the 1929 top, gold miners declined for about three months after the general stock market started to slide. We also saw some confirmations of this theory based on the analogy to 2008. All in all, the precious metals sector is likely to bottom about three months after the general stock market tops.
- The above is based on the information available today, and it might change in the following days/weeks.
You will find my general overview of the outlook for gold on the chart below:
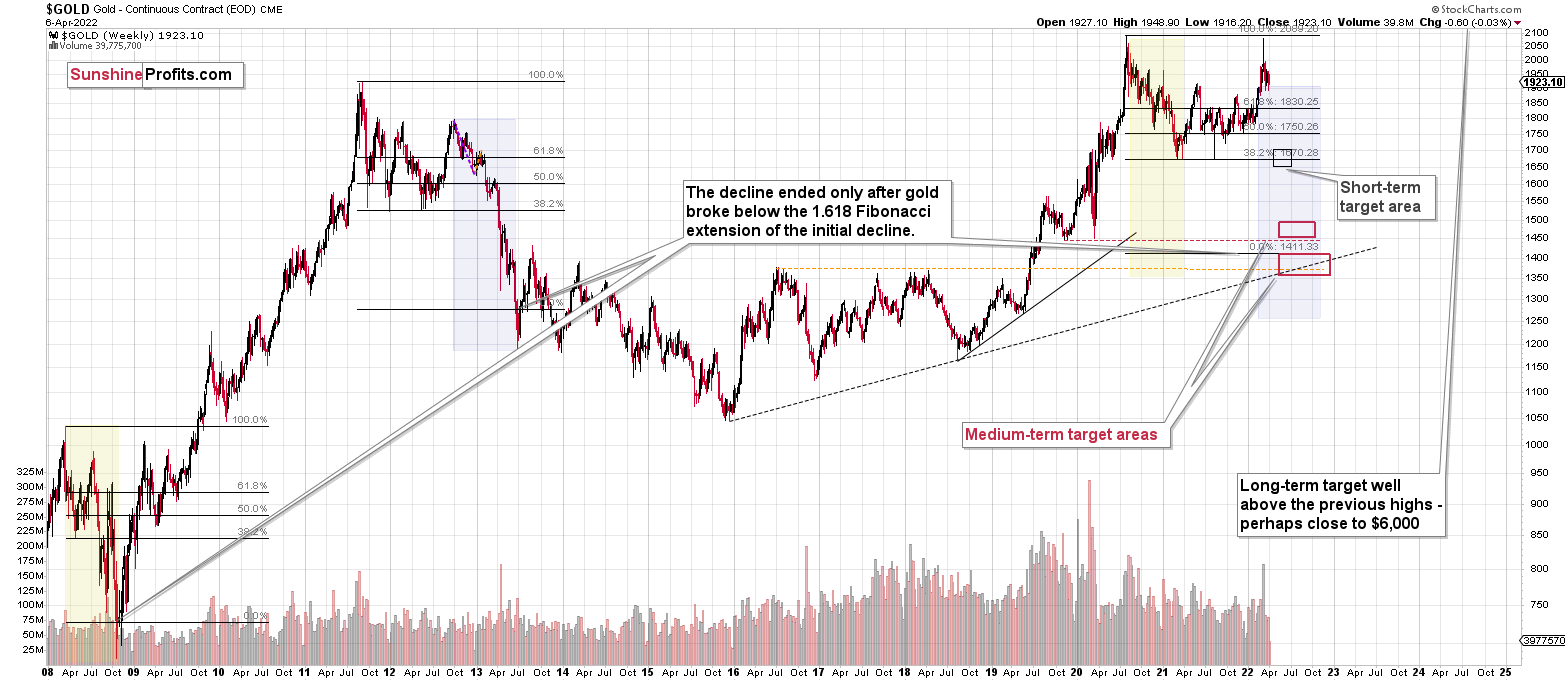
Please note that the above timing details are relatively broad and “for general overview only” – so that you know more or less what I think and how volatile I think the moves are likely to be – on an approximate basis. These time targets are not binding or clear enough for me to think that they should be used for purchasing options, warrants or similar instruments.
Summary
Summing up, despite the recent rally in gold, the outlook for junior mining stocks remains exactly as I described previously.
Crude oil’s extreme outperformance, the stock market’s weakness, and critical medium-term resistance levels reached by gold (all-time high!) and junior mining stocks – all indicate that the tops are at hand or have just formed.
Investing and trading are difficult. If it was easy, most people would be making money – and they’re not. Right now, it’s most difficult to ignore the urge to “run for cover” if you physically don’t have to. The markets move on “buy the rumor and sell the fact.” This repeats over and over again in many (all?) markets, and we have direct analogies to similar situations in gold itself. Junior miners are likely to decline the most, also based on the massive declines that are likely to take place (in fact, they have already started) in the stock markets.
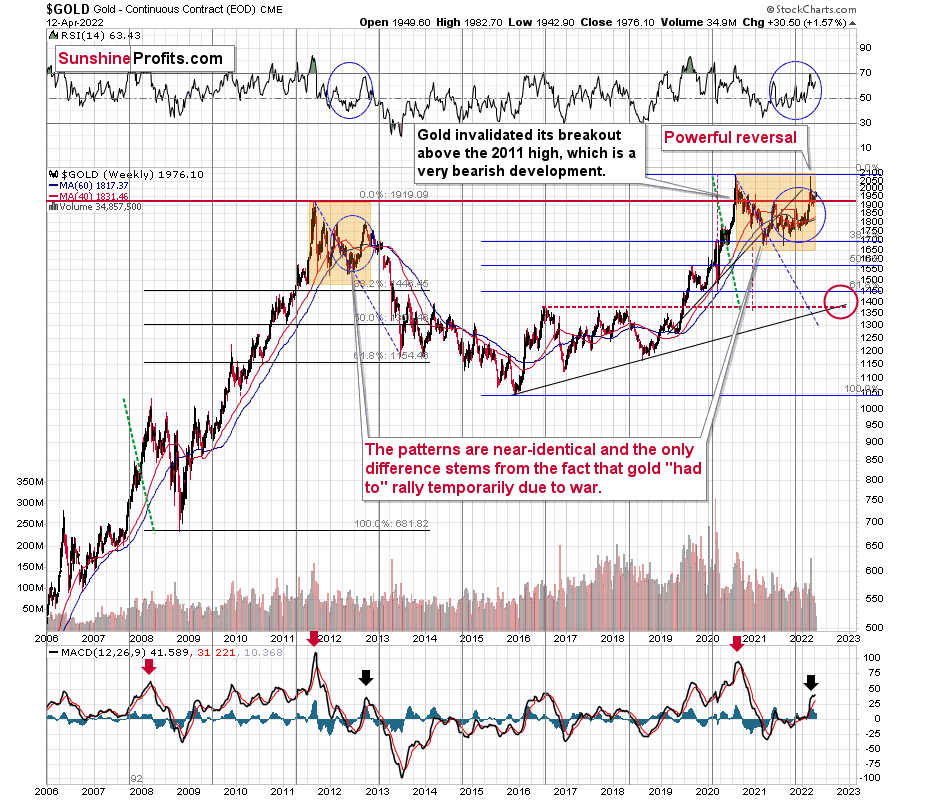
From the medium-term point of view, the two key long-term factors remain the analogy to 2013 in gold and the broad head and shoulders pattern in the HUI Index. They both suggest much lower prices ahead.
It seems that our profits from short positions are going to become truly epic in the coming months.
After the sell-off (that takes gold to about $1,350-$1,500), I expect the precious metals to rally significantly. The final part of the decline might take as little as 1-5 weeks, so it's important to stay alert to any changes.
As always, we'll keep you - our subscribers - informed.
To summarize:
Trading capital (supplementary part of the portfolio; our opinion): Full speculative short positions (300% of the full position) in junior mining stocks are justified from the risk to reward point of view with the following binding exit profit-take price levels:
Mining stocks (price levels for the GDXJ ETF): binding profit-take exit price: $34.63; stop-loss: none (the volatility is too big to justify a stop-loss order in case of this particular trade)
Alternatively, if one seeks leverage, we’re providing the binding profit-take levels for the JDST (2x leveraged) and GDXD (3x leveraged – which is not suggested for most traders/investors due to the significant leverage). The binding profit-take level for the JDST: $14.98; stop-loss for the JDST: none (the volatility is too big to justify a SL order in case of this particular trade); binding profit-take level for the GDXD: $25.48; stop-loss for the GDXD: none (the volatility is too big to justify a SL order in case of this particular trade).
For-your-information targets (our opinion; we continue to think that mining stocks are the preferred way of taking advantage of the upcoming price move, but if for whatever reason one wants / has to use silver or gold for this trade, we are providing the details anyway.):
Silver futures downside profit-take exit price: $19.12
SLV profit-take exit price: $17.72
ZSL profit-take exit price: $38.28
Gold futures downside profit-take exit price: $1,683
HGD.TO – alternative (Canadian) inverse 2x leveraged gold stocks ETF – the upside profit-take exit price: $11.79
HZD.TO – alternative (Canadian) inverse 2x leveraged silver ETF – the upside profit-take exit price: $29.48
Long-term capital (core part of the portfolio; our opinion): No positions (in other words: cash
Insurance capital (core part of the portfolio; our opinion): Full position
Whether you already subscribed or not, we encourage you to find out how to make the most of our alerts and read our replies to the most common alert-and-gold-trading-related-questions.
Please note that we describe the situation for the day that the alert is posted in the trading section. In other words, if we are writing about a speculative position, it means that it is up-to-date on the day it was posted. We are also featuring the initial target prices to decide whether keeping a position on a given day is in tune with your approach (some moves are too small for medium-term traders, and some might appear too big for day-traders).
Additionally, you might want to read why our stop-loss orders are usually relatively far from the current price.
Please note that a full position doesn't mean using all of the capital for a given trade. You will find details on our thoughts on gold portfolio structuring in the Key Insights section on our website.
As a reminder - "initial target price" means exactly that - an "initial" one. It's not a price level at which we suggest closing positions. If this becomes the case (like it did in the previous trade), we will refer to these levels as levels of exit orders (exactly as we've done previously). Stop-loss levels, however, are naturally not "initial", but something that, in our opinion, might be entered as an order.
Since it is impossible to synchronize target prices and stop-loss levels for all the ETFs and ETNs with the main markets that we provide these levels for (gold, silver and mining stocks - the GDX ETF), the stop-loss levels and target prices for other ETNs and ETF (among other: UGL, GLL, AGQ, ZSL, NUGT, DUST, JNUG, JDST) are provided as supplementary, and not as "final". This means that if a stop-loss or a target level is reached for any of the "additional instruments" (GLL for instance), but not for the "main instrument" (gold in this case), we will view positions in both gold and GLL as still open and the stop-loss for GLL would have to be moved lower. On the other hand, if gold moves to a stop-loss level but GLL doesn't, then we will view both positions (in gold and GLL) as closed. In other words, since it's not possible to be 100% certain that each related instrument moves to a given level when the underlying instrument does, we can't provide levels that would be binding. The levels that we do provide are our best estimate of the levels that will correspond to the levels in the underlying assets, but it will be the underlying assets that one will need to focus on regarding the signs pointing to closing a given position or keeping it open. We might adjust the levels in the "additional instruments" without adjusting the levels in the "main instruments", which will simply mean that we have improved our estimation of these levels, not that we changed our outlook on the markets. We are already working on a tool that would update these levels daily for the most popular ETFs, ETNs and individual mining stocks.
Our preferred ways to invest in and to trade gold along with the reasoning can be found in the how to buy gold section. Furthermore, our preferred ETFs and ETNs can be found in our Gold & Silver ETF Ranking.
As a reminder, Gold & Silver Trading Alerts are posted before or on each trading day (we usually post them before the opening bell, but we don't promise doing that each day). If there's anything urgent, we will send you an additional small alert before posting the main one.
Thank you.
Przemyslaw Radomski, CFA
Founder, Editor-in-chief

