

Briefly: in our opinion, full (300% of the regular position size) speculative short positions in junior mining stocks are justified from the risk/reward point of view at the moment of publishing this Alert.
Before I move to the technical part of today’s analysis, I’d like to point to the fact that what I wrote in Monday’s extensive Gold & Silver Trading Alert and yesterday’s Gold & Silver Trading Alert simply remains up-to-date.
There’s one major development that we saw yesterday that I bet practically nobody noticed.
You see, it’s easy to spot the big, loud, obnoxious (?) events on the market, but it’s not that easy to notice when the quietness or calmness gets extreme, and it’s just as important.
Yesterday’s volume in the GDXJ ETF was the lowest that we have seen in recent history (during a daily upswing).
In fact, it’s so low, that in order for you to see just how low it is, I had to add extra (magnified) volume part on the chart below, as otherwise yesterday’s volume bar was barely visible.
(Also, I had to split the chart in two and add it as two pictures, as there were some technical issues with the chart provider today; and otherwise I couldn’t save annotations on the relevant parts of the chart.)
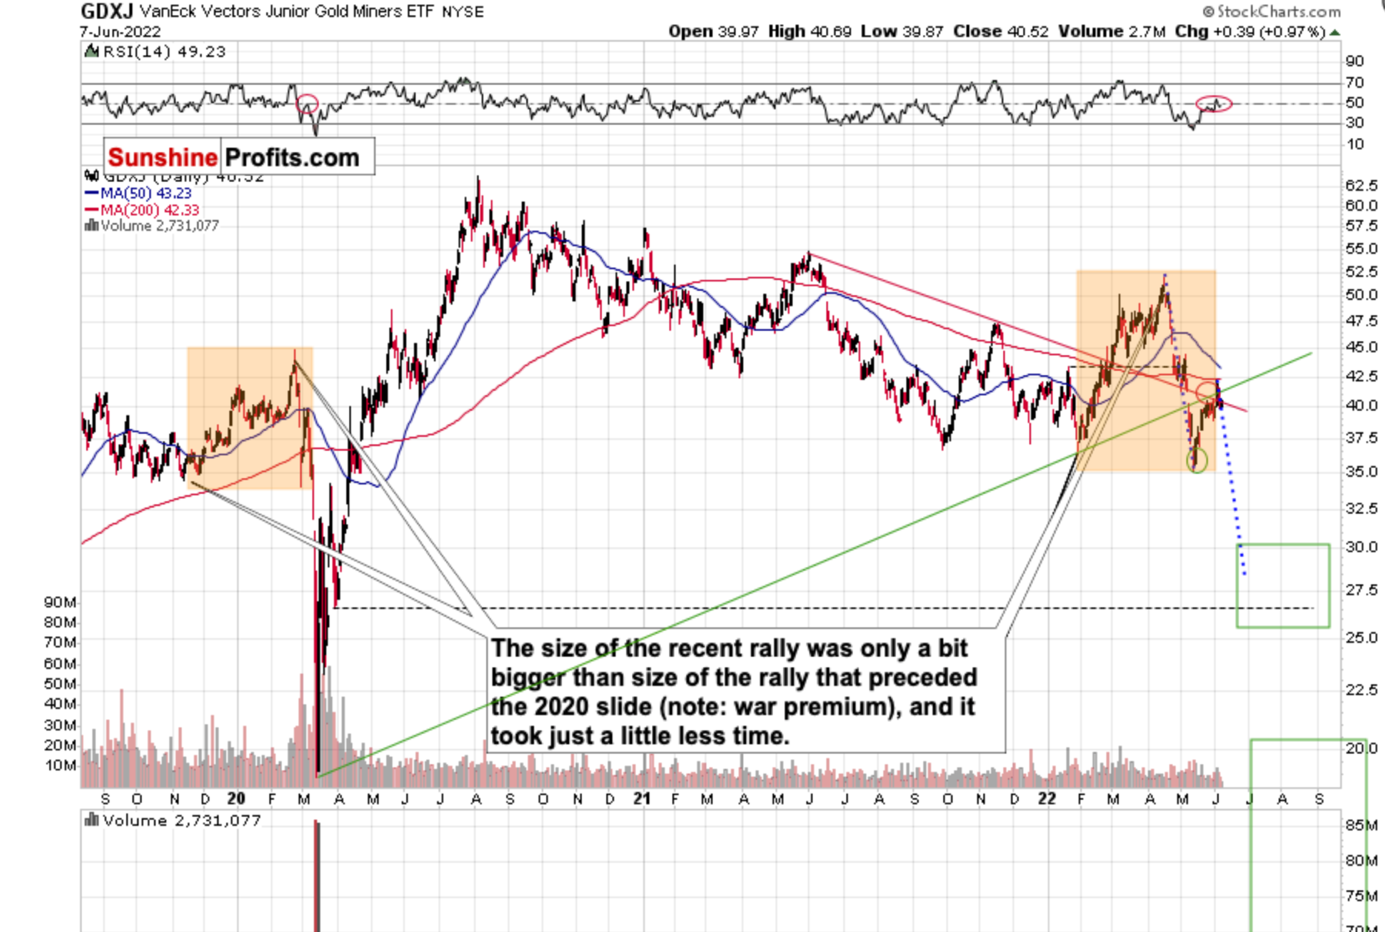
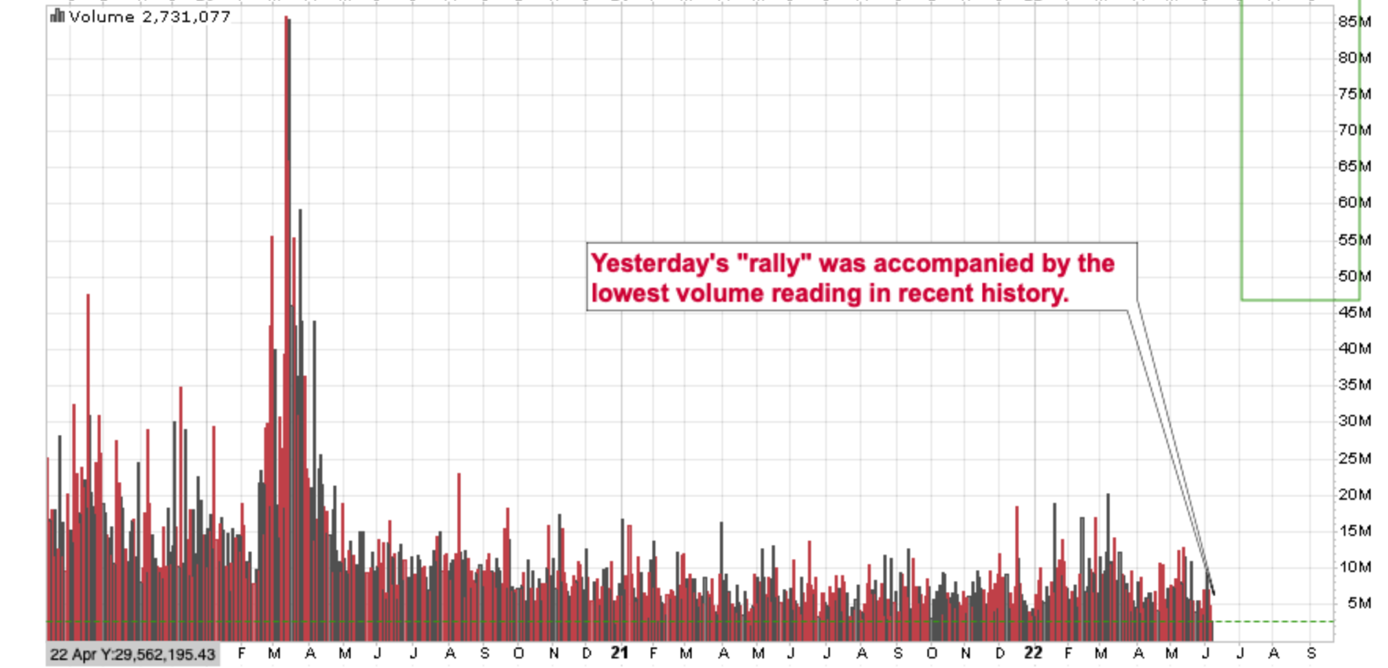
I added a green dashed line on the volume part of the chart, to emphasize just how low yesterday’s volume was – extremely so.
Why would this be important? The very low volume is particularly important when it takes place during a rally. It’s the case because it emphasizes that the buying power is drying up.
The price moved higher yesterday, but not because buyers really overwhelmed sellers.
No.
It happened because both buyers and sellers were mostly absent during yesterday’s session. This would have been a neutral indication if the stock market exchanges kept the price intact when there were no buyers and no sellers. That’s not how exchanges work.
If there are no buyers or sellers, the price will keep declining until the buyers emerge. Yesterday’s session showed that we might be close to the above kind of decline.
Of course, there will always be some buyers, but the point is that there might not be enough of them to support the price at the current levels even without a large number of sellers.
This means that when the sellers join the party, it will be like pouring gasoline on a fire.
Consequently, yesterday’s “silent scream” was very bearish.
And yes, I adjusted the target areas on the above chart, and the lower one is not a mistake. The GDXJ ETF could really drop to $10 or so in the coming months. It’s nothing particularly new, though – it’s in tune with what you saw on the very long-term HUI Index chart that I’ve been featuring for months.
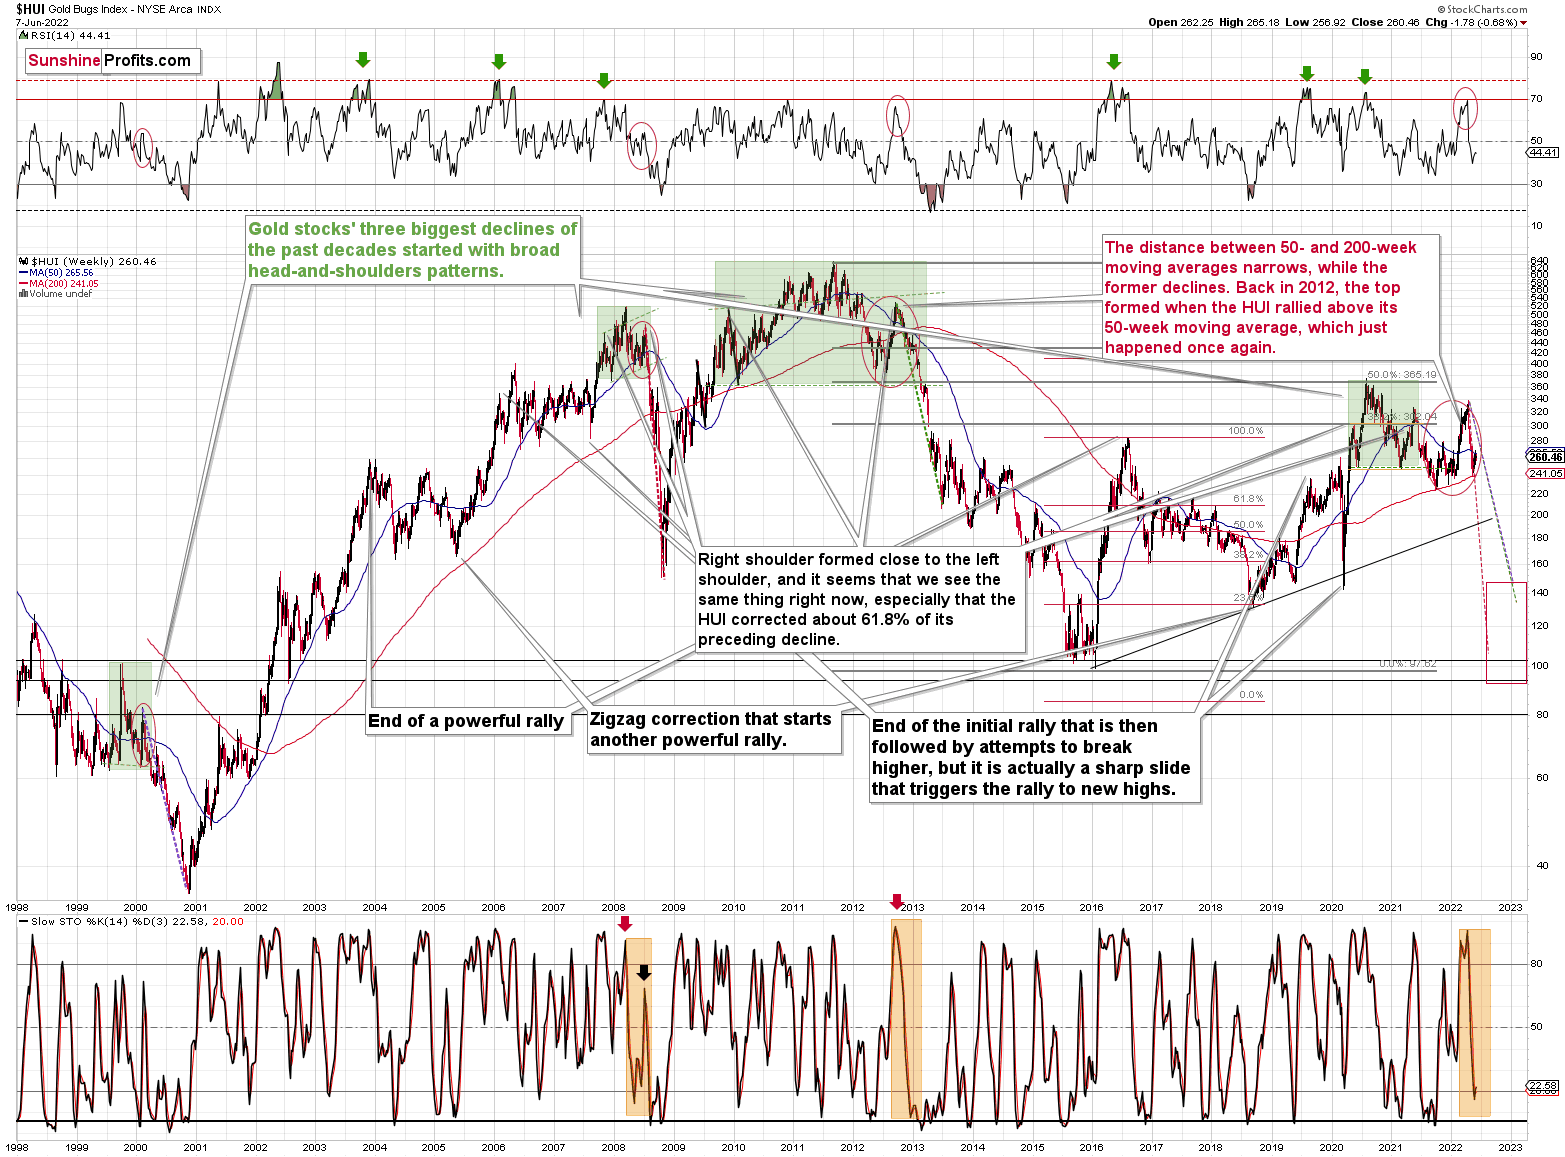
When the HUI drops below the 2020 low, it’s natural for one to expect the GDXJ to do the same thing.
Given that the mining stocks have recently fallen, like they did in 2008, a move below the 2020 lows appears likely. It seems that we might not need to wait for it for too long, either.
Before moving to the fundamental part of today’s analysis, I would like to discuss the issue of a possible “cup and handle pattern,” as I just received a question about it.
On the chart below, I marked a few of the bigger patterns that one might currently be discussing.
Let’s start with the smaller ones in gold. To clarify, they are “smaller” only in comparison to the two other ones, but on a stand-alone basis, they are both large.
The patterns that formed in 2011-2012 and between 2020 and 2022 are similar, and since the former wasn’t followed by higher gold prices, I wouldn’t trust the latter either.
The biggest pattern is the huge cup and handle in gold that started in 2011 and is being continued up to this day. I think this pattern might be valid, but… it doesn’t mean that the “handle” part is already formed. Based on multiple other charts and indications that I’ve been commenting on recently, it seems that the medium-term decline in gold will continue, but it doesn’t go against the huge cup-and-handle pattern. It simply means that the handle can (and likely will) get much bigger.
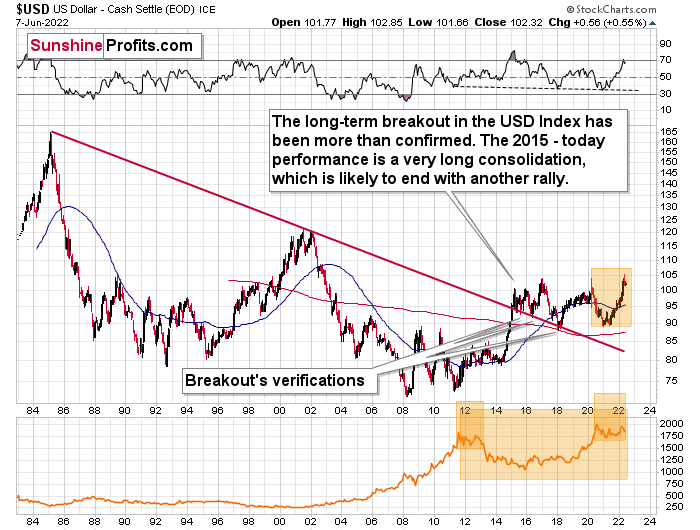
Finally, the 2020 – now performance of the USD Index can be viewed as a cup-and-handle pattern, too. Therefore, once the USD Index breaks above the recent highs, it’s then likely to soar substantially – perhaps by as much as it has already rallied.
This would set a target of about 120.
No, this level is not “unthinkable”.
Remember how everyone and their brother were bearish on the USDX at the beginning of 2021 (while you knew that it was going to soar)? It’s moved about 15 index points since that time! That might have seemed “unthinkable” at that time, too. Still, it happened.
I’ve written this many times in the previous weeks, but it won’t hurt to clarify it once again. In my opinion (just an opinion, of course, I can’t guarantee any kind of performance), this is an epic shorting opportunity that will seem obvious to everyone several months from now. There are myriads of signs, but let’s state the obvious: gold was unable to rally despite the – literally – war in Europe. If that isn’t a screaming sell indication for the precious metals market, I don’t know what is. Still, at this time, very few people realize this. You do, though :)
Having said that, let’s take a look at the markets from a more fundamental angle.
Poke the Bear
With the S&P 500 enjoying a mid-day rally on Jun. 7 and the GDXJ ETF (proxy for junior gold and silver mining stocks) following suit, the bulls warmed up to the idea of a "soft landing." However, with a much higher U.S. federal funds rate needed to cool inflation, the short-term optimism should be short-lived.
To explain, I've noted on numerous occasions that risk-on sentiment often reverberates across multiple markets. Therefore, when stocks bid higher, commodities usually follow, and this increases the Fed's inflation conundrum. As a result, investors' optimism enhances the pricing pressures.
Please see below:
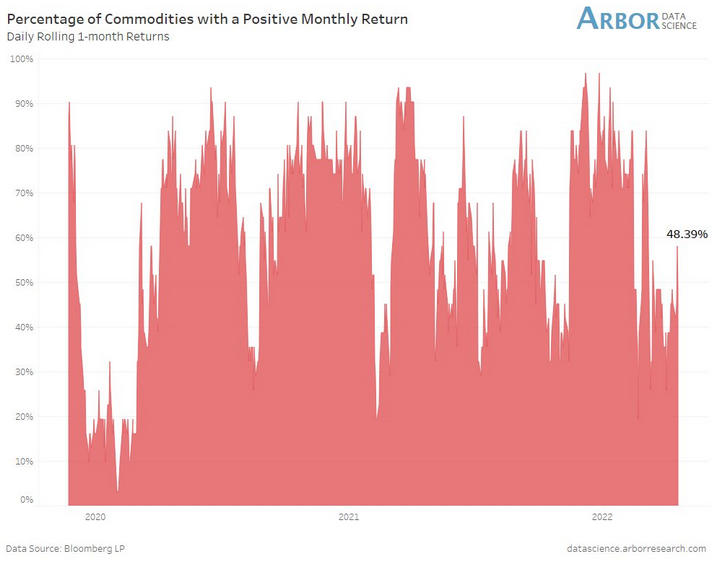
The red bars above track the percentage of commodities experiencing a positive monthly return. If you analyze the right side of the chart, you can see that the negativity in April/May culminated with a smaller percentage of commodities moving higher.
However, the red bar furthest to the right shows that more commodities are rising once again. As a result, if the stock market remains buoyant, the follow-through from commodities will only enhance inflation and elicit more hawkish policy from the Fed.
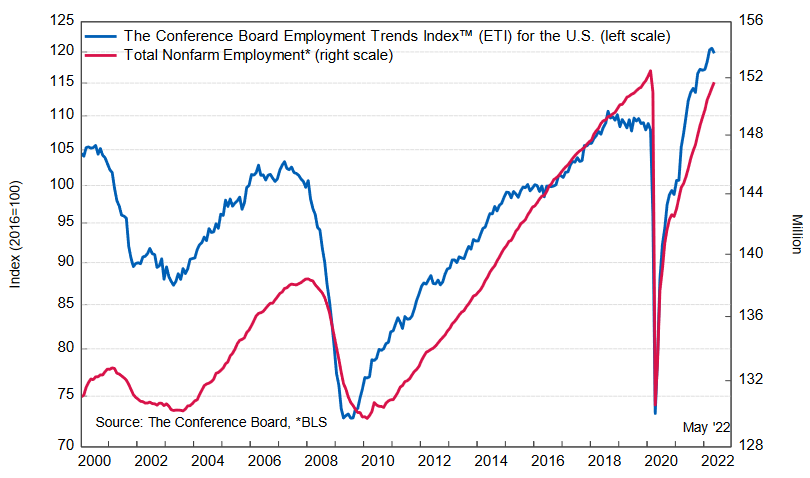
Furthermore, while investors still hope for a dovish pivot, the U.S. labor market remains on solid footing. Thus, the Fed’s dual mandate of price stability and maximum employment points to more hawkish policy in the coming months.
For example, The Conference Board released its Employment Trends Index (ETI) on Jun. 6. The index declined from 120.60 in April (an upward revision) to 119.77 in May. However, all-time highs shouldn’t materialize when the Fed is tightening monetary policy, and the immaterial decline signals there is plenty of work to do to moderate wage inflation.
Agron Nicaj, Associate Economist at The Conference Board, said:
“The Employment Trends Index fell slightly in May, signaling slowing, but positive job growth in the months ahead.... The labor market remains strong amid high inflation and the Federal Reserve is likely to continue its focus on stabilizing prices as a result. A strong response by the Fed risks higher unemployment rates by the end of 2022.”
Please see below:
In addition, while bear market rallies often create doubt among investors, the S&P 500 and the GDXJ ETF are unlikely to maintain their optimism in the months ahead. For example, Morgan Stanley’s Chief U.S. Equity Strategist, Mike Wilson, sees material downside in the summer months.
He told clients that “stocks may rally further in the near term” and “can continue for a few more weeks until the Fed makes it crystal clear they remain hawkish, and earnings revisions fall well into negative territory.” After that, however, he expects the bearish cocktail to “take the S&P toward 3,400 by mid-late August.”
Furthermore, with investors pricing risk like real yields are at all-time lows, I warned on May 19 that we’re likely far from a medium-term bottom. I wrote:
While Fed officials realize that inflation will only subside if commodity and stock prices fall, a near 20% peak-to-trough decline in the S&P 500 still hasn’t spooked market participants. Moreover, while some claim that sentiment is extremely bearish on Wall Street, the reality is that no one fears the Fed.
Please see below:
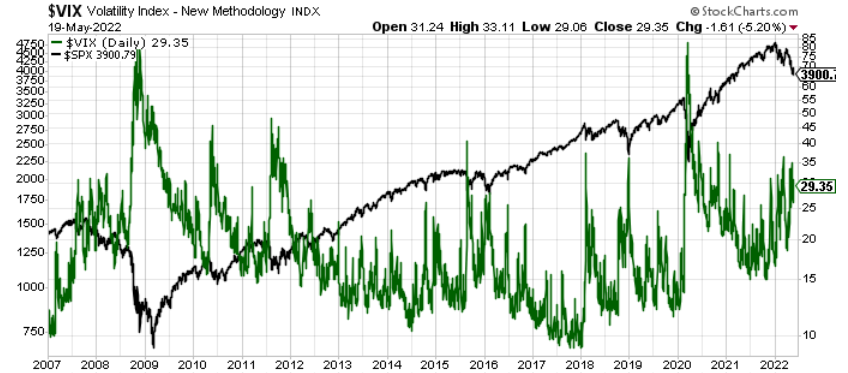
To explain, the black line above tracks the S&P 500, while the green line above tracks the Cboe Volatility Index (VIX). If you analyze the relationship, notice how material spikes in the VIX often mark bottoms for the S&P 500? In a nutshell: when true fear is present, investors rush to buy put options (downside hedges) at any cost, and volatility skyrockets. Therefore, panic is what often creates long-term bottoms.
However, if you analyze the right side of the chart, you can see that the VIX hasn’t even cracked 40 in 2022. Moreover, the VIX has actually declined, even though the S&P 500 remains in free fall. As a result, investors continue to buy call options (upside hedges) as they follow the post-GFC script and await the Fed’s dovish pivot.
Supporting the thesis, Wilson notes that “the price remains wrong with the equity risk premium at 290 [basis points] bps” versus his fair market value of 345 bps. For context, investors discount future earnings/cash flows to determine the appropriate price of a stock, or in this case, the index.
Moreover, when the equity risk premium rises, the discount rate rises, and the asset’s price falls. Thus, with investors still ignoring the risks ahead, a higher discount rate should weigh on the S&P 500 in the coming months.
Likewise, there are many more pieces to the fundamental puzzle. For example, a hawkish Fed is bullish for U.S. real yields and the USD Index. As a result, it’s no surprise that all three moved in tandem in 2022.
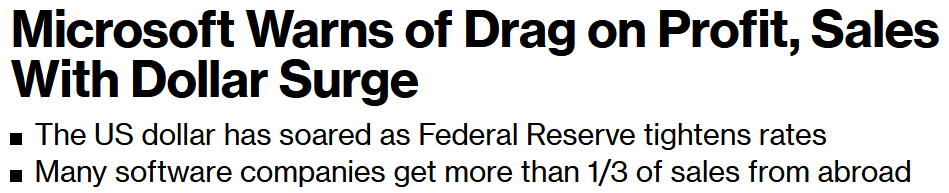
However, earnings revisions – which are upgrades versus downgrades – are negatively correlated to the U.S. dollar. In a nutshell: a rallying greenback reduces foreign demand for S&P 500 companies’ products and dampens their currency-adjusted earnings. For example, Microsoft warned about the dynamic on Jun. 2.
Please see below:
 Source: Bloomberg
Therefore, Wilson expects more S&P 500 companies to fall victim to the dollar’s wrath.
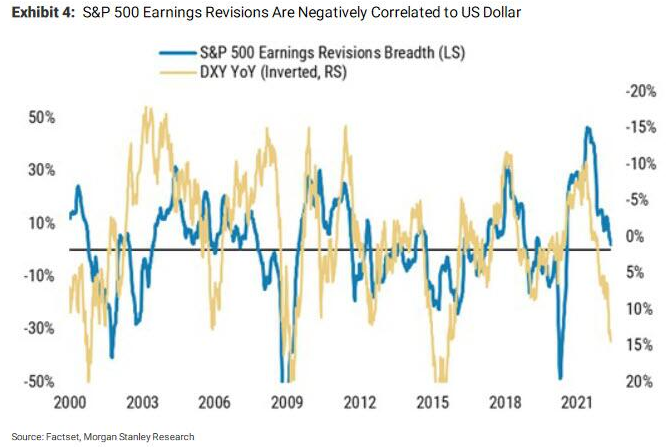
To explain, the blue line above tracks the S&P 500’s earnings revision breadth (the spread of upgrades minus downgrades), while the gold line above tracks the inverted year-over-year (YoY) percentage change in the USD Index. For context, inverted means the latter’s scale is flipped upside down, and a falling gold line represents a rising USD Index.
If you analyze the relationship, you can see that sharp YoY percentage increases in the USD Index often lead to sharp negative revisions in earnings expectations. Moreover, if you focus your attention on the right side of the chart, you can see that the gold line has declined materially, which implies plenty more downward earnings revisions in the months ahead.
Likewise, when you combine the ominous data with two more likely 50 basis point rate hikes in June and July, it’s understandable why Wilson expects the S&P 500 to hit 3,400 before September.
Also noteworthy, seasonal factors point to more earnings woes in the coming months.
Please see below:
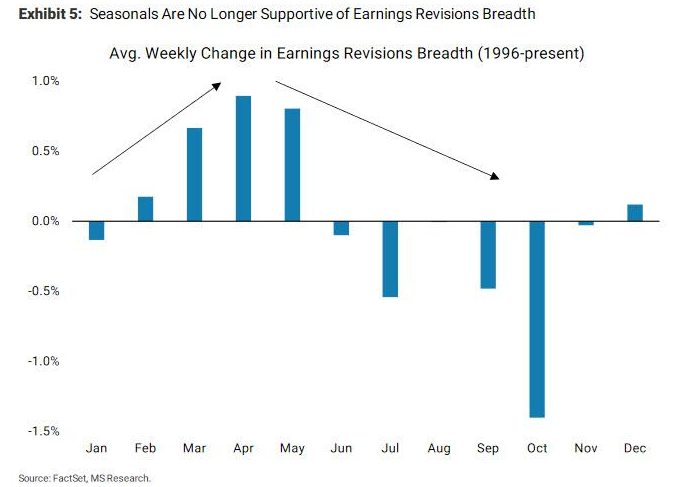
To explain, the blue bars above track the average percentage change in earnings revision breadth since 1996. If you analyze the left side of the chart, you can see that earnings estimates tend to increase leading up to late spring/early summer. However, once the economic boost of warmer weather fades, revisions tend to turn negative as analysts make their fall and winter projections.
For context, analysts and markets are forward-looking. So, the upward revisions in February, March, April, etc. reflect expected performance three and six months later. Likewise, the downward revisions in July, September, October, etc. also reflect expected performance three and six months later. Therefore, with the peak summer months soon to be here and gone, bearish estimates for fall and winter should materialize.
On top of that, I’ve been warning for some time that the U.S. 10-Year real yield would rise in 2022. Moreover, while the metric consolidates in the 0.20% to 0.30% range, the Fed needs higher real yields to curb inflation. As such, further progress should weigh heavily on the S&P 500 and the PMs.
Please see below:
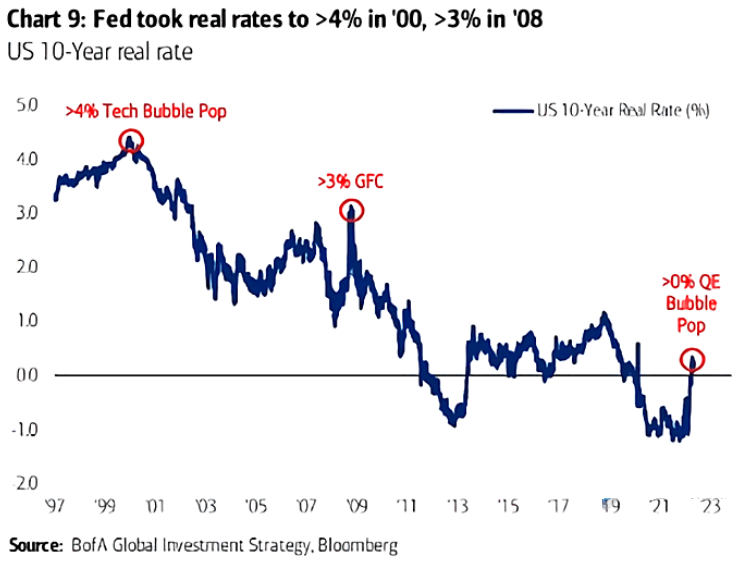
To explain, the blue line above tracks the U.S. 10-Year real yield. If you analyze the annotations, you can see that a higher U.S. 10-Year real yield coincided with the popping of the 2000 dot-com and the 2008 housing bubbles. However, inflation was lower during both of those calamities. As a result, the Fed confronts a more sinister problem today.
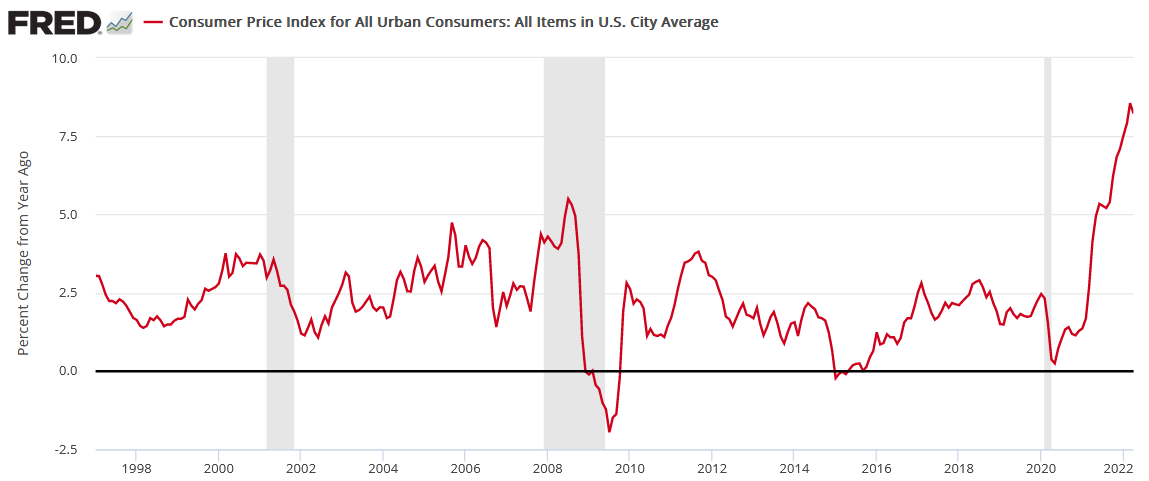
If we line up the dates, the chart below shows that both recessions were preceded by much lower inflation, and therefore, the Fed could pacify investors. In contrast, the U.S. 10-Year real yield is completely out of whack with the current inflation rate. As a result, the Fed needs a miracle to achieve a “soft landing.”
The bottom line? Short-term traders don’t care about fundamentals, and their actions can keep asset prices uplifted for days or weeks. However, fundamental realities always come to bear, and troubling economic developments are not fixed through wishes or words. Therefore, while investors hold on to the idea that things are fine now, history shows that severe shocks should dominate the headlines as the Fed attempts to rein in inflation.
In conclusion, the PMs rallied on Jun. 7, as old habits die hard and the ‘buy the dip’ crowd was out in full force. However, with higher real yields and a stronger USD Index poised to keep the pressure on the S&P 500 and the PMs, lower highs and lower lows should confront the pair over the medium term.
Overview of the Upcoming Part of the Decline
- It seems to me that the short-term rally in the precious metals market is either over or very close to being over. It’s so close to being over that I think it’s already a good idea to be shorting junior mining stocks.
- We’re likely to (if not immediately, then soon) see another big slide, perhaps close to the 2021 lows ($1,650 - $1,700).
- If we see a situation where miners slide in a meaningful and volatile way while silver doesn’t (it just declines moderately), I plan to – once again – switch from short positions in miners to short positions in silver. At this time, it’s too early to say at what price levels this could take place and if we get this kind of opportunity at all – perhaps with gold prices close to $1,600.
- I plan to exit all remaining short positions once gold shows substantial strength relative to the USD Index while the latter is still rallying. This may be the case with gold close to $1,400. I expect silver to fall the hardest in the final part of the move. This moment (when gold performs very strongly against the rallying USD and miners are strong relative to gold after its substantial decline) is likely to be the best entry point for long-term investments, in my view. This can also happen with gold close to $1,400, but at the moment it’s too early to say with certainty.
- The above is based on the information available today, and it might change in the following days/weeks.
You will find my general overview of the outlook for gold on the chart below:
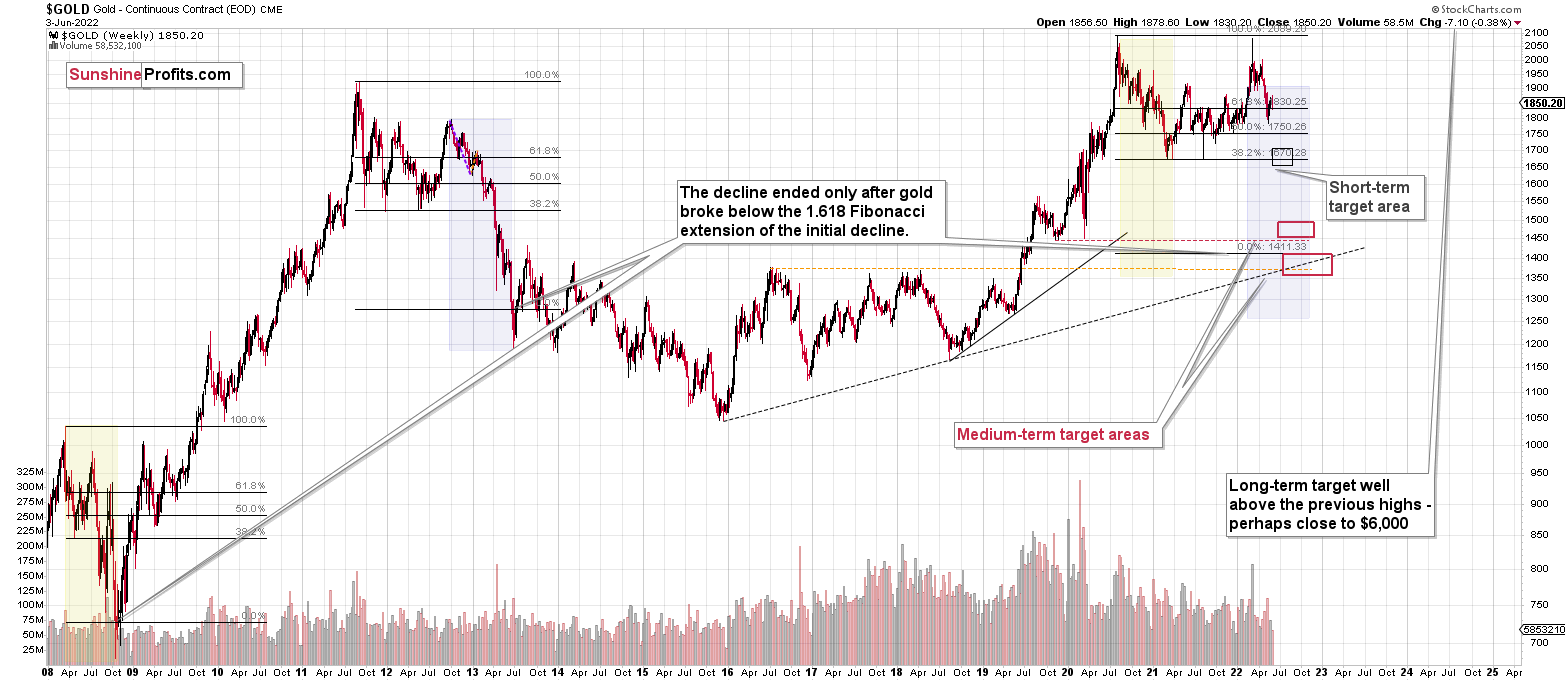
Please note that the above timing details are relatively broad and “for general overview only” – so that you know more or less what I think and how volatile I think the moves are likely to be – on an approximate basis. These time targets are not binding or clear enough for me to think that they should be used for purchasing options, warrants, or similar instruments.
Summary
Summing up, it seems to me that the short-term rally in the precious metals market is either over or close to being over. In fact, it’s so close to being over that I think it’s already a good idea to be shorting junior mining stocks.
I previously wrote that the profits from the previous long position (congratulations once again) were likely to further enhance the profits on this huge decline, and that’s exactly what happened. The profit potential with regard to the upcoming gargantuan decline remains huge.
As investors are starting to wake up to reality, the precious metals sector (particularly junior mining stocks) is declining sharply. Here are the key aspects of the reality that market participants have ignored:
- rising real interest rates,
- rising USD Index values.
Both of the aforementioned are the two most important fundamental drivers of the gold price. Since neither the USD Index nor real interest rates are likely to stop rising anytime soon (especially now that inflation has become highly political), the gold price is likely to fall sooner or later. Given the analogy to 2012 in gold, silver, and mining stocks, “sooner” is the more likely outcome.
After the final sell-off (that takes gold to about $1,350-$1,500), I expect the precious metals to rally significantly. The final part of the decline might take as little as 1-5 weeks, so it's important to stay alert to any changes.
As always, we'll keep you – our subscribers – informed.
To summarize:
Trading capital (supplementary part of the portfolio; our opinion): Full speculative short positions (300% of the full position) in junior mining stocks are justified from the risk to reward point of view with the following binding exit profit-take price levels:
Mining stocks (price levels for the GDXJ ETF): binding profit-take exit price: $27.32; stop-loss: none (the volatility is too big to justify a stop-loss order in case of this particular trade)
Alternatively, if one seeks leverage, we’re providing the binding profit-take levels for the JDST (2x leveraged). The binding profit-take level for the JDST: $19.87; stop-loss for the JDST: none (the volatility is too big to justify a SL order in case of this particular trade).
For-your-information targets (our opinion; we continue to think that mining stocks are the preferred way of taking advantage of the upcoming price move, but if for whatever reason one wants / has to use silver or gold for this trade, we are providing the details anyway.):
Silver futures downside profit-take exit price: $17.22
SLV profit-take exit price: $16.22
ZSL profit-take exit price: $41.87
Gold futures downside profit-take exit price: $1,706
HGD.TO – alternative (Canadian) 2x inverse leveraged gold stocks ETF – the upside profit-take exit price: $11.87
HZD.TO – alternative (Canadian) 2x inverse leveraged silver ETF – the upside profit-take exit price: $31.87
Long-term capital (core part of the portfolio; our opinion): No positions (in other words: cash)
Insurance capital (core part of the portfolio; our opinion): Full position
Whether you’ve already subscribed or not, we encourage you to find out how to make the most of our alerts and read our replies to the most common alert-and-gold-trading-related-questions.
Please note that we describe the situation for the day that the alert is posted in the trading section. In other words, if we are writing about a speculative position, it means that it is up-to-date on the day it was posted. We are also featuring the initial target prices to decide whether keeping a position on a given day is in tune with your approach (some moves are too small for medium-term traders, and some might appear too big for day-traders).
Additionally, you might want to read why our stop-loss orders are usually relatively far from the current price.
Please note that a full position doesn't mean using all of the capital for a given trade. You will find details on our thoughts on gold portfolio structuring in the Key Insights section on our website.
As a reminder - "initial target price" means exactly that - an "initial" one. It's not a price level at which we suggest closing positions. If this becomes the case (as it did in the previous trade), we will refer to these levels as levels of exit orders (exactly as we've done previously). Stop-loss levels, however, are naturally not "initial", but something that, in our opinion, might be entered as an order.
Since it is impossible to synchronize target prices and stop-loss levels for all the ETFs and ETNs with the main markets that we provide these levels for (gold, silver and mining stocks - the GDX ETF), the stop-loss levels and target prices for other ETNs and ETF (among other: UGL, GLL, AGQ, ZSL, NUGT, DUST, JNUG, JDST) are provided as supplementary, and not as "final". This means that if a stop-loss or a target level is reached for any of the "additional instruments" (GLL for instance), but not for the "main instrument" (gold in this case), we will view positions in both gold and GLL as still open and the stop-loss for GLL would have to be moved lower. On the other hand, if gold moves to a stop-loss level but GLL doesn't, then we will view both positions (in gold and GLL) as closed. In other words, since it's not possible to be 100% certain that each related instrument moves to a given level when the underlying instrument does, we can't provide levels that would be binding. The levels that we do provide are our best estimate of the levels that will correspond to the levels in the underlying assets, but it will be the underlying assets that one will need to focus on regarding the signs pointing to closing a given position or keeping it open. We might adjust the levels in the "additional instruments" without adjusting the levels in the "main instruments", which will simply mean that we have improved our estimation of these levels, not that we changed our outlook on the markets. We are already working on a tool that would update these levels daily for the most popular ETFs, ETNs and individual mining stocks.
Our preferred ways to invest in and to trade gold along with the reasoning can be found in the how to buy gold section. Furthermore, our preferred ETFs and ETNs can be found in our Gold & Silver ETF Ranking.
As a reminder, Gold & Silver Trading Alerts are posted before or on each trading day (we usually post them before the opening bell, but we don't promise doing that each day). If there's anything urgent, we will send you an additional small alert before posting the main one.
Thank you.
Przemyslaw Radomski, CFA
Founder, Editor-in-chief

