

Briefly: in our opinion, full (300% of the regular position size) speculative short positions in junior mining stocks (GDXJ) are justified from the risk/reward point of view at the moment of publishing this Alert.
Some might consider an additional (short) position in the FCX.
You do. At least if you want to catch the really big and really profitable moves, and not only the small ones. Let me explain.
The accuracy of the RSI (Relative Strength Index) for gold and mining stocks is quite notable. In fact, it’s more than that – it’s a very good indicator for both related markets. Some might even say that once you pay attention to RSI, other techniques of analyzing the market become obsolete.
Is it really true, though? The opening part of today’s analysis seems to suggest otherwise. Let’s check.
Now, before I proceed with featuring the gold chart, I’d like to emphasize that I will not be conducting the full analysis of RSI here. I will focus on the buy signals and not on the sell ones. Gold has been declining in recent days, so the question that many investors will soon be asking is when gold is going to finally bottom.
While I’m not questioning RSI’s usefulness in general, I am questioning it in case of bigger price moves, in particular in case of bigger declines. The biggest declines of the past decades took place in 2008 and 2013. Let’s see how well one would fare if they relied only on the RSI as a buying indication (with RSI moving below 30 being the signal).
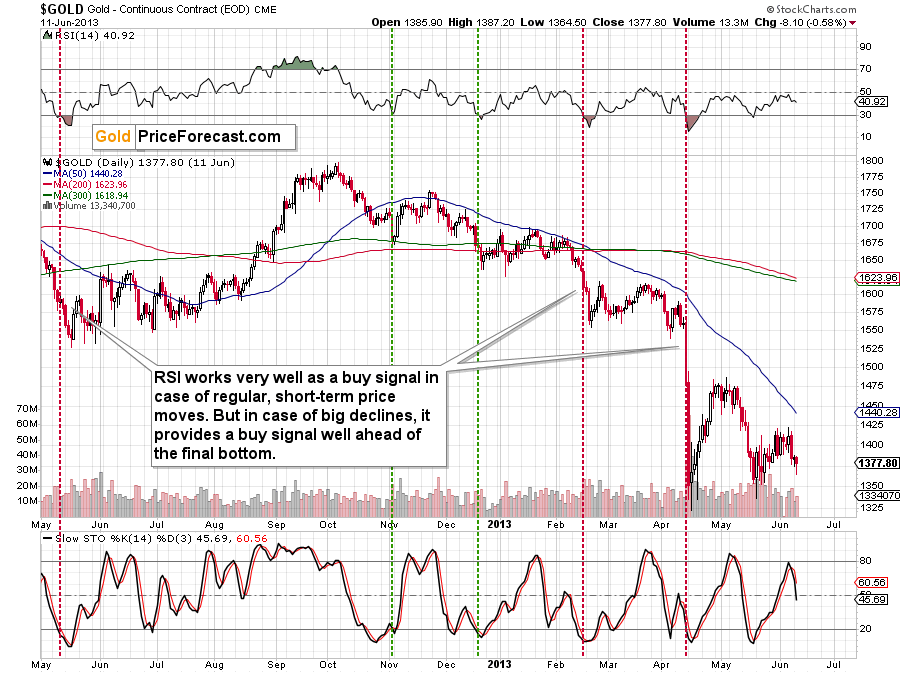
During the 2013 decline itself, we saw this important buy signal twice – in February and in April. And what happened then? Gold kept on declining – it was not a buy signal at all. In particular, the April buy signal was exceptionally misleading.
In the case of the 2012 performance since May, gold-based RSI flashed its buy signal three times, and it was a buy signal in two cases, and it was followed by a short-term decline in the remaining case.
Overall, RSI wasn’t really useful in the 2012-2013 period. In particular, the fact that it would have made one buy right before the slide makes it a poor candidate to time the really critical market bottoms. At least when the RSI is based on the daily prices, as that’s what we’re considering here.
Was the accuracy better in 2008?
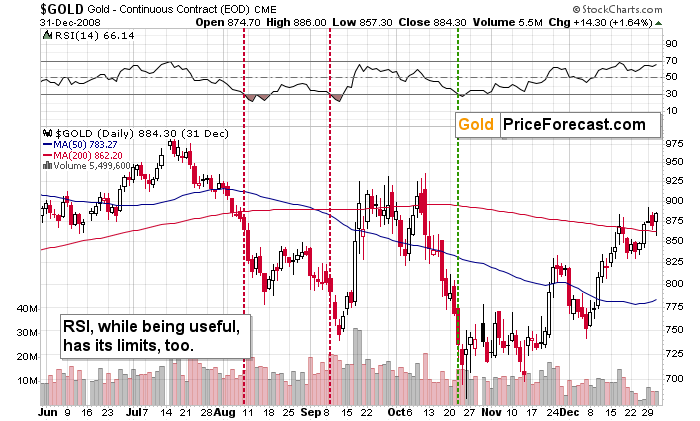
This time, RSI was able to pinpoint the final bottom in October 2008, but it failed to pinpoint the bottom in August and September.
In particular, the very first buy signal seen in August is disappointing.
Why? Because if people buy right after the first buy signal, they are unlikely to sell later in order to buy-back at even lower prices (being convinced that the bottom is already in). Not to mention shorting and profiting on the decline in this way. So, in a way, the first failed buy signal makes the final buy signal relatively unimportant.
The sad reality was the same in both cases:
In case of big price declines in gold, looking at RSI alone might make one make wrong trading decisions. The same goes for other techniques that focus on short-term price moves.
Consequently, if there are indications that what’s about to happen is not just a regular short-term thing but actually a big, medium-term price swing, then one would be much better off focusing on many more indications than just the RSI.
Now, are we in this kind of situation in gold?
Of course we are!
Last week’s enormous reversal and invalidation of the move to new all-time highs was a breathtaking event of extreme importance. Those kinds of indications are unlikely to be followed by small, unimportant declines. No. Something bigger is looming. And in this case, one needs an analysis that is more in-depth than just a single indicator or two of them.
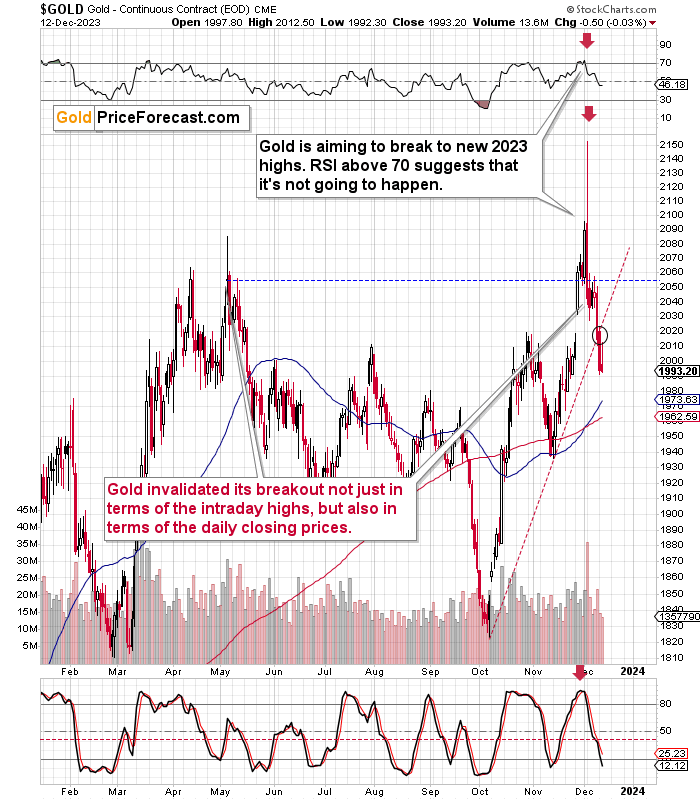
Gold has just verified its breakdown below the rising, red support line by moving back up and then down again. And it was right after gold invalidated its attempt to move to new all-time highs.
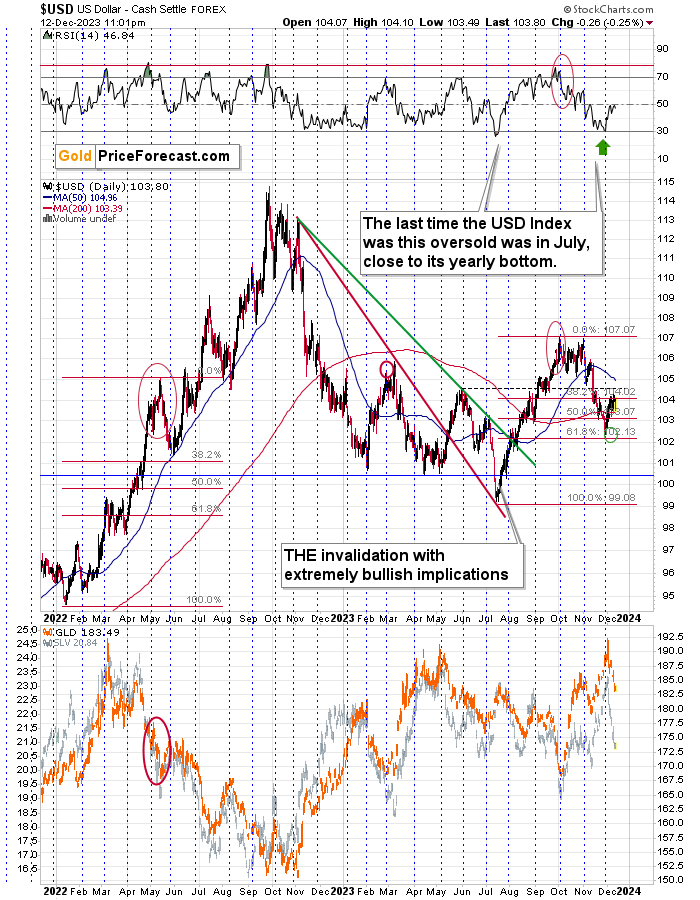
The above happened while the USD Index moved a bit lower! If gold wasn’t strong enough to invalidate the breakdown with USD’s help, then it’s clear that gold really wants to decline further.
And while gold declines more, RSI at 30 may or may not help to pinpoint the next buying opportunity.
Now, if we see RSI at or below 30 in both gold and miners, and we get some other buy signals, then RSI’s help will be very useful. My point is that it’s not a good idea to focus solely on RSI while ignoring other important indications.
Let’s move to gold’s sister metal – silver.
On Dec. 6, 2023, I wrote the following:
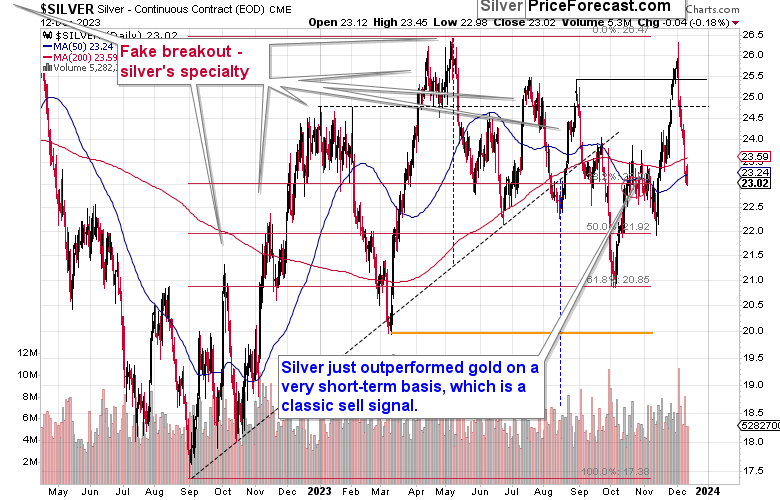
Remember when I wrote that silver was known for fake breakouts, and that its move above the early January 2023 high was likely to be invalidated?
That’s exactly what we just saw. The white metal went back below this year’s highs. And you know what happened next in each previous case after this happened? Silver price plunged.
The first pause was at about $23. That’s where we might see some short-term support also this time, but if gold moves below its rising support line, silver is likely to slide as well. In consequence, silver’s pause is unlikely to be anything more than just that. Not a major bottom, not the start of a new, powerful rally, but a pause.
The yesterday’s intraday low in silver was $22.98 – quite close to the above-mentioned “about $23”. The implications remain as about a week ago – silver might pause here, but I don’t expect a profound rebound just yet.
On Dec. 4, after the GDXJ closed at $39.44, I wrote the following about this ETF:
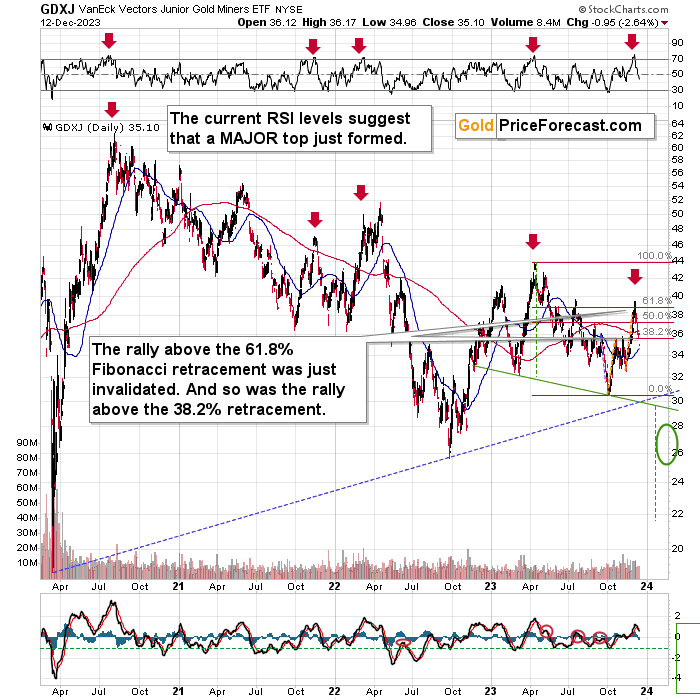
The RSI indicator moved well above the 70 level and this is something that happens very rarely. I zoomed out the chart that I usually feature, so that we can see all the key moments in the recent history when we saw something like that.
I marked those moments with red arrows.
Yes, that’s exactly how the 2020 top formed – with RSI well above 70. Also, let’s keep in mind that the GDXJ ETF top formed at about $62.
Since 2020, we saw this massive sell signal from the RSI four more times. Three times it accompanied major tops, including the 2023 top. The 2022 signal took place shortly before the 2022 top.
The fourth time when we saw this massive sell signal from the RSI based on the GDXJ ETF is right now.
Is this time any different?
There’s a small chance that it might be different, but if it was really the case, the GDXJ would be showing actual strength relative to gold. You know, like, moving above its previous highs before gold does something like this.
Then I commented also on other signals that further strengthened the bearish outlook, e.g. miners’ relative weakness compared to gold.
We already know miners plunged significantly shortly thereafter, but the question remains… What’s likely to happen next?
The RSI at 30 might be an indication to take profits from the current short position and maybe even go long, but it’s best to monitor many other signals as well.
Of course, that’s what I’ll do, and I’ll report to you – our subscribers – accordingly. And, well, after publishing analyses of the precious metals market for over 15 years, you can rest assured that I’ve seen more than a few of the tricks that the market can pull on us.
Getting back to the question – what’s next?
The bearish momentum is strong, and given gold’s verification, it seems that the decline in the GDXJ is going to continue in the short run (for the next several days) without a bigger corrective upswing.
The markets usually don’t move up or down in a straight line, so some kind of correction is likely to take place in the future, anyway. The question is from what price levels.
My best candidate for the first correction (based on the data that I have available right now) is The $30.5 - $32 range, which is based on the previous lows. I don’t expect a huge rally from those levels, though. Perhaps a move from $30.5 to $32, and then the decline would continue.
The next target is more important. After breaking to the new 2023 lows, the move to the 2022 low (close to $26) becomes a good possibility – I marked this area with a green ellipse.
Once this level is reached, I expect the GDXJ to correct in a more visible manner. After all, at that point, it will be after important breakdowns:
- Below the rising blue support line
- Below the previous 2023 low
- Below the green support line
Consequently, a verification of those breakdowns by a move back to them would be quite normal. This means a move back to $29 - $30. Then, after a successful verification of those breakdowns, I’d expect the GDXJ to slide lower – to the 2020 low or close to them – at about $20.
There’s also a good possibility of seeing a bottom at about $22, as that’s where we have a downside target based on the head-and-shoulders pattern that is most likely being formed right now. It could also be the case that the GDXJ slides to about $20 on an intraday basis only to recover and close the day at about $22. In a way, both targets would be reached in this case.
There are many IFs around the above-mentioned scenario, and the situation might (and it probably will) change as we go. Remaining open-minded and flexible regarding the new information is key, but having a roadmap is very useful, too, as it shows how things could develop on a more-or-less basis. This can help you prepare for those – or similar – price moves. Again, as always, I’ll keep you – my subscribers – updated.
= = =
If you’d like to become a partner/investor in Golden Meadow, you’ll find more details in the above link.
Overview of the Upcoming Part of the Decline
- It seems that the recent – and probably final – corrective upswing in the precious metals sector is over.
- If we see a situation where miners slide in a meaningful and volatile way while silver doesn’t (it just declines moderately), I plan to – once again – switch from short positions in miners to short positions in silver. At this time, it’s too early to say at what price levels this could take place and if we get this kind of opportunity at all.
- I plan to switch from the short positions in junior mining stocks or silver (whichever I’ll have at that moment) to long positions in junior mining stocks when gold / mining stocks move to their 2020 lows (approximately). While I’m probably not going to write about it at this stage yet, this is when some investors might consider getting back in with their long-term investing capital (or perhaps 1/3 or 1/2 thereof).
- I plan to return to short positions in junior mining stocks after a rebound – and the rebound could take gold from about $1,450 to about $1,550, and it could take the GDXJ from about $20 to about $24. In other words, I’m currently planning to go long when GDXJ is close to $20 (which might take place when gold is close to $1,450), and I’m planning to exit this long position and re-enter the short position once we see a corrective rally to $24 in the GDXJ (which might take place when gold is close to $1,550).
- I plan to exit all remaining short positions once gold shows substantial strength relative to the USD Index while the latter is still rallying. This may be the case with gold prices close to $1,400 and GDXJ close to $15 . This moment (when gold performs very strongly against the rallying USD and miners are strong relative to gold after its substantial decline) is likely to be the best entry point for long-term investments, in my view. This can also happen with gold close to $1,400, but at the moment it’s too early to say with certainty.
- The above is based on the information available today, and it might change in the following days/weeks.
You will find my general overview of the outlook for gold on the chart below:
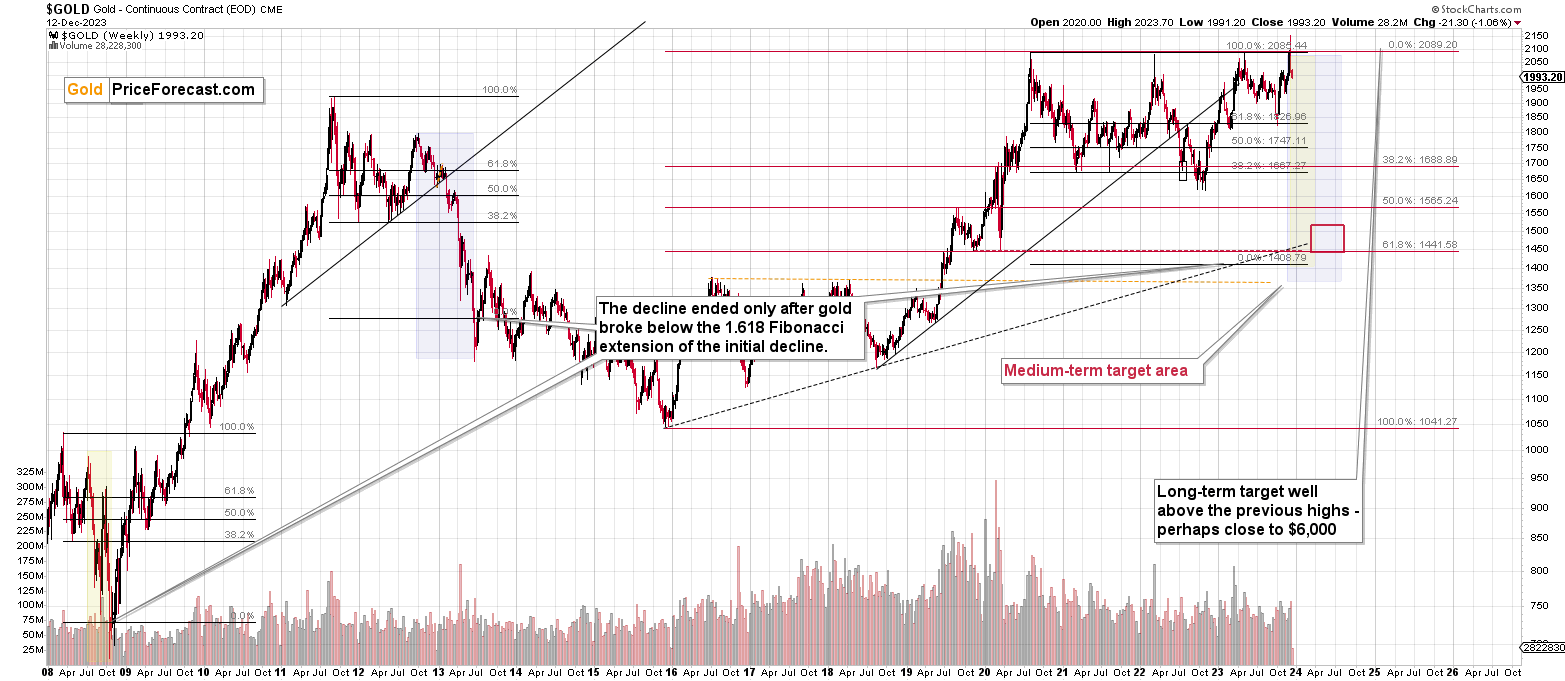
Please note that the above timing details are relatively broad and “for general overview only” – so that you know more or less what I think and how volatile I think the moves are likely to be – on an approximate basis. These time targets are not binding nor clear enough for me to think that they should be used for purchasing options, warrants, or similar instruments.
Letters to the Editor
Please post your questions in the comments feed below the articles if they are about issues raised within the article (or in the recent issues). If they are about other, more universal matters, I encourage you to use the Ask the Community space (I’m also part of the community) so that more people can contribute to the reply and enjoy the answers. Of course, let’s keep the target-related discussions in the premium space (where you’re reading this).
Summary
To summarize, the short-term corrective upswing in the mining stocks is most likely over, and that the top in the precious metals market is in. And just like the top that we saw in the first half of 2022, this top is likely to be followed by severe declines in gold, silver, and mining stocks. Junior miners are likely to fall particularly hard, being influenced also by – most likely – falling stock prices. The values of copper and FCX shares are likely to slide as well.
===
As we’re on a streak of 11 profitable (closed, unleveraged) trades, and – just like I wrote today and in the previous days – it looks like we’re going to see many more of them in the near future, I want to provide you with even more great news!
We’re opening the possibility of extending your subscription for up to three years (at least by one year) with a 10% discount on the current prices.
Locking in those is a great idea not only because it’s the perfect time to be ready for what’s next in the precious metals market, but also because the inflation might persist longer than expected and prices of everything (including our subscriptions) are going to go up in the future as well. Please reach out to our support – they will be happy to assist you and make sure that your subscription days are properly extended at those promotional terms. So, for how many years would you like to lock-in your subscription?
To summarize:
Trading capital (supplementary part of the portfolio; our opinion): Full speculative short positions (300% of the full position) in junior mining stocks are justified from the risk to reward point of view with the following binding exit profit-take price levels:
Mining stocks (price levels for the GDXJ ETF): binding profit-take exit price: $28.12; stop-loss: none.
Alternatively, if one seeks leverage, we’re providing the binding profit-take levels for the JDST (2x leveraged). The binding exit level for the JDST: $10.54; stop-loss for the JDST: none.
For-your-information targets (our opinion; we continue to think that mining stocks are the preferred way of taking advantage of the upcoming price move, but if for whatever reason one wants / has to use silver or gold for this trade, we are providing the details anyway.):
Silver futures downside exit price: $20.22 (stop-loss: none)
SLV exit price: $18.62 (stop-loss: none)
ZSL exit price: $24.98 (stop-loss: none)
Gold futures downside exit price: $1,812 (stop-loss: none)
Spot gold downside exit price: $1,792 (stop-loss: none)
HGD.TO – alternative (Canadian) 2x inverse leveraged gold stocks ETF – the exit price: $8.43 (stop-loss: none)
HZD.TO – alternative (Canadian) 2x inverse leveraged silver ETF – the exit price: $19.49 (stop-loss: none)
///
Optional / additional trade idea that I think is justified from the risk to reward point of view:
Short position in the FCX with $27.13 as the short-term profit-take level.
Long-term capital (core part of the portfolio; our opinion): No positions (in other words: cash)
Insurance capital (core part of the portfolio; our opinion): Full position
Whether you’ve already subscribed or not, we encourage you to find out how to make the most of our alerts and read our replies to the most common alert-and-gold-trading-related-questions.
Please note that we describe the situation for the day that the alert is posted in the trading section. In other words, if we are writing about a speculative position, it means that it is up-to-date on the day it was posted. We are also featuring the initial target prices to decide whether keeping a position on a given day is in tune with your approach (some moves are too small for medium-term traders, and some might appear too big for day-traders).
Additionally, you might want to read why our stop-loss orders are usually relatively far from the current price.
Please note that a full position doesn't mean using all of the capital for a given trade. You will find details on our thoughts on gold portfolio structuring in the Key Insights section on our website.
As a reminder - "initial target price" means exactly that - an "initial" one. It's not a price level at which we suggest closing positions. If this becomes the case (as it did in the previous trade), we will refer to these levels as levels of exit orders (exactly as we've done previously). Stop-loss levels, however, are naturally not "initial", but something that, in our opinion, might be entered as an order.
Since it is impossible to synchronize target prices and stop-loss levels for all the ETFs and ETNs with the main markets that we provide these levels for (gold, silver and mining stocks - the GDX ETF), the stop-loss levels and target prices for other ETNs and ETF (among other: UGL, GLL, AGQ, ZSL, NUGT, DUST, JNUG, JDST) are provided as supplementary, and not as "final". This means that if a stop-loss or a target level is reached for any of the "additional instruments" (GLL for instance), but not for the "main instrument" (gold in this case), we will view positions in both gold and GLL as still open and the stop-loss for GLL would have to be moved lower. On the other hand, if gold moves to a stop-loss level but GLL doesn't, then we will view both positions (in gold and GLL) as closed. In other words, since it's not possible to be 100% certain that each related instrument moves to a given level when the underlying instrument does, we can't provide levels that would be binding. The levels that we do provide are our best estimate of the levels that will correspond to the levels in the underlying assets, but it will be the underlying assets that one will need to focus on regarding the signs pointing to closing a given position or keeping it open. We might adjust the levels in the "additional instruments" without adjusting the levels in the "main instruments", which will simply mean that we have improved our estimation of these levels, not that we changed our outlook on the markets. We are already working on a tool that would update these levels daily for the most popular ETFs, ETNs and individual mining stocks.
Our preferred ways to invest in and to trade gold along with the reasoning can be found in the how to buy gold section. Furthermore, our preferred ETFs and ETNs can be found in our Gold & Silver ETF Ranking.
As a reminder, Gold & Silver Trading Alerts are posted before or on each trading day (we usually post them before the opening bell, but we don't promise doing that each day). If there's anything urgent, we will send you an additional small alert before posting the main one.
===
On a side note, while commenting on analyses, please keep the Pillars of the Community in mind. It’s great to provide points that help others be more objective. However, it’s important to focus on the facts and discuss them in a dignified manner. There is not much of the latter in personal attacks. As more and more people join our community, it is important to keep it friendly. Being yourself, even to the point of swearing, is great, but the point is not to belittle other people or put them in a position of “shame” (whether it works or not). Everyone can make mistakes, and everyone does, in fact, make mistakes. We all here have the same goal: to have a greater understanding of the markets and pick better risk-to-reward situations for our trades. We are on the same side.
On another – and final – side note, the number of messages, comments etc. that I’m receiving is enormous, and while I’m grateful for such engagement and feedback, I’m also starting to realize that there’s no way in which I’m going to be able to provide replies to everyone that I would like to, while keeping any sort of work-life balance and sanity ;) Not to mention peace of mind and calmness required to approach the markets with maximum objectivity and to provide you with the service of the highest quality – and best of my abilities.
Consequently, please keep in mind that I will not be able to react / reply to all messages. It will be my priority to reply to messages/comments that adhere to the Pillars of the Community (I wrote them, by the way) and are based on kindness, compassion and on helping others grow themselves and their capital in the most objective manner possible (and to messages that are supportive in general). I noticed that whatever one puts their attention to – grows, and that’s what I think all communities need more of.
Sometimes, Golden Meadow’s support team forwards me a message from someone, who assumed that I might not be able to see a message on Golden Meadow, but that I would notice it in my e-mail account. However, since it’s the point here to create a supportive community, I will specifically not be providing any replies over email, and I will be providing them over here (to the extent time permits). Everyone’s best option is to communicate here, on Golden Meadow, ideally not in private messages (there are exceptions, of course!) but in specific spaces or below articles, because even if I’m not able to reply, the odds are that there will be someone else with insights on a given matter that might provide helpful details. And since we are all on the same side (aiming to grow ourselves and our capital), a ton of value can be created through this kind of collaboration :).
Thank you.
Przemyslaw K. Radomski, CFA
Founder, Editor-in-chief

