

Briefly: in our opinion, full (250% of the regular size of the position) speculative short positions in gold, silver and mining stocks are justified from the risk/reward perspective at the moment of publishing this Alert.
Yesterday, the USD Index moved substantially lower while precious metals barely yawned. Why is gold not rallying? What does the gold-USD link tell us now, in combination with latest developments throughout the PMs sector? Let’s together examine these and many more clues.
Almost nothing happened yesterday in gold and silver, while miners moved a bit lower. The latter is a bearish indication, but not the most important one that we saw. The key issue is that what happened in the gold-USD link showed that gold was previously not showing strength with regard to the US currency. Yesterday’s action confirmed our yesterday’s thoughts on that matter. We explained the reasoning behind the lack of decline in gold in light of USD’s rally in the following way:
One reason might be that gold is simply showing strength, as it doesn’t want to move lower – it’s waiting for factors on which it could rally. But we don’t think that this the correct interpretation. There are multiple long-term bearish factors that remain in place and thus it seems that there might be a different interpretation. And there is. Actually, there are two reasons due to which this might be the case.
First, gold is often reacting to major breakouts in the USD Index (and breakdowns), not necessarily to smaller moves that lead to the breakouts (breakdowns). The investors simply doubt that the USD strength will be upheld and don’t sell their gold based on the above.
(…)
Second reason may be the very recent discrepancy between the triangle-vertex-based reversals in the USD Index and the precious metals market. The USDX reversal took place earlier, so it may still be the case that the recent resilience of the precious metals sector is a way in which the natural delay takes place.
Consequently, the recent “strength” in gold may be no real strength at all.
Let’s see what happened in the USD Index yesterday:
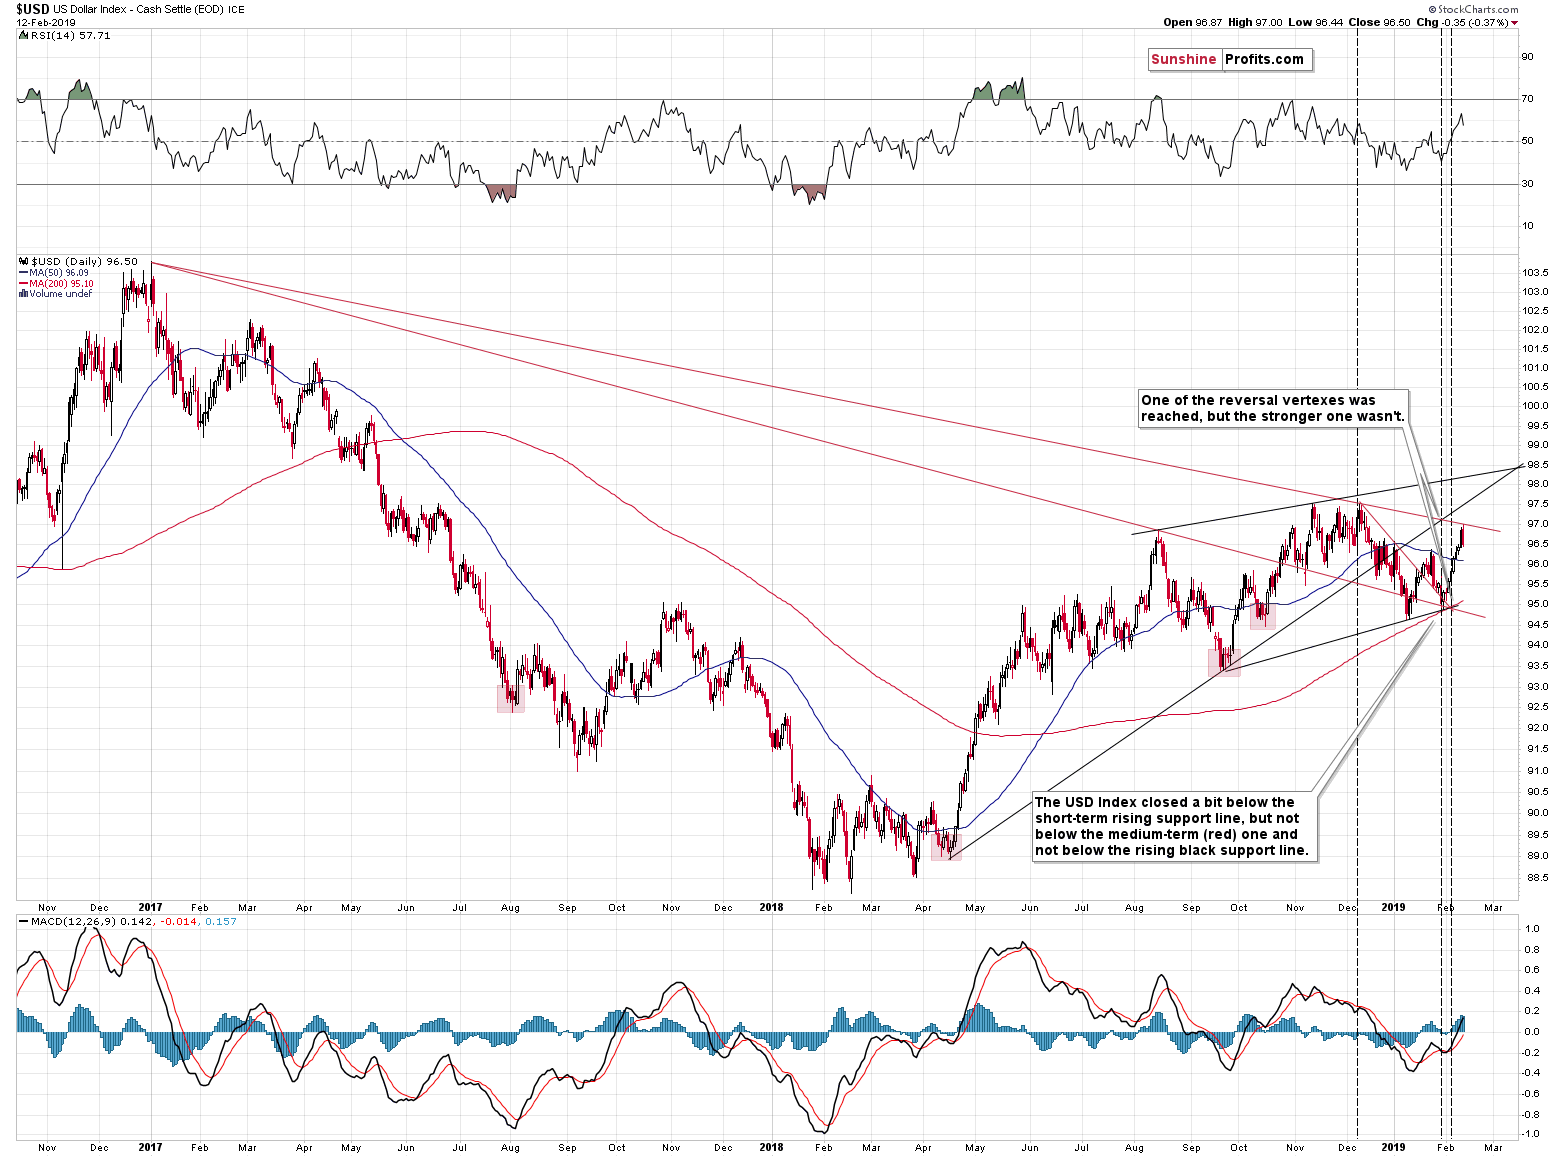
Quoting yesterday’s Gold & Silver Trading Alert:
The USD Index moved to the declining red resistance line. It’s not visible on the above chart, but the USDX moved a bit higher in today’s pre-market trading and thanks to this, the above-mentioned line was reached. The line was reached, but not broken, so the fact that gold investors are hesitating seems natural.
Moreover, the recent movement in the USD Index (approximately since the second week of January) looks like a corrective zigzag pattern. That’s yet another reason for traders to doubt the recent strength.
Naturally, the big picture for the USDX remains bullish (and our profits on the EUR/USD pair keep on growing even though we took part of them off the table yesterday). The fact that USD keeps on rallying since Fed’s dovish remarks (a strongly bearish factor for the USDX) is more important than the above assumptions.
The USD Index has indeed corrected after moving to the declining resistance line. The key thing about this decline is that it didn’t take gold todamoon. Gold and silver mostly ignored USD’s decline despite early gains and mining stocks even declined. If gold’s previous lack of decline despite USD’s strength was really a sign of strength, it would have rallied strongly yesterday. It didn’t and miners even declined, which shows that it was not the factor behind the recent gold-USD dynamics. This further increases the chance that gold’s decline was simply delayed.
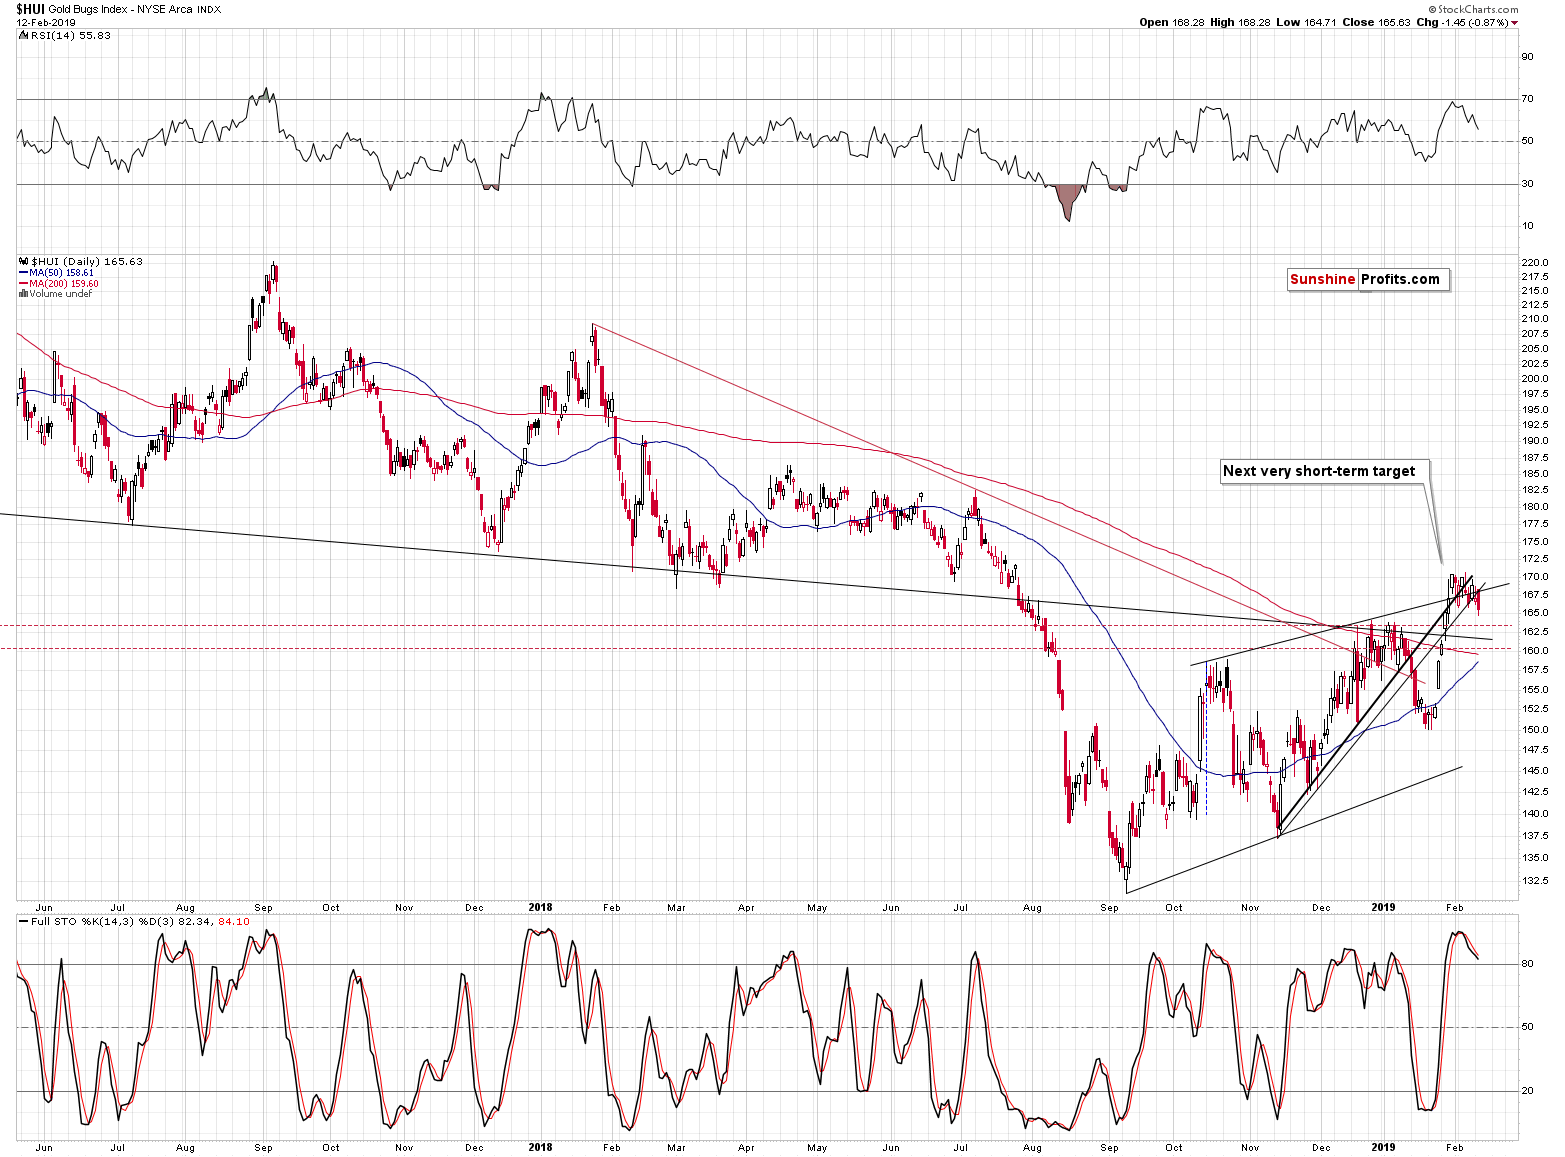
Gold miners’ decline was important as it was the lowest closing price of the month and at the same time, it was the first daily close that was visibly below all the rising short-term support lines. The breakdown presented on the above gold stock chart is now much clearer than it was before and the implications of the above chart more bearish.
Everything that we wrote yesterday about gold’s and silver’s daily charts remains up-to-date, so instead of repeating it today, we will provide you with an update on two more long-term oriented factors.
Japanese Yen, Triangles and Technicals
Let’s take a closer look at the Japanese yen. It’s the second most heavily-weighted component within the USD Index. It’s worthy of our attention as precious metals tend to move in tune with it. Just take a look at the chart below:
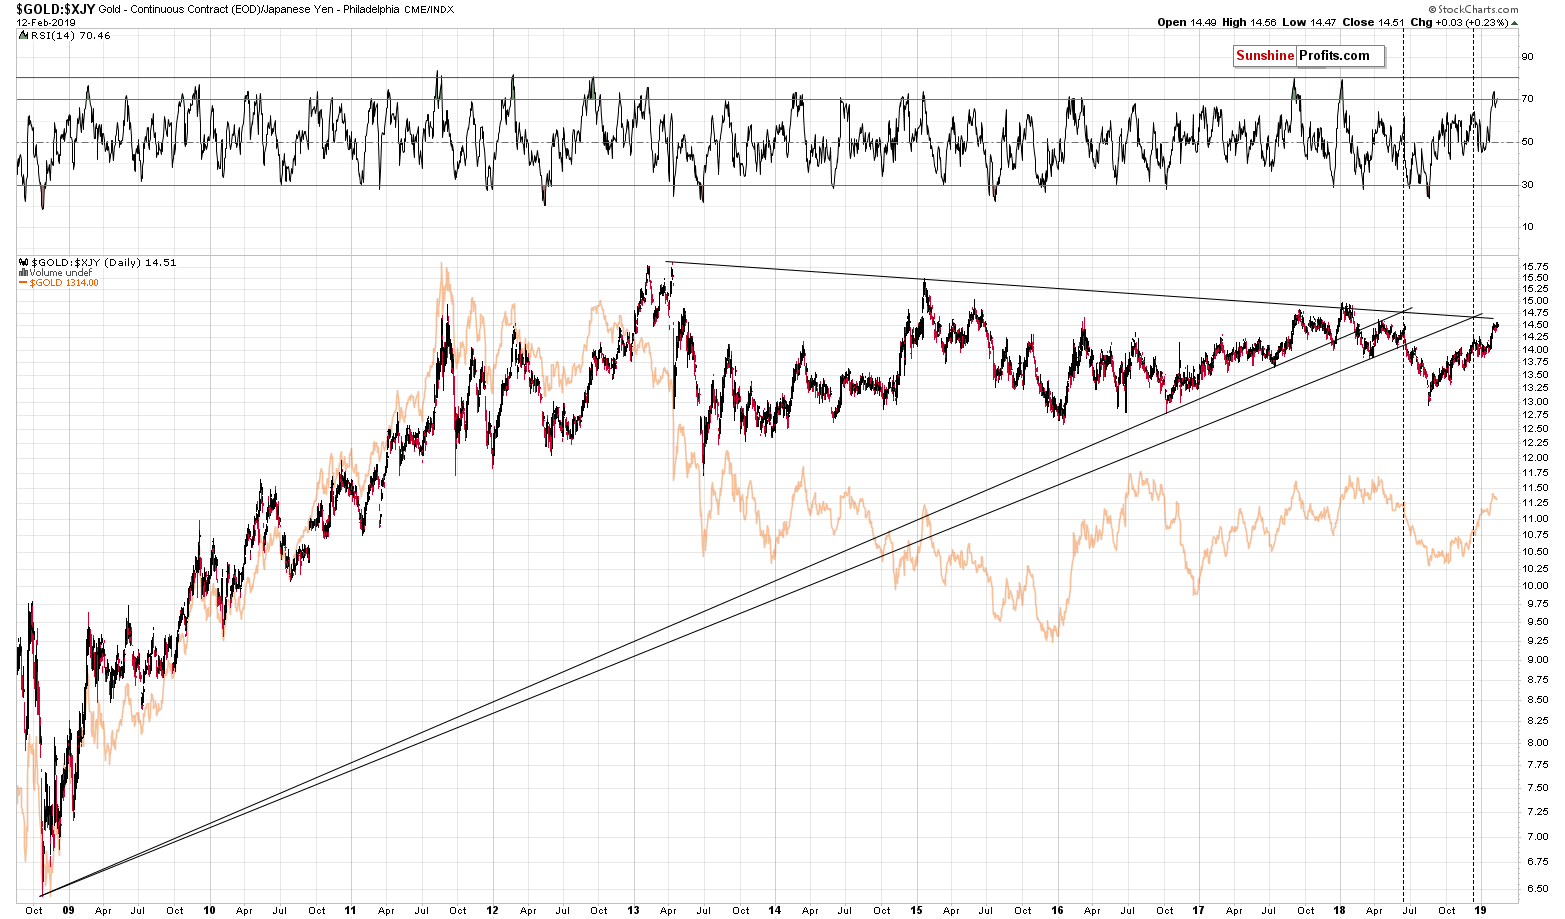
Most prominent features are both the triangles (created by two support lines starting from the late 2008 bottom and the declining resistance line that’s based on the 2013 and 2015 tops) and the mentioned declining resistance line. Triangles help us with determining the time and direction of the next turning point, while the resistance line obviously serves as a resistance. Here, we see that after reaching the second triangle, the gold-yen ratio indeed turned down (just as it did after reaching the first triangle top). However, it later made a higher low and turned up. Now comes the declining resistance line – the ratio is so close to it currently that any room for further increases is minuscule. The odds favor a downside resolution, both in the ratio and in the price of gold. If not immediately, then shortly. Most factors (including gold’s, silver’s and miners’ triangle-based reversals) suggest the “immediately” scenario, though.
That was the gold-yen ratio. Next, we will visit the Japanese yen itself:
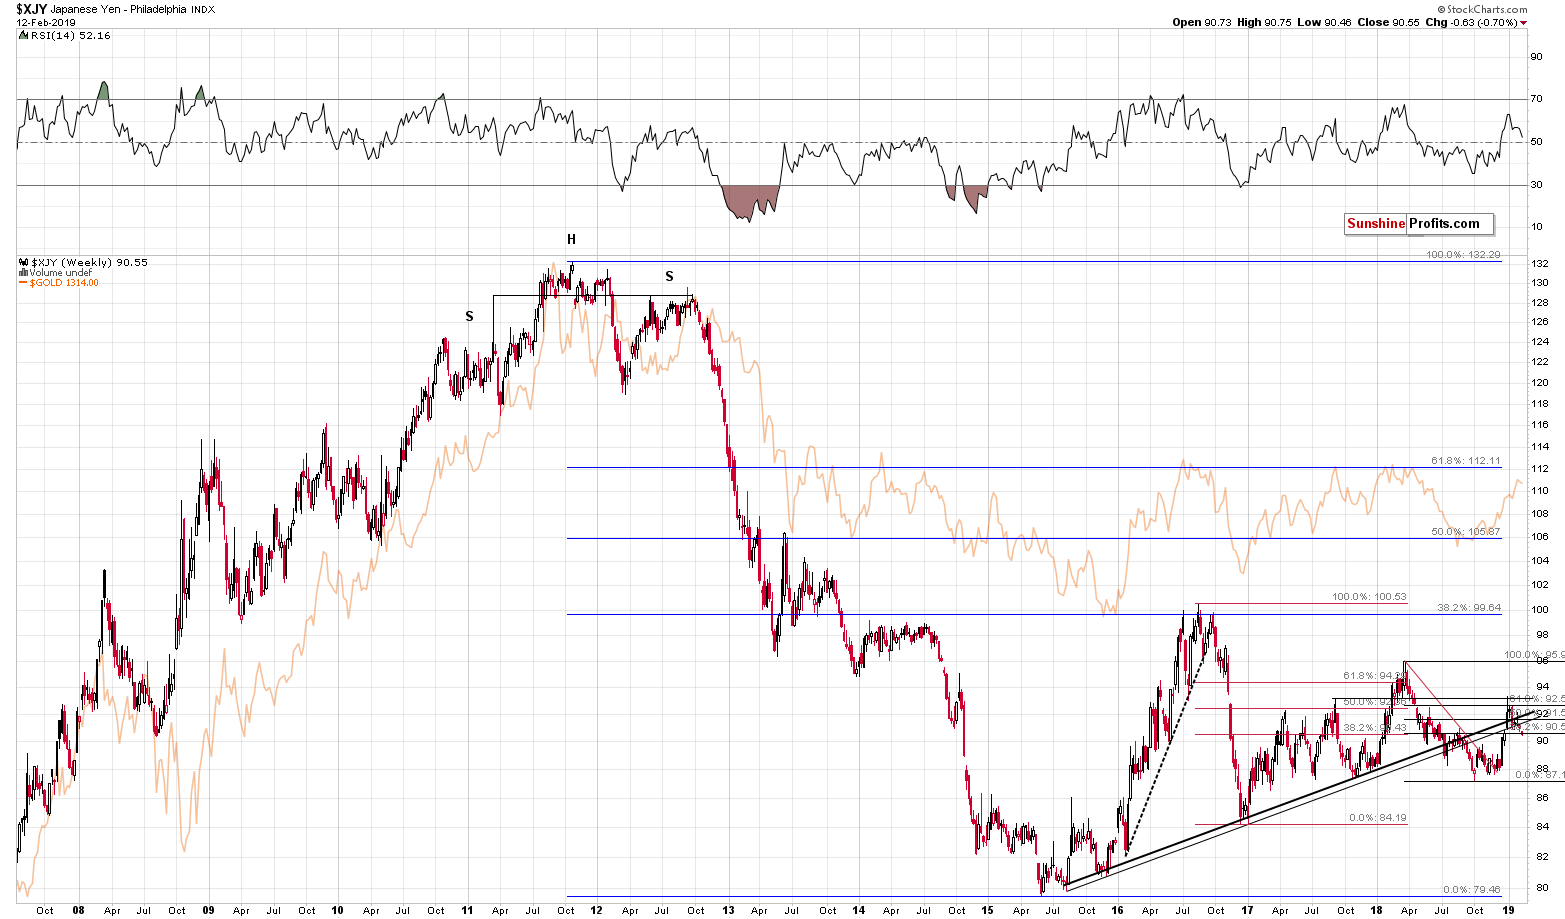
The weekly chart shows the yen to be after a verified breakdown below two rising support lines. These support lines have been drawn using either intraday or closing prices. The price is currently in the process of invalidation of the short-term breakout above both the rising support lines. Invalidation of a breakout is a strongly bearish development and as a result, we can expect the yen to head lower. Remembering the strength of the gold-yen link, it’s one more reason for PMs prices to decline in tandem.
Summary
Summing up, the recent rally and kind of resilience in the PMs complex may appear encouraging, but it doesn’t change the medium-term trend and outlook, which remain bearish. It seems that gold’s reaction to the strength in the USD Index is simply delayed.
The upside is quite limited, while the downside remains enormous. The reversals have been reached last week. As PMs, miners, and the USD Index move beyond their reversal dates, the chance for any meaningful upswing in the former before medium-term decline’s continuation, is declining with the time passing.
As always, we’ll keep you – our subscribers – informed.
To summarize:
Trading capital (supplementary part of the portfolio; our opinion): Full short positions (250% of the full position) in gold, silver and mining stocks are justified from the risk/reward perspective with the following stop-loss orders and exit profit-take price levels:
- Gold: profit-take exit price: $1,062; stop-loss: $1,337; initial target price for the DGLD ETN: $82.96; stop-loss for the DGLD ETN $41.27
- Silver: profit-take exit price: $12.32; stop-loss: $16.44; initial target price for the DSLV ETN: $47.67; stop-loss for the DSLV ETN $24.18
- Mining stocks (price levels for the GDX ETF): profit-take exit price: $13.12; stop-loss: $23.27; initial target price for the DUST ETF: $80.97; stop-loss for the DUST ETF $16.27
Note: the above is a specific preparation for a possible sudden price drop, it does not reflect the most likely outcome. You will find a more detailed explanation in our August 1st Alert. In case one wants to bet on junior mining stocks’ prices (we do not suggest doing so – we think senior mining stocks are more predictable in the case of short-term trades – if one wants to do it anyway, we provide the details), here are the stop-loss details and target prices:
- GDXJ ETF: profit-take exit price: $17.52; stop-loss: $34.62
- JDST ETF: initial target price: $154.97 stop-loss: $35.87
Long-term capital (core part of the portfolio; our opinion): No positions (in other words: cash)
Insurance capital (core part of the portfolio; our opinion): Full position
Important Details for New Subscribers
Whether you already subscribed or not, we encourage you to find out how to make the most of our alerts and read our replies to the most common alert-and-gold-trading-related-questions.
Please note that the in the trading section we describe the situation for the day that the alert is posted. In other words, it we are writing about a speculative position, it means that it is up-to-date on the day it was posted. We are also featuring the initial target prices, so that you can decide whether keeping a position on a given day is something that is in tune with your approach (some moves are too small for medium-term traders and some might appear too big for day-traders).
Plus, you might want to read why our stop-loss orders are usually relatively far from the current price.
Please note that a full position doesn’t mean using all of the capital for a given trade. You will find details on our thoughts on gold portfolio structuring in the Key Insights section on our website.
As a reminder – “initial target price” means exactly that – an “initial” one, it’s not a price level at which we suggest closing positions. If this becomes the case (like it did in the previous trade) we will refer to these levels as levels of exit orders (exactly as we’ve done previously). Stop-loss levels, however, are naturally not “initial”, but something that, in our opinion, might be entered as an order.
Since it is impossible to synchronize target prices and stop-loss levels for all the ETFs and ETNs with the main markets that we provide these levels for (gold, silver and mining stocks – the GDX ETF), the stop-loss levels and target prices for other ETNs and ETF (among other: UGLD, DGLD, USLV, DSLV, NUGT, DUST, JNUG, JDST) are provided as supplementary, and not as “final”. This means that if a stop-loss or a target level is reached for any of the “additional instruments” (DGLD for instance), but not for the “main instrument” (gold in this case), we will view positions in both gold and DGLD as still open and the stop-loss for DGLD would have to be moved lower. On the other hand, if gold moves to a stop-loss level but DGLD doesn’t, then we will view both positions (in gold and DGLD) as closed. In other words, since it’s not possible to be 100% certain that each related instrument moves to a given level when the underlying instrument does, we can’t provide levels that would be binding. The levels that we do provide are our best estimate of the levels that will correspond to the levels in the underlying assets, but it will be the underlying assets that one will need to focus on regarding the signs pointing to closing a given position or keeping it open. We might adjust the levels in the “additional instruments” without adjusting the levels in the “main instruments”, which will simply mean that we have improved our estimation of these levels, not that we changed our outlook on the markets. We are already working on a tool that would update these levels on a daily basis for the most popular ETFs, ETNs and individual mining stocks.
Our preferred ways to invest in and to trade gold along with the reasoning can be found in the how to buy gold section. Additionally, our preferred ETFs and ETNs can be found in our Gold & Silver ETF Ranking.
As a reminder, Gold & Silver Trading Alerts are posted before or on each trading day (we usually post them before the opening bell, but we don't promise doing that each day). If there's anything urgent, we will send you an additional small alert before posting the main one.
Thank you.
Sincerely,
Przemyslaw Radomski, CFA
Editor-in-chief, Gold & Silver Fund Manager

