

Briefly: In our opinion, full (150% of the regular full position) speculative short positions in gold, silver and mining stocks are justified from the risk/reward perspective at the moment of publishing this alert.
In the last few alerts we discussed the price at which gold would be likely to reverse and start an upswing – in today’s analysis, we discuss the “when” factor by featuring gold’s effective turning points.
Before moving to the above details, let’s check what happened and what’s happening in the USD Index (chart courtesy of http://stockcharts.com).
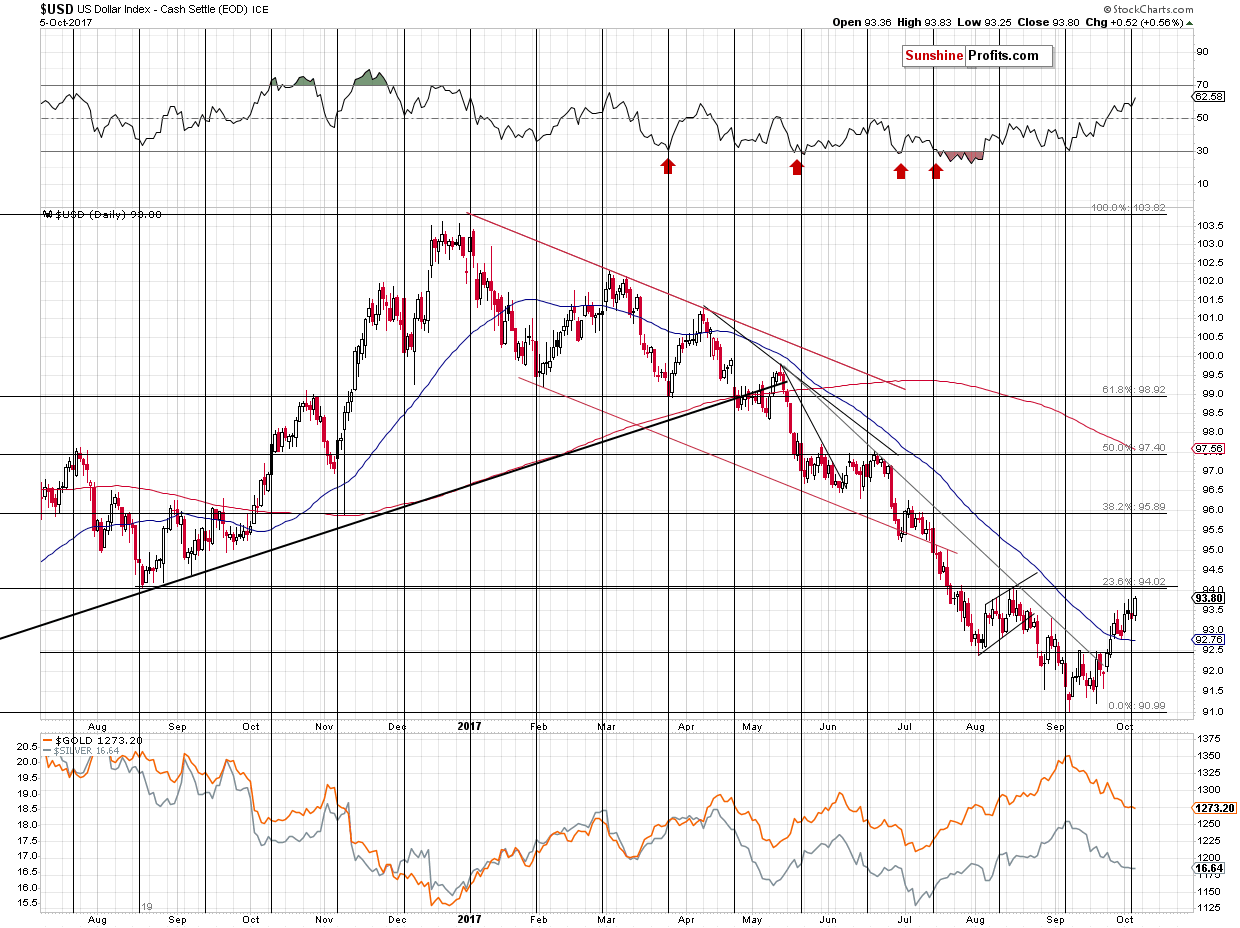
The USD Index rallied yesterday, closed at a new monthly high and it has continued the rally also today, trading at 94.11 at the moment of writing these words. This means that we have just seen a breakout above the August 2017 highs, August 2016 lows and the 23.6% Fibonacci retracement level. The breakout is not yet confirmed, but it’s already somewhat bullish.
What’s much more important – and much more bullish (for the medium term, though) is what we see in terms of weekly closing prices.
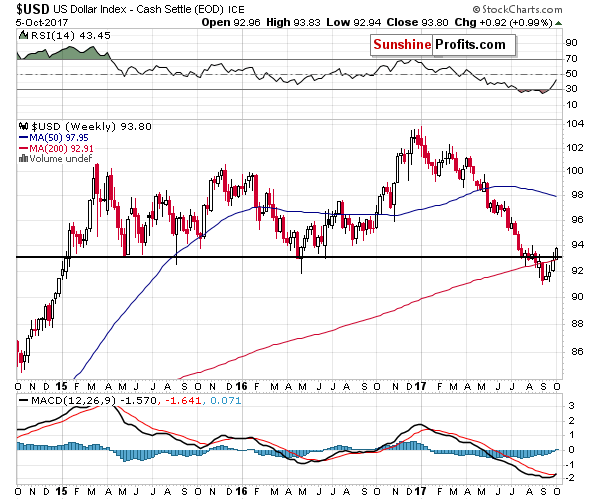
The week is almost over and the USD Index is already well above the most recent lows in terms of the weekly closing prices. Naturally, the USD Index could reverse and close today’s session (and thus the entire week) visibly below the 93 level, but since it’s rallying above 94, it seems very unlikely.
If the very likely happens and the USD closes the week back above the 2015 and 2016 weekly lows, it will be a profound invalidation of a profound breakdown, which is a clear and strong buy sign that heralds weeks and likely months of higher USD Index values.
Naturally, the implications for the precious metals market are bearish.
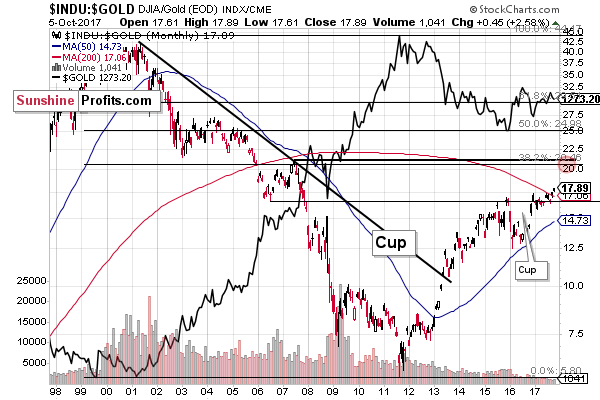
Before moving to gold per se, we would like to remind you about the situation in one of the important ratios – the Dow to gold ratio.
In the September 14 Gold & Silver Trading Alert, we wrote the following on the above chart:
The cup and handle pattern is a bullish formation that is often followed by significant price moves to the upside. For instance, we saw it in gold from late 1999 to June 2002 (cup) and then to November 2002 (handle) and a major rally followed – in fact, that was how the entire bull market started.
Moving back to the above chart, the main cup formed from 2008 to 2015 and the handle has been forming since 2015. Interestingly, the ratio created a smaller cup in the first part of the handle. The ratio is now forming the final part of the big handle which is also the handle of the smaller cup. The bullish implications are stronger than they would be in case of only one formation as they now confirm each other.
With the ratio likely to move higher, gold is likely to move down as it’s in the denominator of the ratio. Since the ratio has medium-term implications, it’s likely that gold will go down in the medium term.
Since we wrote the above, the ratio has indeed moved higher and gold moved lower and at this point you may be wondering if these moves have run their courses. In short, it seems that the moves have only begun from the long-term point of view. There is no significant resistance for the ratio nearby and since the breakout above the 2015 high is clearly visible, the next target is the 20-20.5 area, well above the current position of the ratio. In other words, gold has much further to fall in the coming months based on the above ratio.
Naturally, it could be the case that the ratio rallies because the stock market soars and gold does nothing (or even moves higher but at a much slower pace), but based on how the ratio and gold performed together (both are visible on the above chart), such a scenario is unlikely.
Having said that, let’s move to the main course of today’s analytical meal – gold and its turning points.
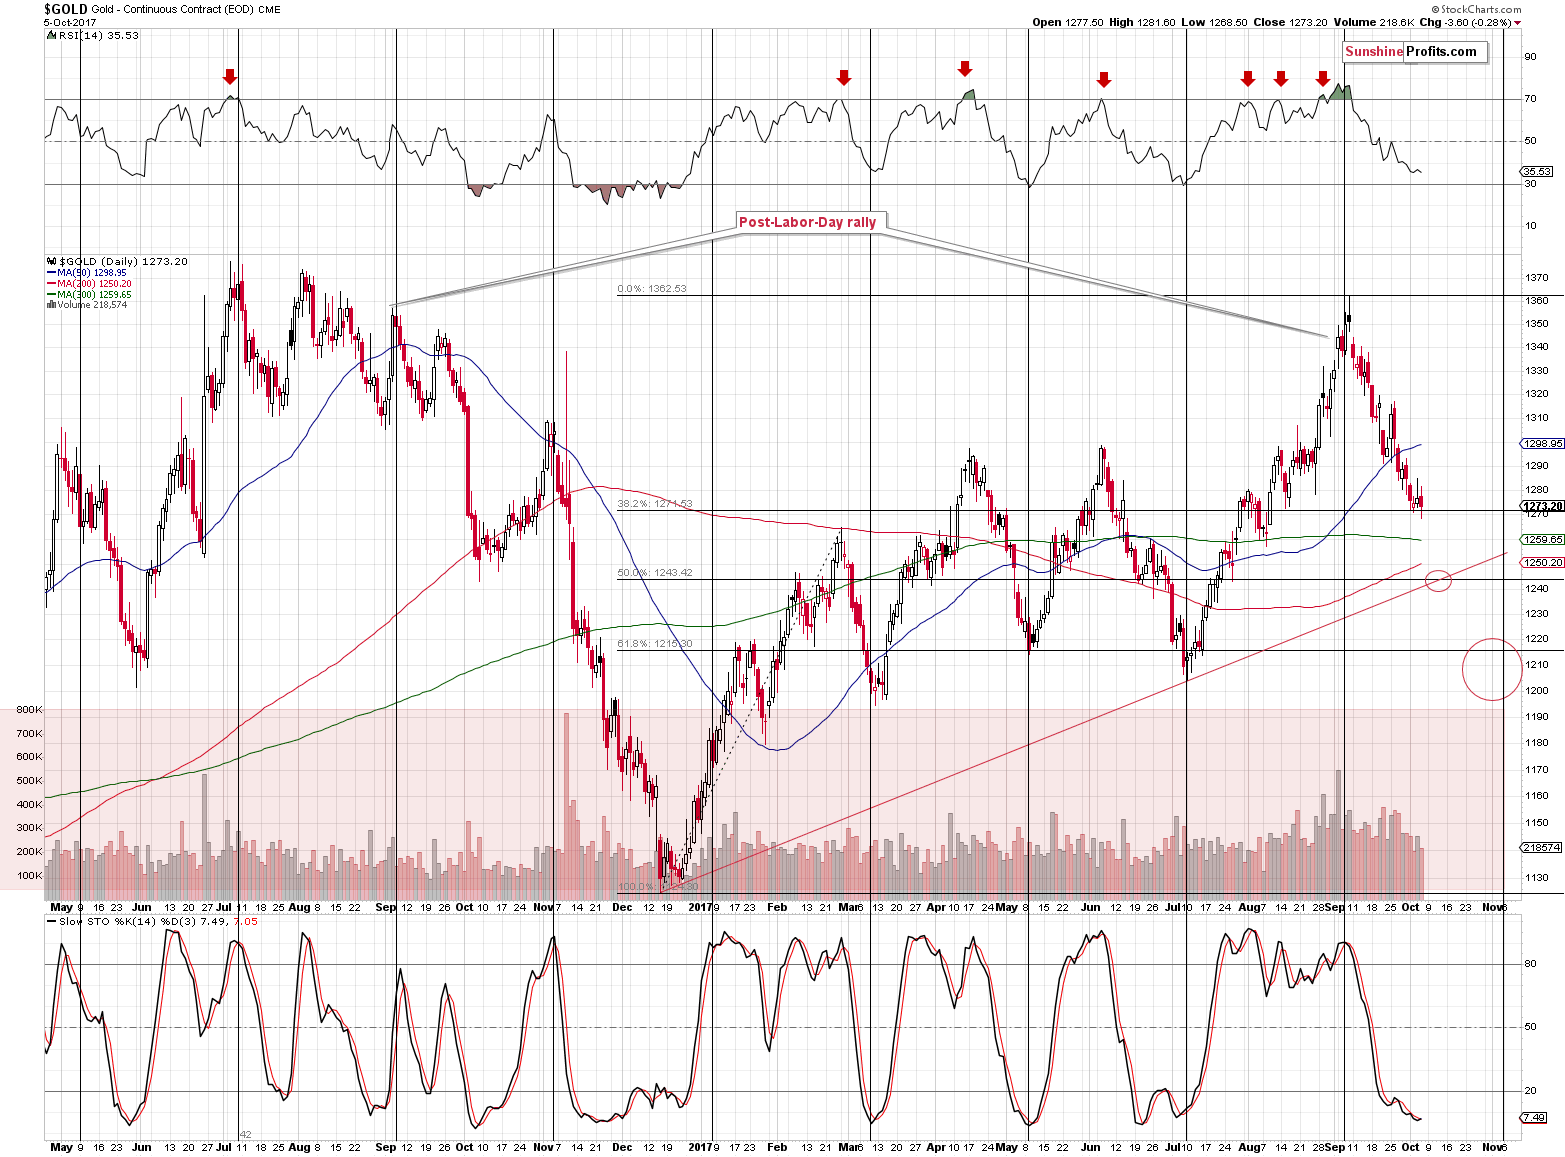
As you can see on the above chart, the turning points have almost always been effective. The only exception is the December 2016 bottom, which was still relatively close to the turning point (the start of the rally that is).
Let’s stay with what we mean by efficiency in this case. The above doesn’t imply that all important bottoms and tops have to take place near the turning point. It does, however, imply that once the turning point does take place, then we are likely to see a reversal.
Consequently, just because there is no turning point next week, it doesn’t mean that there will be no corrective upswing from the $1,244 level or so (should it be reached next week, which appears likely based on the pace at which gold has been declining in the past few weeks).
It means, however, that we should expect a turnaround at the beginning of the next month. Based on the current pace of gold’s decline, we could see gold close to $1,200 – in other words, close to its 61.8% Fibonacci retracement, previous highs, and the support line based on the December 2015 and December 2016 highs (not visible on the above chart). If gold is indeed close to $1,200 in a month or so, it will mean a big chance of a corrective upswing.
However, the turning point could play out differently – we could get a rebound from the $1,240 - $1,250 area and then a rally that ends at the beginning of November and we could see a sharp decline in the following part of the month (similarly to what we saw in November 2016).
At this time both scenarios seem equally probable. Things should get clearer in the following days and weeks as we see how gold declines (in terms of sharpness, levels reached, the indicators’ movement) and what accompanies this move in other markets.
Before summarizing, we would like to reply to a question that we received yesterday. The question was if gold and the USD can move in the same direction (for whatever reason). Here’s our take:
Yes, it is possible for gold to move in the same direction as the USD. There can be multiple reasons for this and this phenomenon is usually short-lived. One reason for a simultaneous move in the same direction could be a war breaking out, in which the U.S. is not participating. This could drive the safe-haven demand for both: the USD (yes, the buck is still viewed as a safe haven) and gold and increase their prices at the same time. Another reason would be a massive increase in money printing in Europe and/or Japan (as the EUR/USD and USD/JPY are the main parts of the USD Index). In this case gold could gain as this action would be inflationary in general and buyers from Europe and Japan would be pushing gold's prices higher, and at the same time the value of both the EUR and JPY would diminish relative to the USD as there would be a bigger supply of the former for the same (more or less) amount of latter.
Moreover, there were times when gold's reaction to what was going on in the USD Index was delayed, especially when people didn't view the USD's move as anything more than a temporary phenomenon.
All in all, in some cases, gold's lack of reaction to the USD's movement or a move in the same direction can be informative (as it could indicate a change in the trend), but at times it's just price noise. Which one is the case depends on the accompanying circumstances. The key question that one needs to be asking is if gold is performing as it should given what happened or does it show weakness / strength in its light.
Summing up, there are multiple strong, long-term signals pointing to much lower prices of precious metals in the following weeks and months, and it seems that the current pause (metals) / upswing (miners) is close to being over. Overall, it doesn’t seem that adjusting the trading position is justified at this time (unless one is day-trading – in this case, mining stocks could provide a trading opportunity) – it seems that it would add risk (of missing a volatile slide), while not providing much of a potential profit. It might become justified (even to a point of entering a small long position) if we get additional bullish signs, though, for instance if gold moves below $1,250 and silver moves below $16.10. Gold could also rally temporarily from approximately $1,200 and either this or a decline after a corrective rally is likely to take place in early November based on gold’s turning point.
As always, we will keep you – our subscribers – informed.
To summarize:
Trading capital (supplementary part of the portfolio; our opinion): Short positions (150% of the full position) in gold, silver and mining stocks are justified from the risk/reward perspective with the following stop-loss orders and initial target price levels / profit-take orders:
- Gold: initial target price level: $1,063; stop-loss: $1,366; initial target price for the DGLD ETN: $81.88; stop-loss for the DGLD ETN $38.74
- Silver: initial target price: $13.12; stop-loss: $19.22; initial target price for the DSLV ETN: $46.18; stop-loss for the DSLV ETN $17.93
- Mining stocks (price levels for the GDX ETF): initial target price: $9.34; stop-loss: $26.34; initial target price for the DUST ETF: $143.56; stop-loss for the DUST ETF $21.37
In case one wants to bet on junior mining stocks' prices (we do not suggest doing so – we think senior mining stocks are more predictable in the case of short-term trades – if one wants to do it anyway, we provide the details), here are the stop-loss details and initial target prices:
- GDXJ ETF: initial target price: $14.13; stop-loss: $45.31
- JDST ETF: initial target price: $417.04; stop-loss: $43.12
Long-term capital (core part of the portfolio; our opinion): No positions (in other words: cash)
Insurance capital (core part of the portfolio; our opinion): Full position
Important Details for New Subscribers
Whether you already subscribed or not, we encourage you to find out how to make the most of our alerts and read our replies to the most common alert-and-gold-trading-related-questions.
Please note that the in the trading section we describe the situation for the day that the alert is posted. In other words, it we are writing about a speculative position, it means that it is up-to-date on the day it was posted. We are also featuring the initial target prices, so that you can decide whether keeping a position on a given day is something that is in tune with your approach (some moves are too small for medium-term traders and some might appear too big for day-traders).
Plus, you might want to read why our stop-loss orders are usually relatively far from the current price.
Please note that a full position doesn’t mean using all of the capital for a given trade. You will find details on our thoughts on gold portfolio structuring in the Key Insights section on our website.
As a reminder – “initial target price” means exactly that – an “initial” one, it’s not a price level at which we suggest closing positions. If this becomes the case (like it did in the previous trade) we will refer to these levels as levels of exit orders (exactly as we’ve done previously). Stop-loss levels, however, are naturally not “initial”, but something that, in our opinion, might be entered as an order.
Since it is impossible to synchronize target prices and stop-loss levels for all the ETFs and ETNs with the main markets that we provide these levels for (gold, silver and mining stocks – the GDX ETF), the stop-loss levels and target prices for other ETNs and ETF (among other: UGLD, DGLD, USLV, DSLV, NUGT, DUST, JNUG, JDST) are provided as supplementary, and not as “final”. This means that if a stop-loss or a target level is reached for any of the “additional instruments” (DGLD for instance), but not for the “main instrument” (gold in this case), we will view positions in both gold and DGLD as still open and the stop-loss for DGLD would have to be moved lower. On the other hand, if gold moves to a stop-loss level but DGLD doesn’t, then we will view both positions (in gold and DGLD) as closed. In other words, since it’s not possible to be 100% certain that each related instrument moves to a given level when the underlying instrument does, we can’t provide levels that would be binding. The levels that we do provide are our best estimate of the levels that will correspond to the levels in the underlying assets, but it will be the underlying assets that one will need to focus on regarding the signs pointing to closing a given position or keeping it open. We might adjust the levels in the “additional instruments” without adjusting the levels in the “main instruments”, which will simply mean that we have improved our estimation of these levels, not that we changed our outlook on the markets. We are already working on a tool that would update these levels on a daily basis for the most popular ETFs, ETNs and individual mining stocks.
Our preferred ways to invest in and to trade gold along with the reasoning can be found in the how to buy gold section. Additionally, our preferred ETFs and ETNs can be found in our Gold & Silver ETF Ranking.
As a reminder, Gold & Silver Trading Alerts are posted before or on each trading day (we usually post them before the opening bell, but we don't promise doing that each day). If there's anything urgent, we will send you an additional small alert before posting the main one.
=====
Latest Free Trading Alerts:
Yesterday, the minutes of the ECB’s July meeting were released. What do they say about the ECB stance and what do they mean for the gold market?
September 2017 ECB Minutes and Gold
The third quarter of 2017 was positive for the gold market, as the yellow metal gained more than 3 percent. We invite you to read our today’s article about the recent fundamental developments in the gold market and find out what do they likely imply for the last three months of the year.
=====
Hand-picked precious-metals-related links:
Gold Heading for Worst Weekly Run of the Year
PRECIOUS-Gold hits 2-mth low as dollar gains ahead of U.S. jobs data
=====
In other news:
Traders keep bets on Fed rate hike in December after jobs report
Dollar Gains Before Payrolls; Europe Stocks Steady: Markets Wrap
Treasuries Doomsday? Wall Street’s New Guide to Bond Trading
Trump Says Military Gathering Might Be ‘Calm Before the Storm’
Catalan parliament to defy Spanish ban on independence debate, official says
=====
Thank you.
Sincerely,
Przemyslaw Radomski, CFA
Founder, Editor-in-chief, Gold & Silver Fund Manager
Gold & Silver Trading Alerts
Forex Trading Alerts
Oil Investment Updates
Oil Trading Alerts

