

Briefly: in our opinion, full (300% of the regular position size) speculative short positions in junior mining stocks are justified from the risk/reward point of view at the moment of publishing this Alert.
What a boring month!
At least for those who monitor the performance of junior mining stocks. It’s Dec. 29, and the monthly price change for the GDXJ ETF is $0.15 (0.41%). That’s how much higher the GDXJ is now than it was at the end of November. That’s next to nothing – almost a “statistical error.”
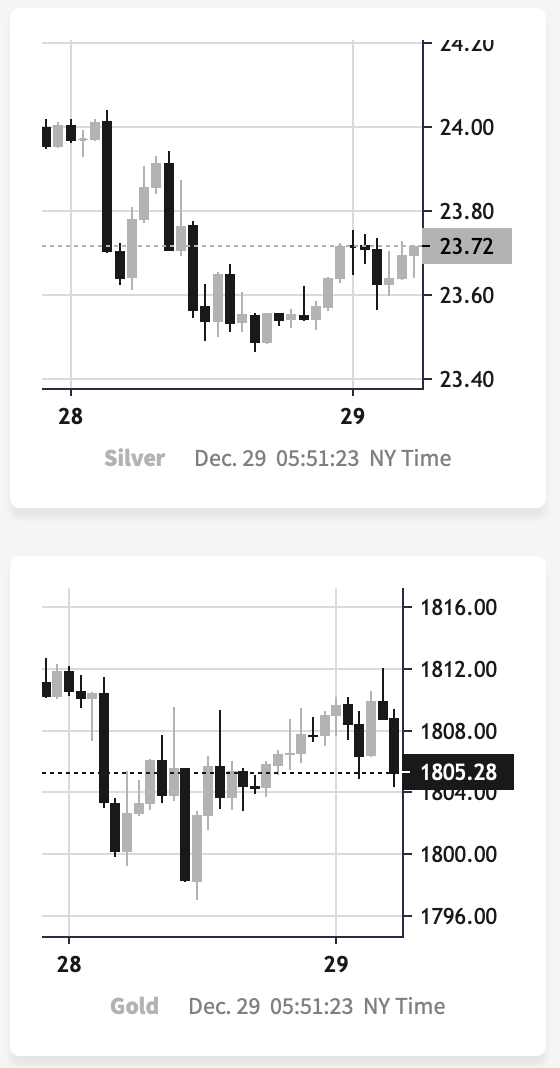
So far today, gold and silver are not doing much (chart courtesy of https://SilverPriceForecast.com), but gold futures rose by $55.90 (3.18%) and silver prices rose by $2.06 (9.45%) in December.
I know that I’ve been writing about this over and over again, but please note how extreme this signal is! It’s crystal-clear even on a monthly basis. The signal, of course, comes from markets’ relative performance.
Miners tend to underperform the gold price close to market tops, and silver tends to outperform close to market tops. The above monthly numbers are practically screaming: “it’s a top!.” As always, very few are listening, as it’s easy to get carried away by the primary emotion that’s out there in the market, and when prices are rallying, people become bullish. They tend to ignore the signs and focus on the feelings.
Even the wording in the messages that we receive changes. The phrases “I feel the market is about to move higher” or “it seems to me that this rally won’t end” are common, but messages with indications and evidence supporting that bullish case are very rare or (usually) absent.
Please note that while I’ve been analyzing the precious metals sector’s outlook recently, my trading focus has been on the junior mining stocks – and indeed, miners have barely moved higher this month, even despite a sizable move lower in the USD Index.
But you said that miners are driven by stocks, and the S&P 500 is down by over 7% this month. Aren’t miners weak just because of the stocks? As a result, there is no underperformance of gold—no bearish indication? No.
While it’s true that stocks’ performance tends to impact juniors’ prices, it’s also true – to a considerable extent – in the case of the silver market.
Silver’s price hasn’t been weak this month. Quite the opposite – silver soared by almost 10%.
If silver soared so much, then apparently the impact the stock market had on the precious metals sector was not as significant. Consequently, it’s very likely that the indications coming from the relative performance of miners and silver are truly bearish for the precious metals sector.
What most people might have missed recently is that what we’ve seen in the past couple of weeks is very similar to what we already saw in mid-2021.
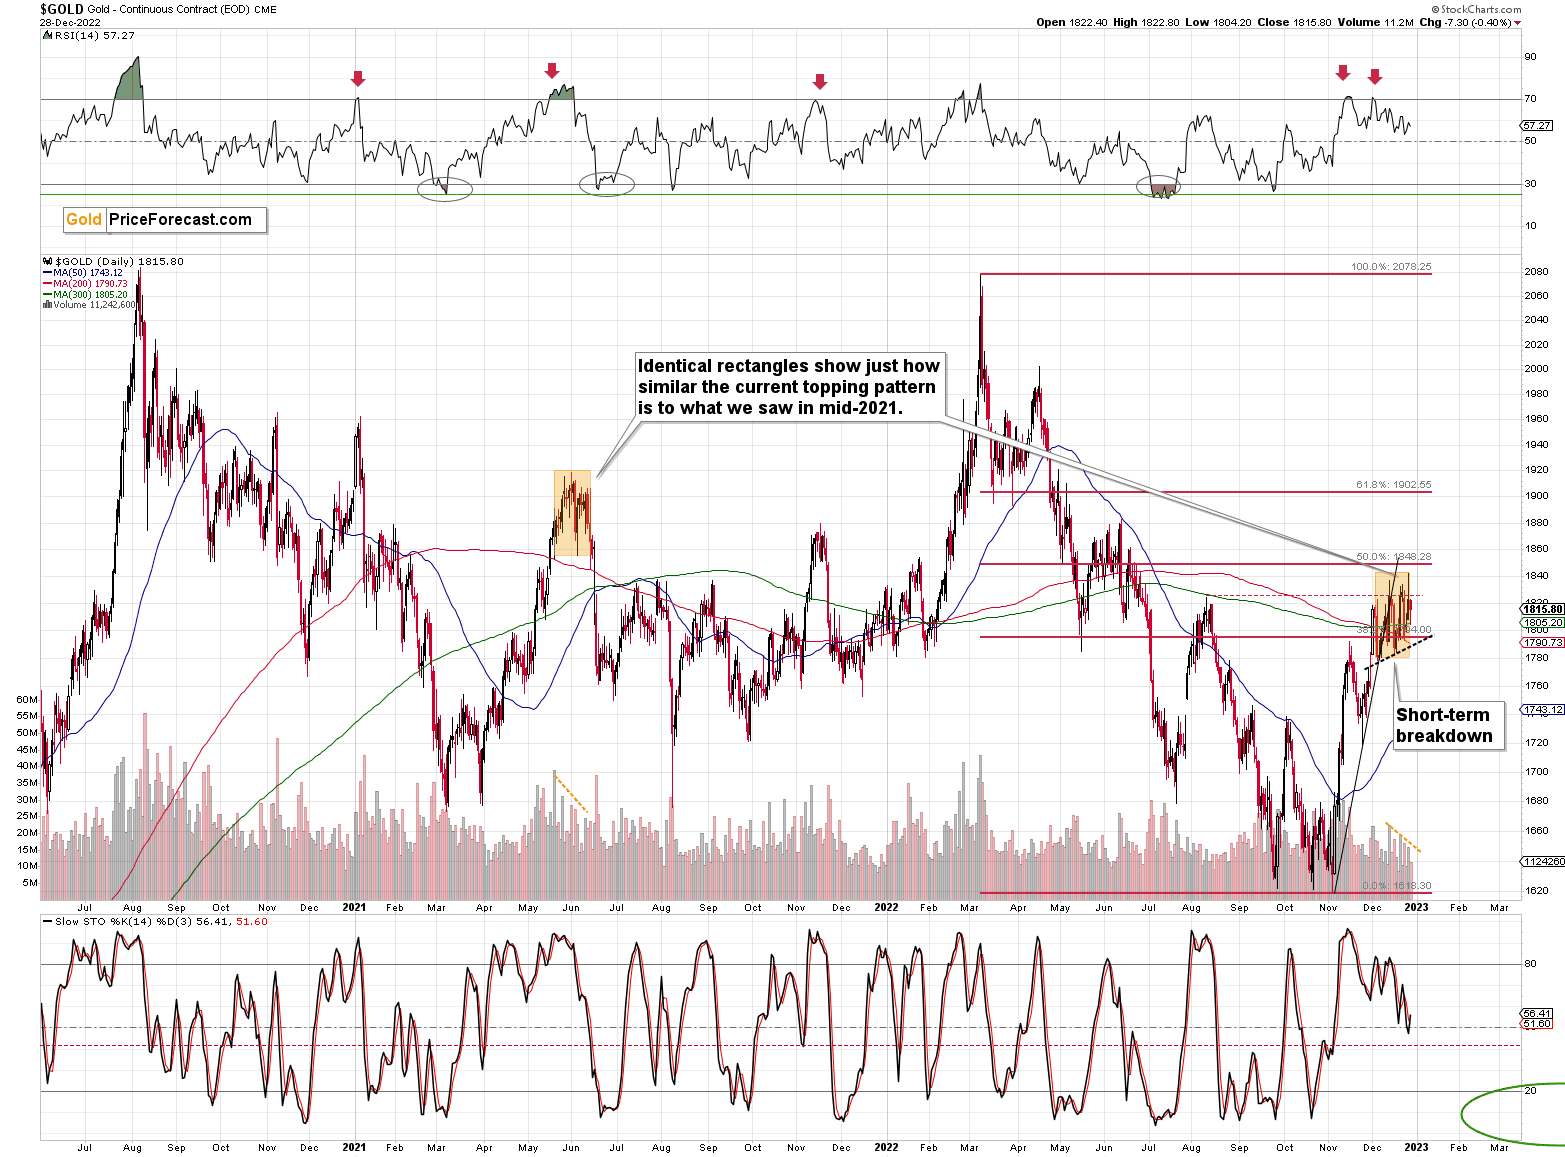
I copied the mid-2021 topping pattern to the current situation. I marked the period from the first intraday high to the start of the decline, and I marked it from the intraday high to the intraday low of the pattern.
Those are surprisingly identical, don’t you think?
Interestingly, both patterns were preceded by similarly sharp rallies, which were preceded by a broad bottom, which in turn were preceded by a decline of about $2,000.
History appears to be rhyming once again, and the implications are bearish – also in the short run.
Also, did I mention that the volume was declining during both patterns? I marked that in the bottom part of the above chart.
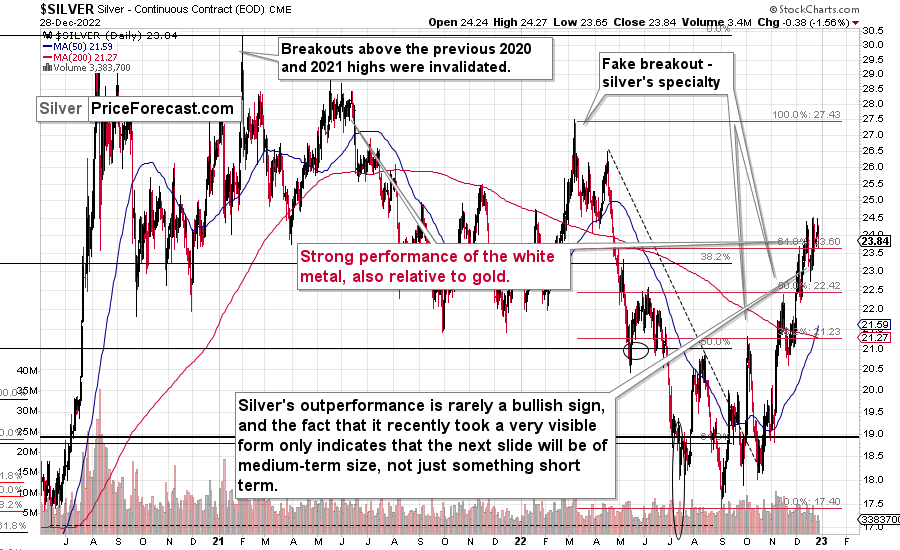
Silver’s strong performance is notable at this time, but please note that we saw the same thing during the mid-2021 top.
And junior miners?
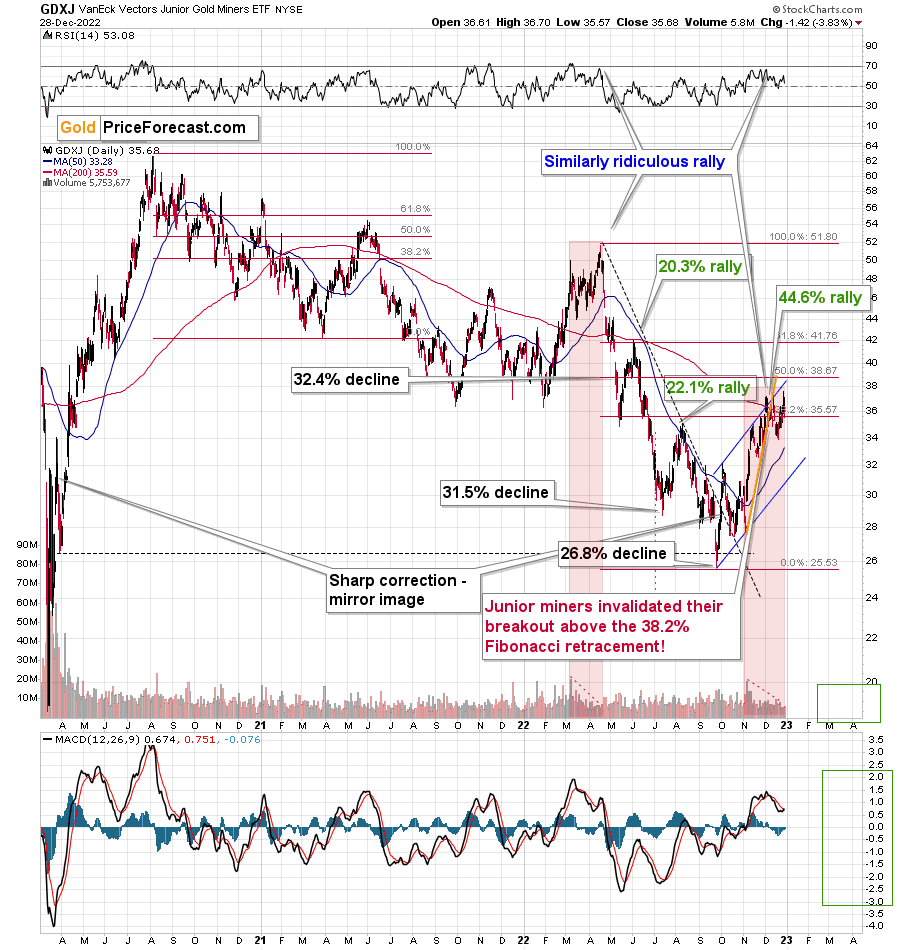
Back in mid-2021, they corrected a bit more than half of their previous decline, and right now they have corrected a bit less than half of their previous decline. The correction is nonetheless similar.
Interestingly, after the correction was over, the pace of the decline picked up, and junior miners moved to new lows, even though gold and silver moved approximately to their previous lows.
The pace of decline that followed the mid-2021 top was almost twice as big as the one of the preceding (2020 – early-2021) decline. As history rhymes, we’re likely to see something similar in the following months (and probably weeks) as well.
If that wasn’t enough, the link between mid-2021 and today is very clear in the case of the USD Index as well. Since the USDX is one of the key drivers for the price of gold, it’s worth paying attention to it.
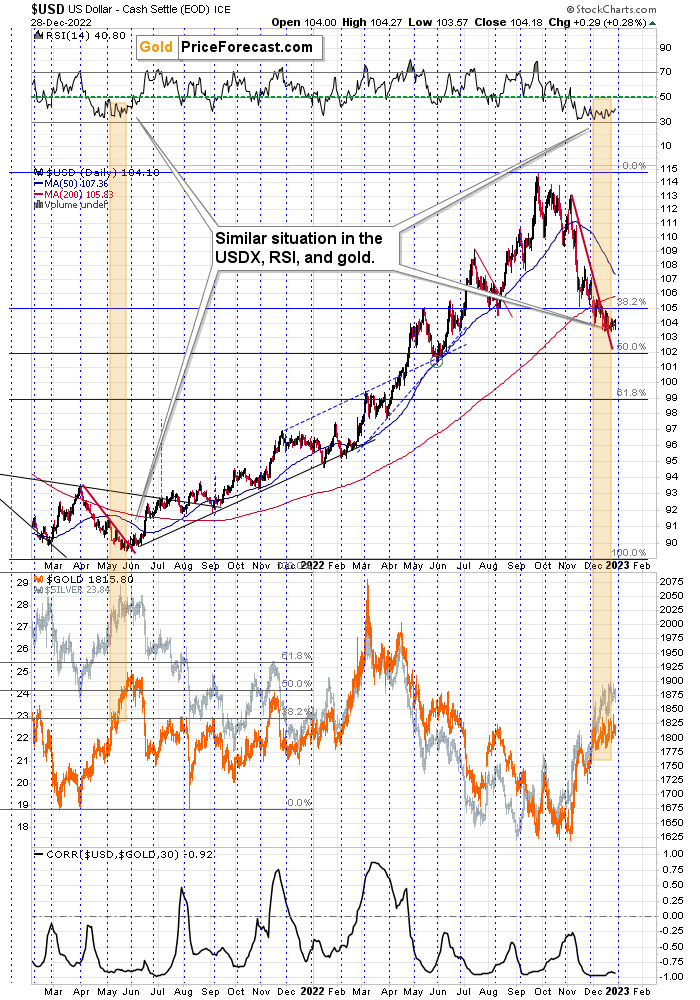
The RSI is after a lengthy consolidation right above the 30 level, and the USD Index is after a short-term breakout, which has been more than confirmed.
From a long-term point of view, the breakout above the 2016 and 2020 highs in the USDX has been fully verified.
All this means that the USD Index is likely to move higher, which, in turn, is likely to trigger declines in the precious metals sector. The relative performance of gold, silver, and mining stocks indicates that the precious metals sector just can’t wait for a good reason to start its next huge move lower. It looks like they’re about to get it.
Having said that, let’s take a look at the markets from a more fundamental point of view.
Gold Has a Real Problem
With gold, silver, mining stocks and the S&P 500 declining on Dec. 28, their holiday cheer has largely evaporated. Moreover, with real interest rates returning with a vengeance, we warned on Dec. 22 that the development was bearish for risk assets. We wrote:
Investors underestimate the degree to which policy actions cascade across markets.
Please see below:
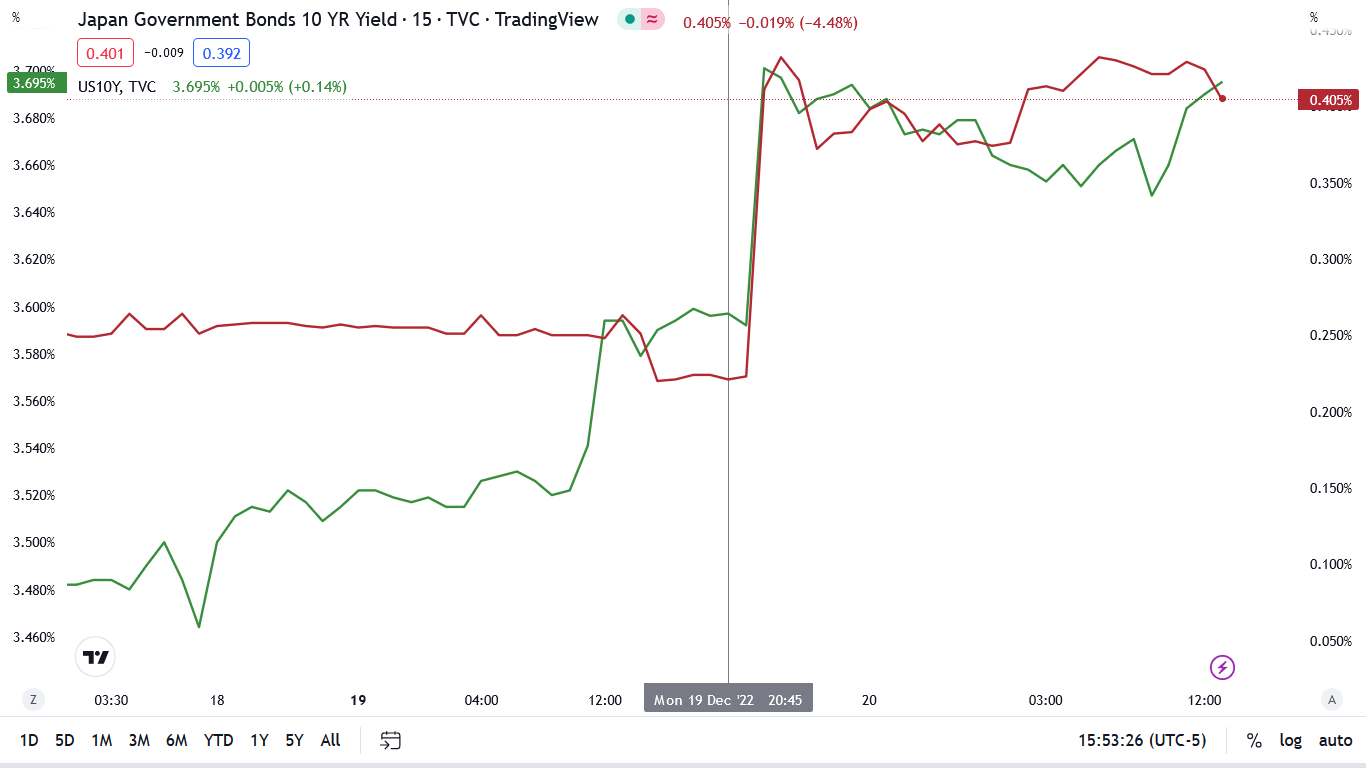
To explain, the red line above tracks the 15-minute movement of the 10-Year Japanese Government Bond (JGB) yield, while the green line above tracks the 15-minute movement of the U.S. 10-Year Treasury yield (10Y).
If you analyze the vertical gray line in the middle of the chart, you can see that the BOJ's monetary policy release sparked a sharp sell-off of the 10-year JGB and the yield soared. Likewise, with the 10Y following suit, American interest rates also rose materially.
More importantly, the U.S. 10-Year real yield jumped by three basis points on Dec. 20 to settle at 1.45%; and please remember, the metric was at 1.08% on Dec. 2, it's risen by 37 basis points in 18 days, and the development significantly reduces the appeal of risk assets. So, while the momentum investors don't care, the reality is that rising real yields should jolt investors in the weeks and months ahead.
To that point, the U.S. 10-Year real yield continued its ascent on Dec. 28, ending the session at 1.60%. On top of that, the metric has soared by 52 basis points in less than a month, and is only 14 basis points below its 2022 high.
Furthermore, the cascading effect of risk has overpowered the bullish seasonal period. For example, with the ECB upping the hawkish ante as well, its policy actions lit a fire under German interest rates (Germany is the Eurozone’s largest economy); and with the spillover effects continuing, the global rate rise is profoundly bearish for the gold price.
Please see below:
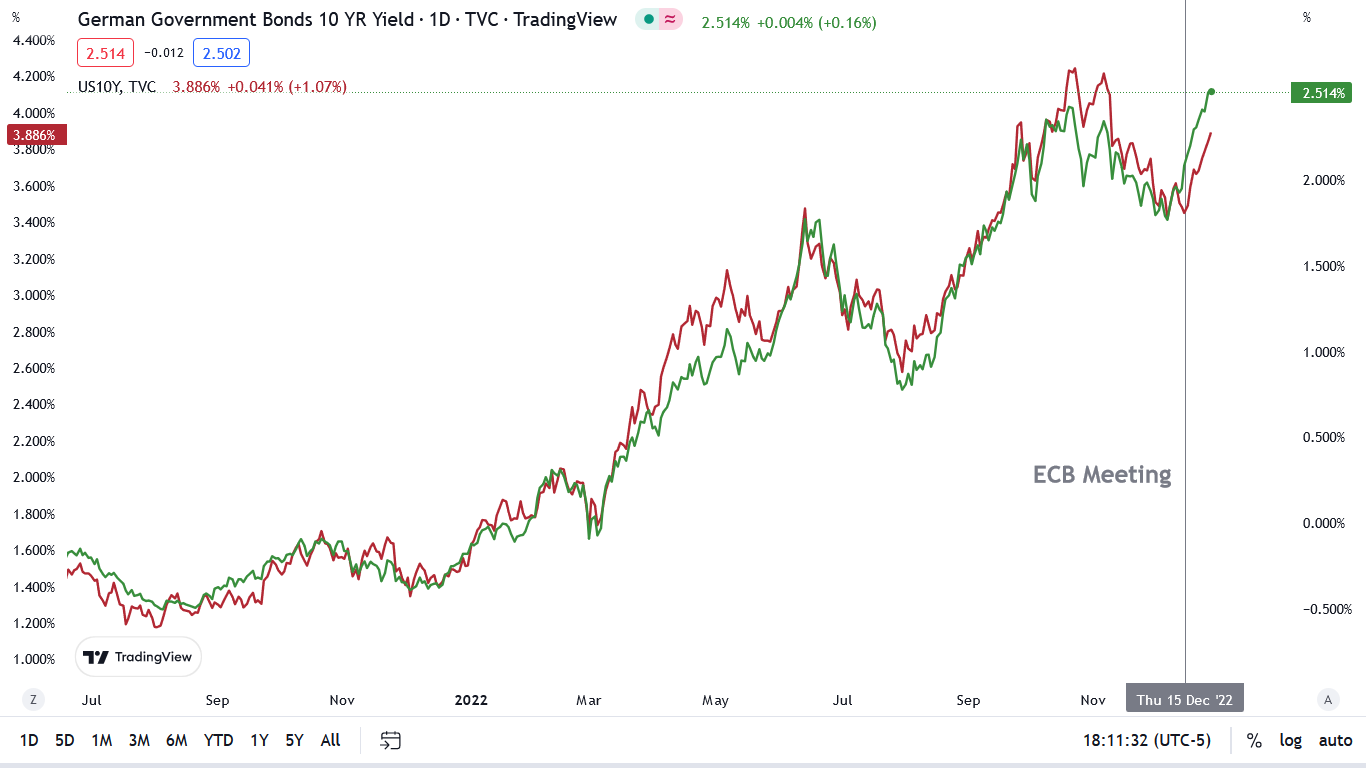
To explain, the green line above tracks the German 10-year bond yield, while the red line above tracks the U.S. 10-Year Treasury yield. If you analyze the relationship, you can see that the pair have been closely aligned since mid-2021.
More importantly, with the ECB’s reality check on Dec. 15 propelling the German 10-year bond yield higher, the U.S. 10-Year Treasury yield followed suit. Consequently, while the crowd assumed that lower interest rates would help uplift risk assets into year-end, they underestimated the interconnectedness of the financial markets.
Conversely, we expect the U.S. federal funds rate (FFR) to continue its ascent in 2023, and the U.S. 10-Year real yield to hit new highs. For context, we wrote on Oct. 7:
The U.S. 10-Year real yield often peaks alongside the FFR (or near it). As a result, with the Fed poised to raise the FFR by at least another 1.25% (to reach 4.5%), the U.S. 10-Year real yield should have more room to run, which is bullish for the USD Index.
Please see below:
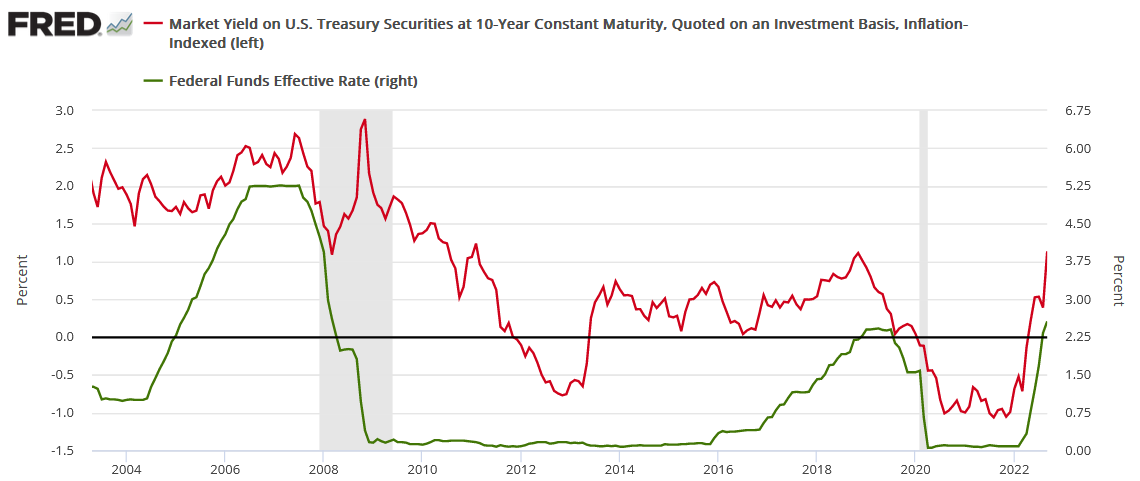
To explain, the red line above tracks the U.S. 10-Year real yield, while the green line above tracks the FFR. As you can see, a higher FFR supports higher real interest rates. Also, when the FFR hit ~4.5% in February 2006, the U.S. 10-Year real yield reached a monthly high of 2.14%, and it occurred with a YoY Consumer Price Index (CPI) at roughly half the current rate.
Likewise, with the economic data coming in hot recently, and inflation still highly underestimated, the 2022 theme of hawkish surprises should continue in 2023.
To that point, the Richmond Fed released its Fifth District Survey of Manufacturing Activity on Dec. 28. The headline index increased from -9 in November to 1 in December; and while both price indexes declined, the report stated:
“Alongside a slightly positive employment index, the wage index increased notably from 25 to 37 in December, surpassing its October reading of 34.”
As such, while we've warned repeatedly that wage growth is the inflationary canary in the coal mine, the results are bullish for the FFR. Similarly, with employment still resilient, the strength of the U.S. labor market allows the Fed to hammer inflation now and worry about the other half of its dual mandate later.
In addition, the Richmond Fed also released its Fifth District Survey of Service Sector Activity on Dec. 28; and while the headline index declined from -2 in November to -12 in December, an excerpt read:
“A larger share of firms reported decreases in their number of employees than increases in December. Their ability to find workers with the necessary skills also deteriorated slightly compared to last month.
“However, the expectations index for labor availability over the next six months saw a modest increase in December. Firms continued to increase wages and expect further wage increases in the near term.”
Thus, with a constructive employment backdrop coupled with continued price growth, the deceleration in goods inflation has been offset by a rise in services inflation. Therefore, while some areas of the U.S. economy have cooled, others are still far from supporting the Fed’s 2% objective.
Please see below:
 Source: Richmond Fed
Overall, the fundamentals continue to unfold as expected, and while the crowd cries for a dovish pivot, the data signals the exact opposite. Remember, the FFR has eclipsed the peak YoY core CPI in every inflation fight since 1961; and since the YoY core CPI peaked (for now) at 6.66% in September 2022, the historically-implied peak FFR is at least 6.67%.
So, while market participants were eager to call the FFR's peak at 3%, then 4% and now 5%, history materially contrasts this narrative; and while wishful thinking is popular in the financial markets, reality points to a much different outcome.
Silver Sees Red as Sentiment Shifts
With the S&P 500 continuing its downtrend on Dec. 28, the technicals remain bearish, and there have been no confirmed positive signals. Likewise, with the fundamentals also highly ominous, we warned on Oct. 26 that sentiment can only uplift risk assets for so long. We wrote:
With two of the four largest companies in the S&P 500 suffering, the squeeze may have already run its course. Moreover, while positioning is still heavily short, the index offered tactical value near 3,600, not 3,850.
In addition, with the bearish medium-term fundamentals rearing their ugly head, and the Fed poised to raise interest rates by 75 basis points next week, stocks offer a poor risk-reward proposition when the FFR should hit 4%.
To that point, with the S&P 500 ending the Dec. 28 session at ~3,783, the pivot crowd once again let false narratives cloud their judgment. Thus, while the New Year could elicit a shifting economic landscape that impacts gold, silver and mining stocks, we expect the bear market to continue in 2023.
To explain, the crowd materially underestimated inflation in 2021 and 2022, and the carnage endured by liquidity-fueled assets like Bitcoin and the ARKK ETF was devastating. Yet, while silver has similar fundamental attributes (non-yielding, benefits from QE and lower real yields), it has recovered its 2022 losses, even though it’s still down materially from its 2020 and 2021 highs.
But, with the liquidity drain that helped push the silver price below $18 poised to continue, it’s likely only a matter of time before the white metal cracks.
For example, we’ve noted how wage inflation allows Americans to absorb price increases that match their salary increases. In a nutshell: if wages are running at 5%+, it’s nearly impossible to get output inflation below 5%; and with the fundamental environment nodding in agreement, the FFR’s continued rise should rattle investors in 2023.
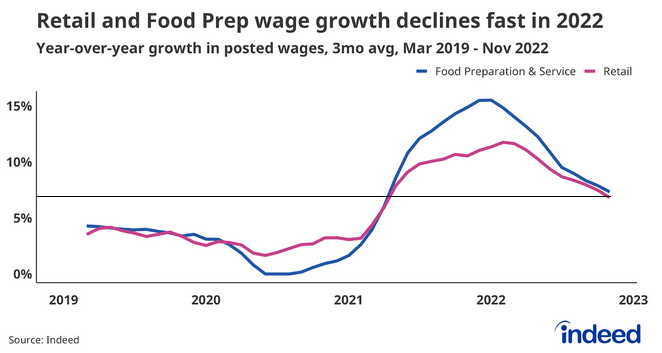
As evidence, Indeed released its fourth-quarter Labor Market Update on Dec. 27, which covers the U.S. retail, health care, business-to-business (B2B) and transportation areas of the U.S. economy.
Regarding retail, an excerpt read:
“Wages in service categories like these grew quite quickly in 2022 as employers competed for talent, with Food Preparation & Service wage growth nearing 15% over the summer. Toward the end of the year wage growth for Retail and Food Preparation & Service fell dramatically, both now at about 7%.”
Please see below:
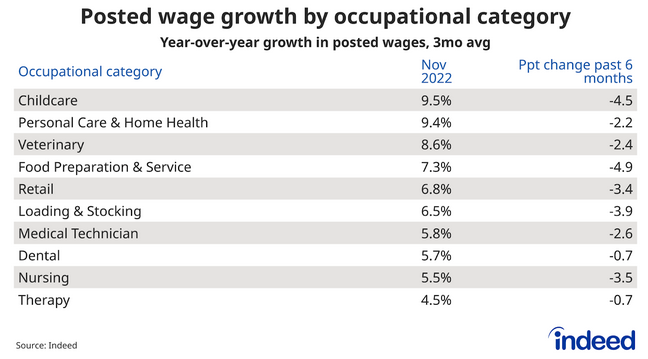
Regarding health care, an excerpt read:
“Strong demand for workers has kept wage growth in some categories quite high, as evidenced by Personal Care & Home Health wage growth of 9.4% exceeding that of the overall labor market. However, all healthcare categories have seen wage growth slow in the past six months.”
Please see below:
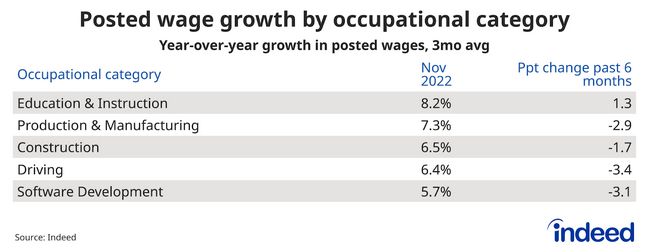
Regarding B2B, an excerpt read:
“Wage growth in segments inside of the business-to-business vertical has slowed as well. While all categories in the B2B vertical in November notched high wage growth, over 5% year-over-year, all but Education & Instruction have seen wage growth slow in the past six months.”
Please see below:
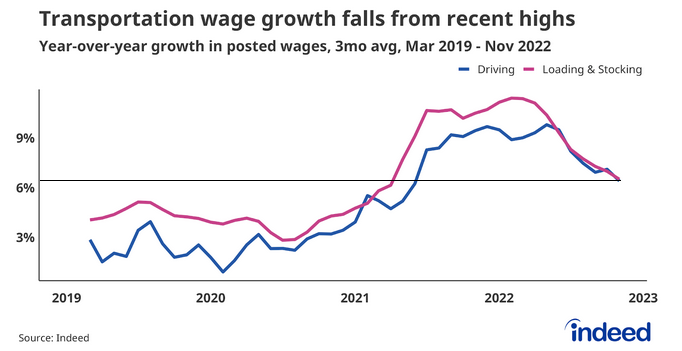
Regarding transportation, an excerpt read:
“The chart below shows year-over-year (YoY) wage growth for Driving and Loading & Stocking roles. After peaking in early 2022, wage growth for both categories has dropped substantially, although still remains above pre-pandemic level as transportation workers stay in demand.”
Please see below:
Now, while Indeed’s report stated that wage inflation has “slowed” recently, it should decelerate after the Fed hikes interest rates 17 times (25 basis point increments). But, the more important development is that employees across the four cohorts are still experiencing wage inflation of roughly 6% or more.
Therefore, salary increases are running at roughly 3x the Fed’s desired level, and the results highlight why the FFR is still well below the level that creates the demand destruction necessary to curb inflation.
Again, we’ve stated repeatedly that if unanchored inflation was easy to tame, nine of the last 10 bouts of inflation wouldn’t have ended with recessions. Remember, every FOMC committee in history would have loved to keep the FFR at 3% or 4% and watched a 9%+ CPI magically fall back to 2%.
However, they realized the prospect was highly unrealistic, and they were forced to raise the FFR to appropriate levels and endure recessions. So, while the crowd assumes that ‘this time is different,’ normalizing unanchored inflation has nearly always resulted in immense economic pain.
As a result, with a recession highly likely in late 2023, and investors known to price in these developments well in advance, the silver price should suffer mightily during the first half of 2023. For context, we wrote on Nov. 23:
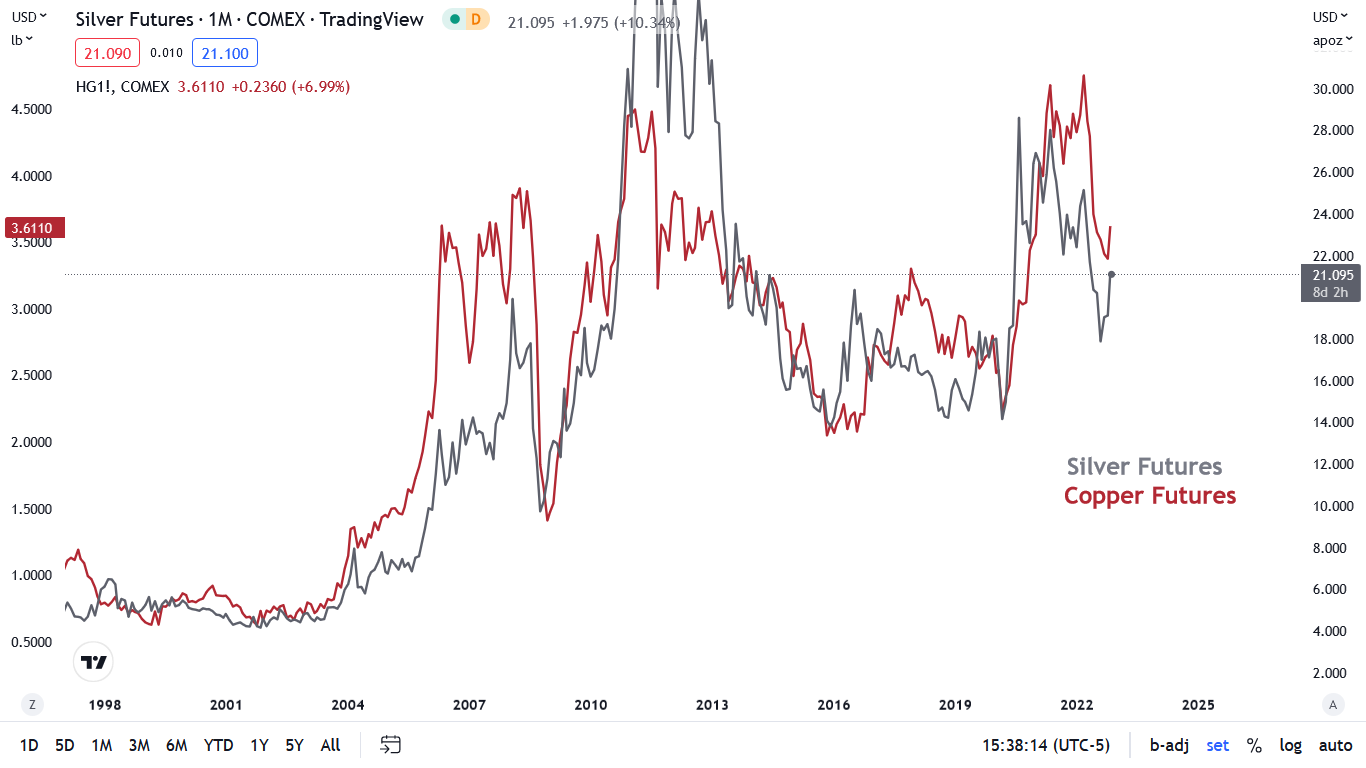
The gray line above tracks the monthly movement of the silver futures price, while the red line above tracks the monthly movement of the copper futures price. If you analyze the relationship, you can see that they often follow in each other’s footsteps over the long term.
Furthermore, when the recession hit in 2001, it culminated with a ~20% decline in the silver futures price, while the 2007-2009 recession resulted in a ~46% drop, and the 2020 recession resulted in a ~23% drop. Consequently, while silver may seem like a solid momentum play when prices rise, the reversals can be just as violent on the downside.
Overall, silver has outperformed stocks and bonds in December, as momentum investors have become fond of the white metal. Yet, the TLT ETF closed below $100 on Dec. 28 for the first time since Nov. 18, which highlights the recent rise in interest rates; and with more of the same poised to commence over the medium term, the precious metals should have plenty of catching up to do on the downside.
The Bottom Line
Risk assets retreated, and we warned that real yields were quietly staging a comeback. Moreover, while the USD Index has suffered in recent months, we expect the dollar basket to hit new highs in 2023. In addition, the S&P 500 has erased nearly all of its CPI-induced squeeze gains from Nov. 10, as technical and fundamental realities have overtaken misguided sentiment. As such, we believe this bear market has plenty of room to run.
In conclusion, the PMs declined on Dec. 28, as the real yield surge continued; and with the USD Index joining the party, please remember that higher real yields are bullish for the greenback. Consequently, the two-headed monster should inflict more pain on the PMs in 2023.
Overview of the Upcoming Part of the Decline
- It seems to me that the corrective upswing is over (or about to be over) and that the next big move lower is already underway (or that it’s about to start).
- If we see a situation where miners slide in a meaningful and volatile way while silver doesn’t (it just declines moderately), I plan to – once again – switch from short positions in miners to short positions in silver. At this time, it’s too early to say at what price levels this could take place and if we get this kind of opportunity at all – perhaps with gold prices close to $1,500 - $1,550.
- I plan to switch from the short positions in junior mining stocks or silver (whichever I’ll have at that moment) to long positions in junior mining stocks when gold / mining stocks move to their 2020 lows (approximately). While I’m probably not going to write about it at this stage yet, this is when some investors might consider getting back in with their long-term investing capital (or perhaps 1/3 or 1/2 thereof).
- I plan to return to short positions in junior mining stocks after a rebound – and the rebound could take gold from about $1,450 to about $1,550, and it could take the GDXJ from about $20 to about $24. In other words, I’m currently planning to go long when GDXJ is close to $20 (which might take place when gold is close to $1,450), and I’m planning to exit this long position and re-enter the short position once we see a corrective rally to $24 in the GDXJ (which might take place when gold is close to $1,550).
- I plan to exit all remaining short positions once gold shows substantial strength relative to the USD Index while the latter is still rallying. This may be the case with gold prices close to $1,400 and GDXJ close to $15 . This moment (when gold performs very strongly against the rallying USD and miners are strong relative to gold after its substantial decline) is likely to be the best entry point for long-term investments, in my view. This can also happen with gold close to $1,400, but at the moment it’s too early to say with certainty.
- The above is based on the information available today, and it might change in the following days/weeks.
You will find my general overview of the outlook for gold on the chart below:
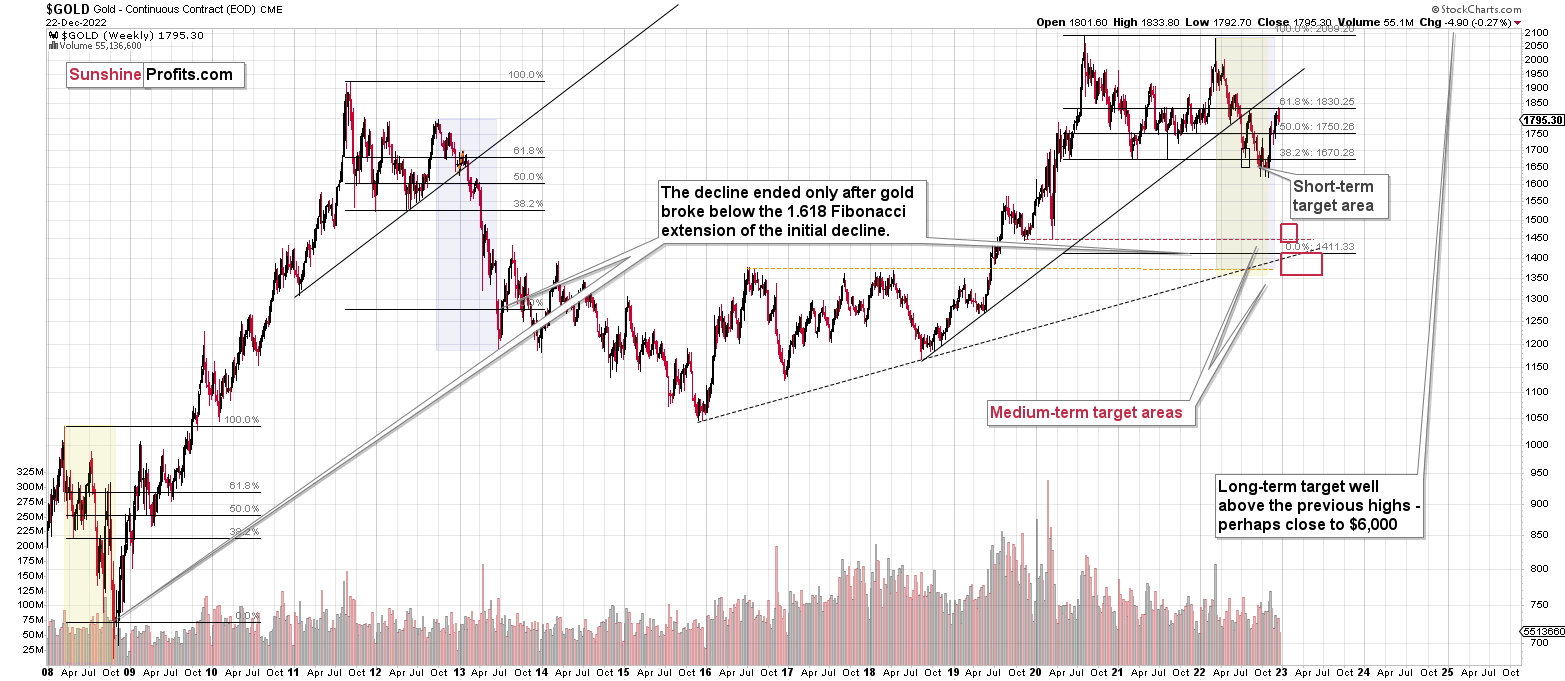
Please note that the above timing details are relatively broad and “for general overview only” – so that you know more or less what I think and how volatile I think the moves are likely to be – on an approximate basis. These time targets are not binding nor clear enough for me to think that they should be used for purchasing options, warrants, or similar instruments.
Letters to the Editor
We received a few messages over e-mail, but as we are moving to our new platform, we will be transferring them below the articles as comments – and that’s where we’ll be replying to them.
Asking your questions below the articles or in the spaces called “Ask the Community” or “Position Sizes” directly will help us deliver a reply sooner. In some cases, someone from the community might reply and help even before we do.
Please remember about the Pillars of our Community, especially about the Kindness of Speech Pillar.
Also, if there’s anything that you’re unhappy with, it’s best to send us a message at [email protected].
Please note that this section is going to go away within the next 1-8 weeks, as you can add comments/questions below the article on Golden Meadow – the platform that we’re using to provide our analyses. Your notification e-mails include an invitation link that allows you to access the “Gold Trading Alerts” space.
Also, if you haven’t had the chance to see the video, in which I’m talking about the new platform and why we essentially moved from Sunshine Profits to Golden Meadow, I strongly encourage you to do so:
Summary
Summing up, it seems that the major bottom in the USD Index is in, while the correction in stocks, gold, silver, and mining stocks is over.
The nature of the recent corrections was mostly technical and rumor-based. The rumor was that the Fed would be making a dovish U-turn soon, and it recently became clear that this was not going to be the case. Consequently, the corrective upswing is likely to be reversed, and medium-term downtrends are likely to resume.
In my opinion, the current trading position is going to become profitable in the following weeks, and quite possibly in the following days. And while I can’t promise any kind of performance, I fully expect it to become very profitable before it’s over and to prolong our 2022 winning streak.
After the final sell-off (that takes gold to about $1,350-$1,500), I expect the precious metals to rally significantly. The final part of the decline might take as little as 1-5 weeks, so it's important to stay alert to any changes.
As always, we'll keep you – our subscribers – informed.
To summarize:
Trading capital (supplementary part of the portfolio; our opinion): Full speculative short positions (300% of the full position) in junior mining stocks are justified from the risk to reward point of view with the following binding exit profit-take price levels:
Mining stocks (price levels for the GDXJ ETF): binding profit-take exit price: $20.32; stop-loss: none (the volatility is too big to justify a stop-loss order in case of this particular trade)
Alternatively, if one seeks leverage, we’re providing the binding profit-take levels for the JDST (2x leveraged). The binding profit-take level for the JDST: $22.87; stop-loss for the JDST: none (the volatility is too big to justify a SL order in case of this particular trade).
For-your-information targets (our opinion; we continue to think that mining stocks are the preferred way of taking advantage of the upcoming price move, but if for whatever reason one wants / has to use silver or gold for this trade, we are providing the details anyway.):
Silver futures downside profit-take exit price: $14.32
SLV profit-take exit price: $13.42
ZSL profit-take exit price: $48.87
Gold futures downside profit-take exit price: $1,504
HGD.TO – alternative (Canadian) 2x inverse leveraged gold stocks ETF – the upside profit-take exit price: $16.47
HZD.TO – alternative (Canadian) 2x inverse leveraged silver ETF – the upside profit-take exit price: $36.87
Long-term capital (core part of the portfolio; our opinion): No positions (in other words: cash)
Insurance capital (core part of the portfolio; our opinion): Full position
Whether you’ve already subscribed or not, we encourage you to find out how to make the most of our alerts and read our replies to the most common alert-and-gold-trading-related-questions.
Please note that we describe the situation for the day that the alert is posted in the trading section. In other words, if we are writing about a speculative position, it means that it is up-to-date on the day it was posted. We are also featuring the initial target prices to decide whether keeping a position on a given day is in tune with your approach (some moves are too small for medium-term traders, and some might appear too big for day-traders).
Additionally, you might want to read why our stop-loss orders are usually relatively far from the current price.
Please note that a full position doesn't mean using all of the capital for a given trade. You will find details on our thoughts on gold portfolio structuring in the Key Insights section on our website.
As a reminder - "initial target price" means exactly that - an "initial" one. It's not a price level at which we suggest closing positions. If this becomes the case (as it did in the previous trade), we will refer to these levels as levels of exit orders (exactly as we've done previously). Stop-loss levels, however, are naturally not "initial", but something that, in our opinion, might be entered as an order.
Since it is impossible to synchronize target prices and stop-loss levels for all the ETFs and ETNs with the main markets that we provide these levels for (gold, silver and mining stocks - the GDX ETF), the stop-loss levels and target prices for other ETNs and ETF (among other: UGL, GLL, AGQ, ZSL, NUGT, DUST, JNUG, JDST) are provided as supplementary, and not as "final". This means that if a stop-loss or a target level is reached for any of the "additional instruments" (GLL for instance), but not for the "main instrument" (gold in this case), we will view positions in both gold and GLL as still open and the stop-loss for GLL would have to be moved lower. On the other hand, if gold moves to a stop-loss level but GLL doesn't, then we will view both positions (in gold and GLL) as closed. In other words, since it's not possible to be 100% certain that each related instrument moves to a given level when the underlying instrument does, we can't provide levels that would be binding. The levels that we do provide are our best estimate of the levels that will correspond to the levels in the underlying assets, but it will be the underlying assets that one will need to focus on regarding the signs pointing to closing a given position or keeping it open. We might adjust the levels in the "additional instruments" without adjusting the levels in the "main instruments", which will simply mean that we have improved our estimation of these levels, not that we changed our outlook on the markets. We are already working on a tool that would update these levels daily for the most popular ETFs, ETNs and individual mining stocks.
Our preferred ways to invest in and to trade gold along with the reasoning can be found in the how to buy gold section. Furthermore, our preferred ETFs and ETNs can be found in our Gold & Silver ETF Ranking.
As a reminder, Gold & Silver Trading Alerts are posted before or on each trading day (we usually post them before the opening bell, but we don't promise doing that each day). If there's anything urgent, we will send you an additional small alert before posting the main one.
Thank you.
Przemyslaw K. Radomski, CFA
Founder, Editor-in-chief

