

Briefly: In our opinion, full (200% of the regular size of the position) speculative short positions in gold, silver and mining stocks are justified from the risk/reward perspective at the moment of publishing this alert.
The turning points for this week are looming and there was no meaningful move so far. At its beginning, yesterday’s session seemed to be a decline, but ultimately it turned out to be a reversal. The opposite was the case for the USD Index. So the question is: if the turning points have already played out and we have seen a short-term bottom in the PMs, should we still expect to see a major slide shortly and a true bottom later this week? In today’s alert we’ll deliver our reply.
In short, based on the shape of yesterday’s price performance in the precious metals and in the USDX, we’ll have to take into account the possibility that the scenario we described previously will not be realized and instead we’ll see something different.
So will the turning points not work this time?
They probably will, as they confirmed their usefulness too many times for us and it’s too soon to discard them based on just one session. However, they may have a different effect than it originally seemed likely. Namely, it seemed probable that we will see a decline and a local bottom this week. But, there was no decline and instead we even saw a small upswing in silver. If there was no short-term decline, then why would the turning point trigger a rally? It might as well be the case that the turning points will trigger not a rally, but a decline.
The very short-term rise is not really visible in case of gold, but it is visible in case of silver and somewhat visible in case of miners (especially yesterday’s session). The USD Index formed a bearish reversal yesterday and while it doesn’t necessarily imply the end of the USDX’s rally, it may signal a day or two of price drop , just like what we saw earlier this month.
Let’s check how the bullish case could play out.
The USD Index’s Reversal
In May the 16th, 2018 Alert, we wrote the following:
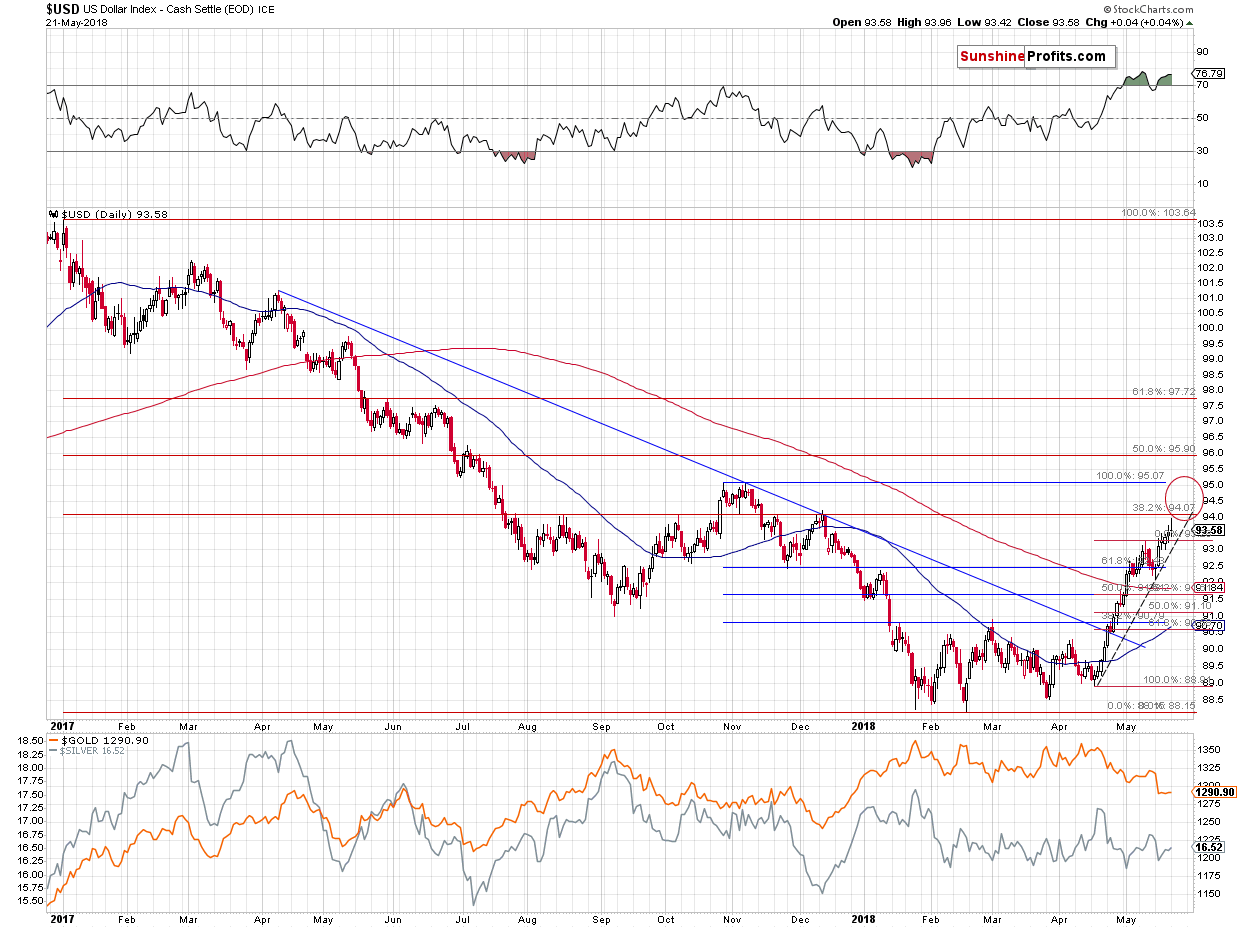
The situation in the USD Index was the only thing that had bullish implications for the PMs and based on what happened yesterday, the implications are now bearish. The USDX moved to new 2018 highs in terms of both intraday and closing prices. This invalidates the previous theory according to which there will be another short-term downswing after a few days of pause. Based on the breakout, this is no longer likely. Instead, the USD is now likely to move to the next resistance or even higher (in fact, our short positions in EUR/USD are already profitable). The next two target prices are at about 94 and 95. The former is provided by the December 2017 top and the latter is based on the October / November top. The 94 level seems more important as it is strengthened by the August and early October tops and the 38.2% Fibonacci retracement level.
The USD Index just moved to the lower of the above-mentioned targets. To be precise, the USD topped 0.11 below the resistance provided by the 38.2% Fibonacci retracement levels, but it’s definitely close enough for one to say that the lower border of the target was reached.
That’s a strong resistance and the reversal was quite visible, which should serve as a powerful bearish sign, especially the RSI indicator is showing extremely overbought levels.
But, as always, the context is king.
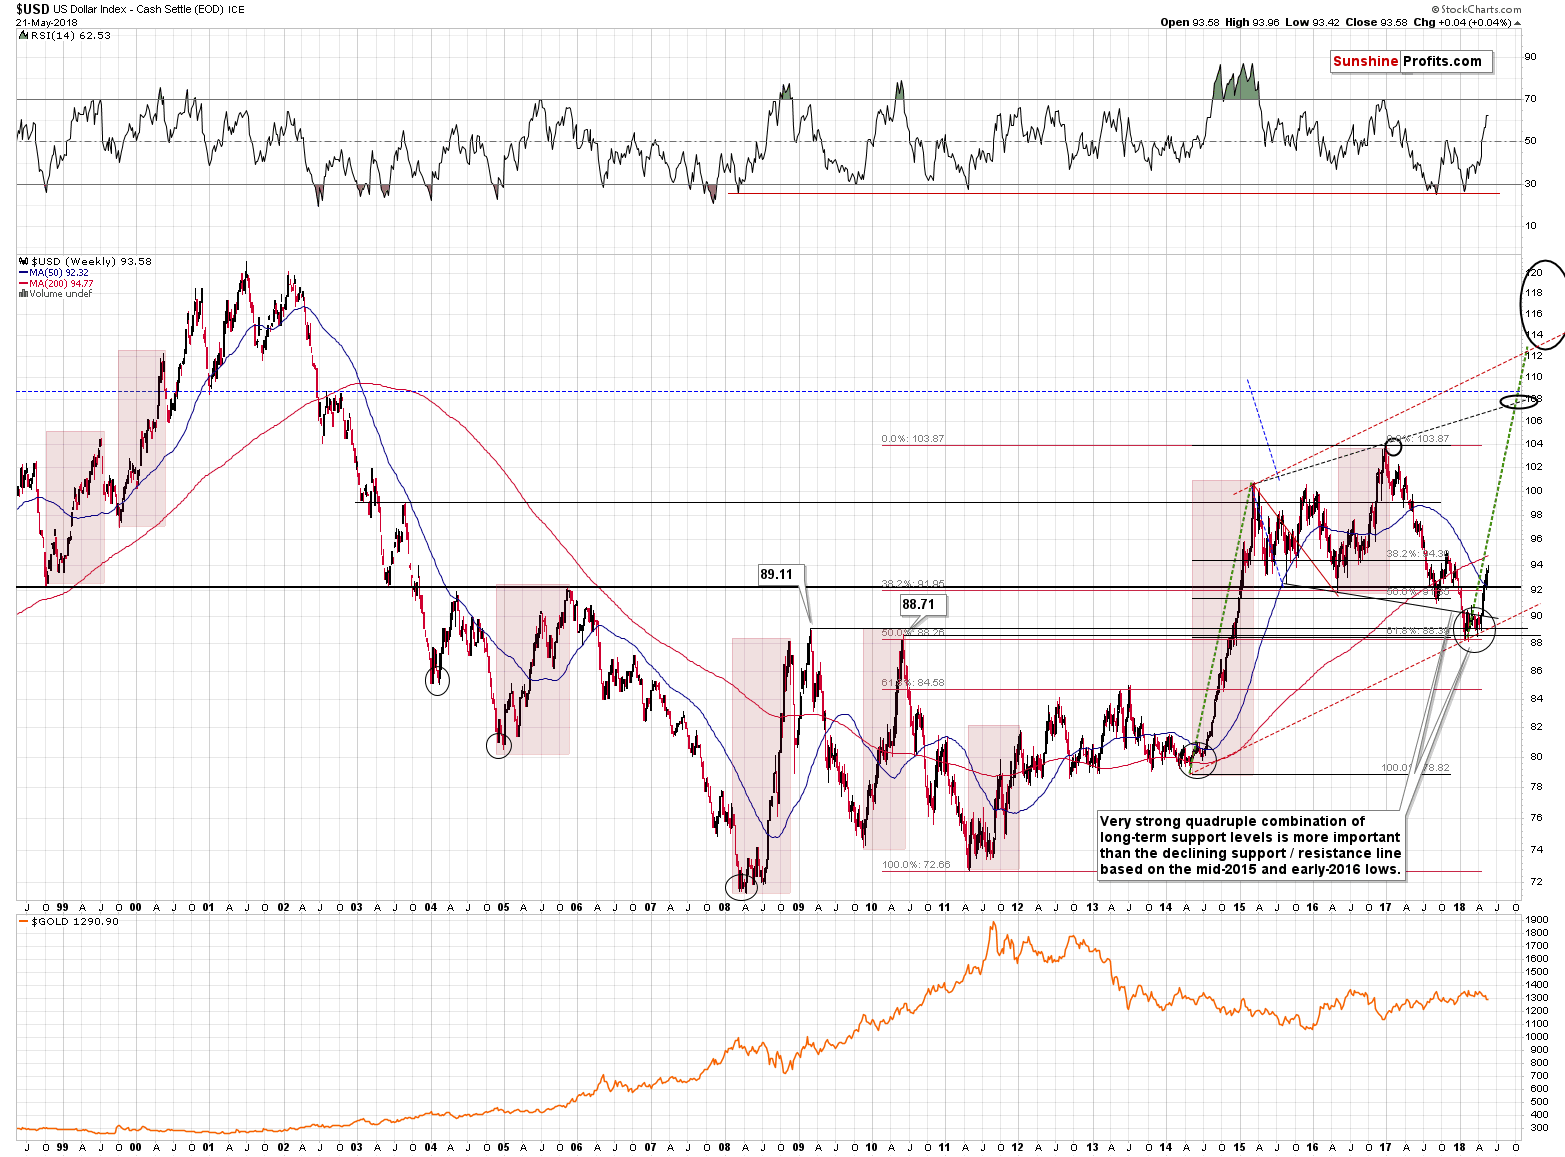
If the current rally in the USDX is to continue to be similar to the 2014 one (and this seems likely in our view), then we shouldn’t expect a major weakness anytime soon.
Surely, there will be some local pullbacks, but most likely nothing that’s particularly visible from the long-term point of view.
Moreover, please note that the RSI is not yet overbought from the long-term point of view and back in 2014 and 2015 the rally didn’t end even when it was extremely overbought.
So, should we really expect a major decline in the USD Index shortly? Not really. The short-term USD chart includes a rising dashed support line that’s based on the most recent local bottoms. It shows support at about 93, which is very close to the current value of the index. This could be the potential size of the decline that we could see shortly. After that, the rally would most likely continue.
Having said that, let’s move back to the precious metals market, starting with gold.
Gold’s Upside Target
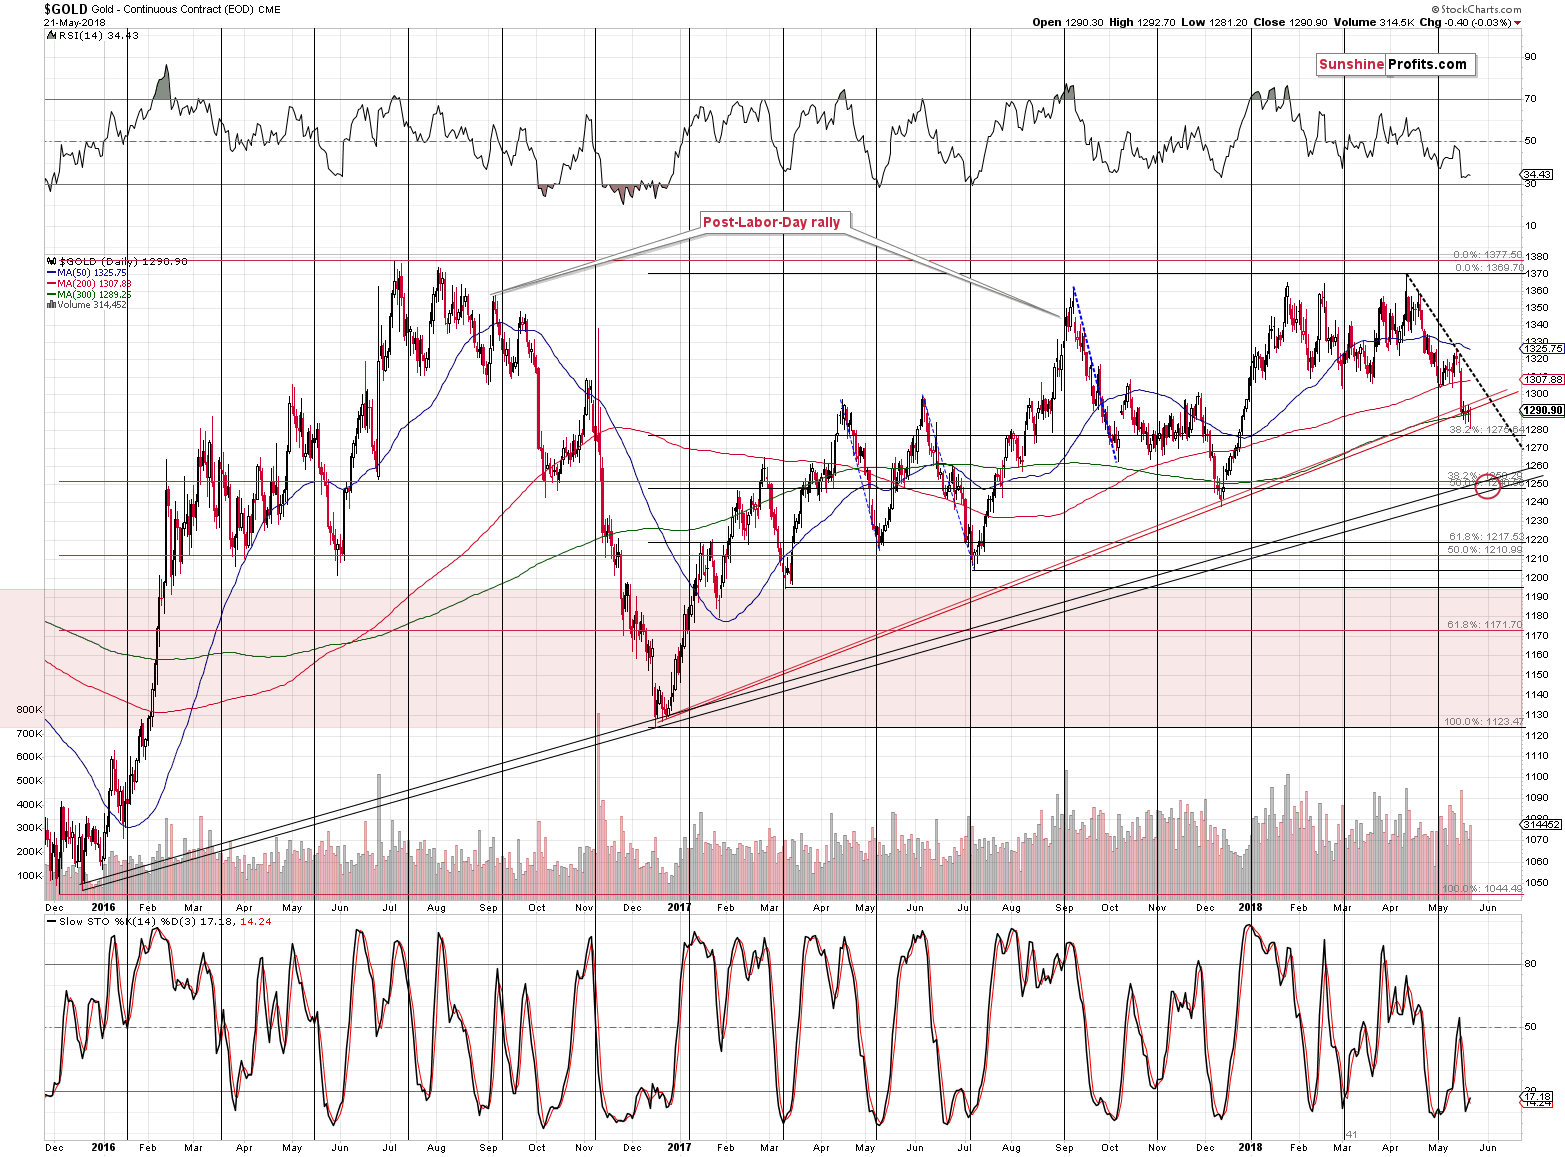
If the above-mentioned downswing in the USD Index does indeed materialize, we will most likely see gold prices rising temporarily. The analogous line to USD’s rising support is the declining dashed resistance line and it points to resistance at about $1,310. The additional resistance is provided by the previous lows between $1,303 and $1,309. Consequently, we may be looking at a rally of $13 - $20.
This may appear tradable at first sight, but let’s keep in mind that this level could be reached on an intraday or overnight basis only and that the follow-up move could be very sharp (note the early October 2016 decline that happened from more or less the same price levels).
Moreover, please note that gold didn’t magnify USD’s downside move. If gold was really about to soar, it would have been likely to multiply USD’s downswing by rallying more and closing the session visibly higher instead of just reversing. Consequently, there is no reason to expect gold’s upswing – if it materializes at all – to be anything to call home about.
Silver’s Upswing
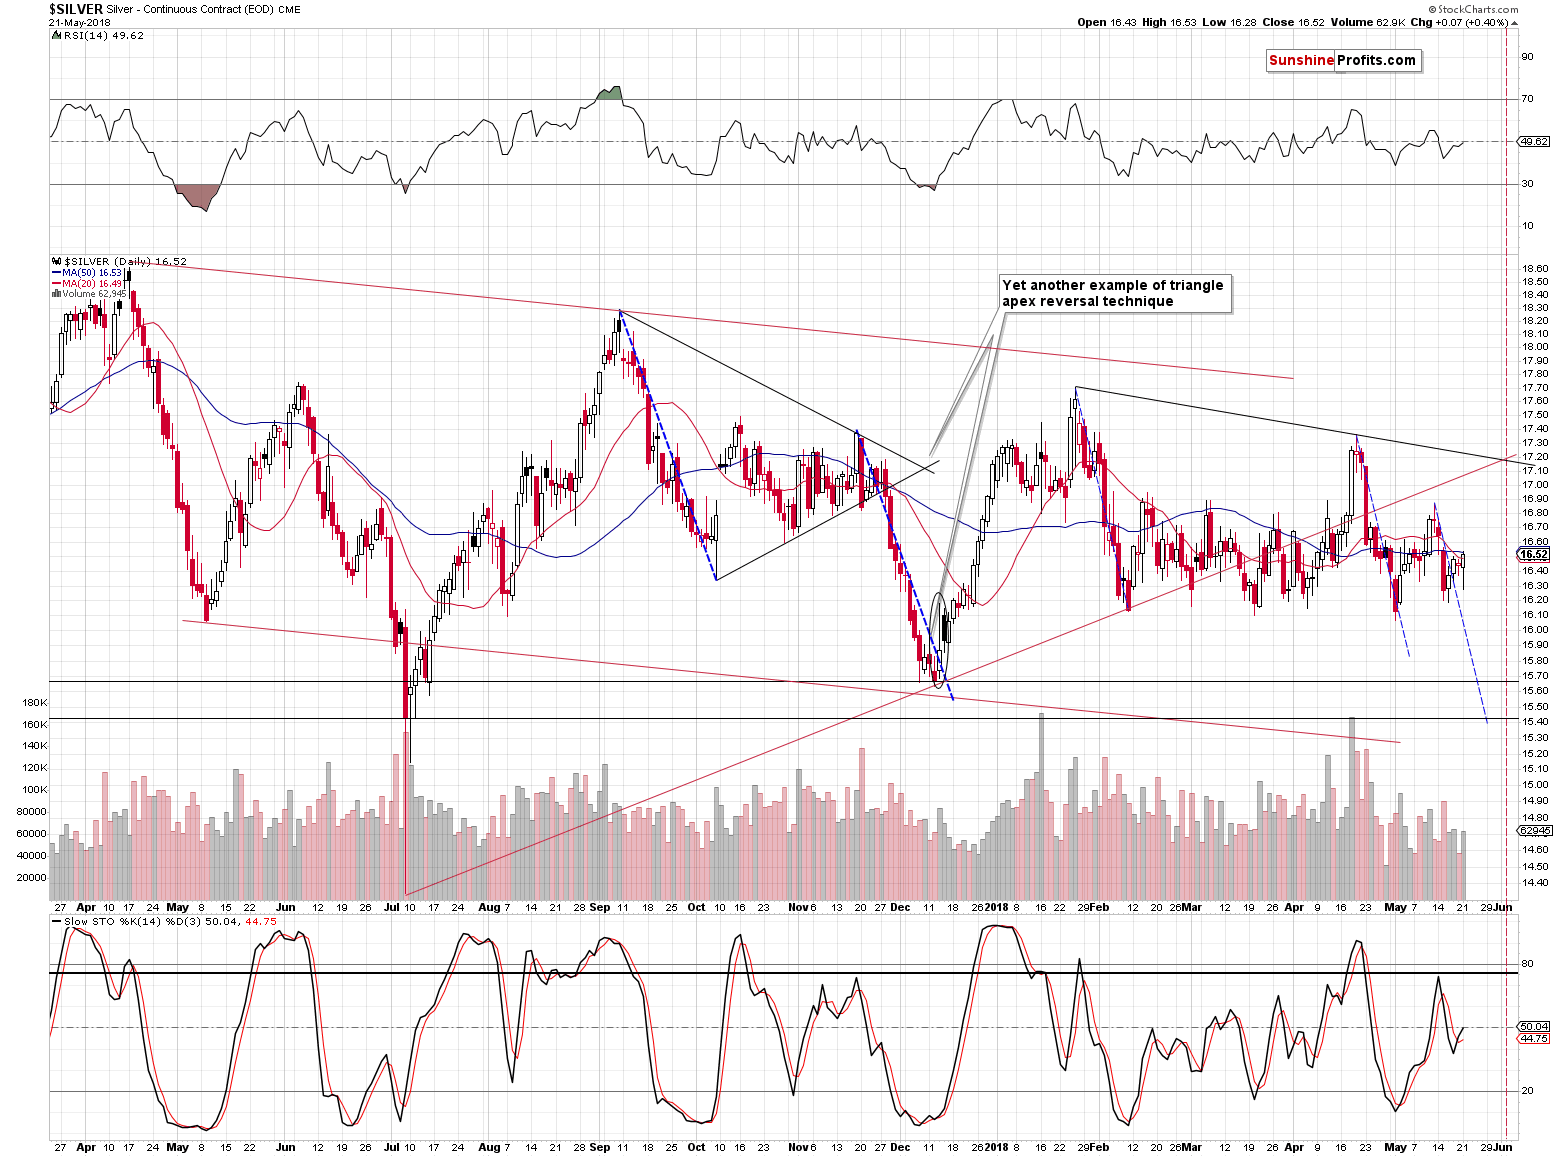
While gold hasn’t done much recently, the white metal definitely moved higher also during yesterday’s session. As we mentioned many times, silver’s short-term outperformance is not a bullish sign – conversely, it’s something that indicates looming declines.
Silver also tends to rally in a visible way just before turning south and we may have already seen this kind of performance yesterday. Silver’s move higher was not particularly strong on a stand-alone basis, but it was definitely important and relative to what happened in gold. The above seems bearish, but let’s keep in mind that it doesn’t necessarily mean that the outperformance is already over. Consequently, the very short-term outlook for the white metal is rather unclear. We might see a big plunge shortly, but we may also see a move back to $17 or so before the downswing materializes.
Normally, “when in doubt, stay out” rule applies to such situations, but in this case, it may be interpreted as “when in doubt, stay out of very short-term trading and stick to what’s very probable in the medium term”. If we have just several months during which PMs are likely to move much lower, then the surprises are going to be to the downside and these surprises are going to be huge.
Mining Stocks Low-volume Strength
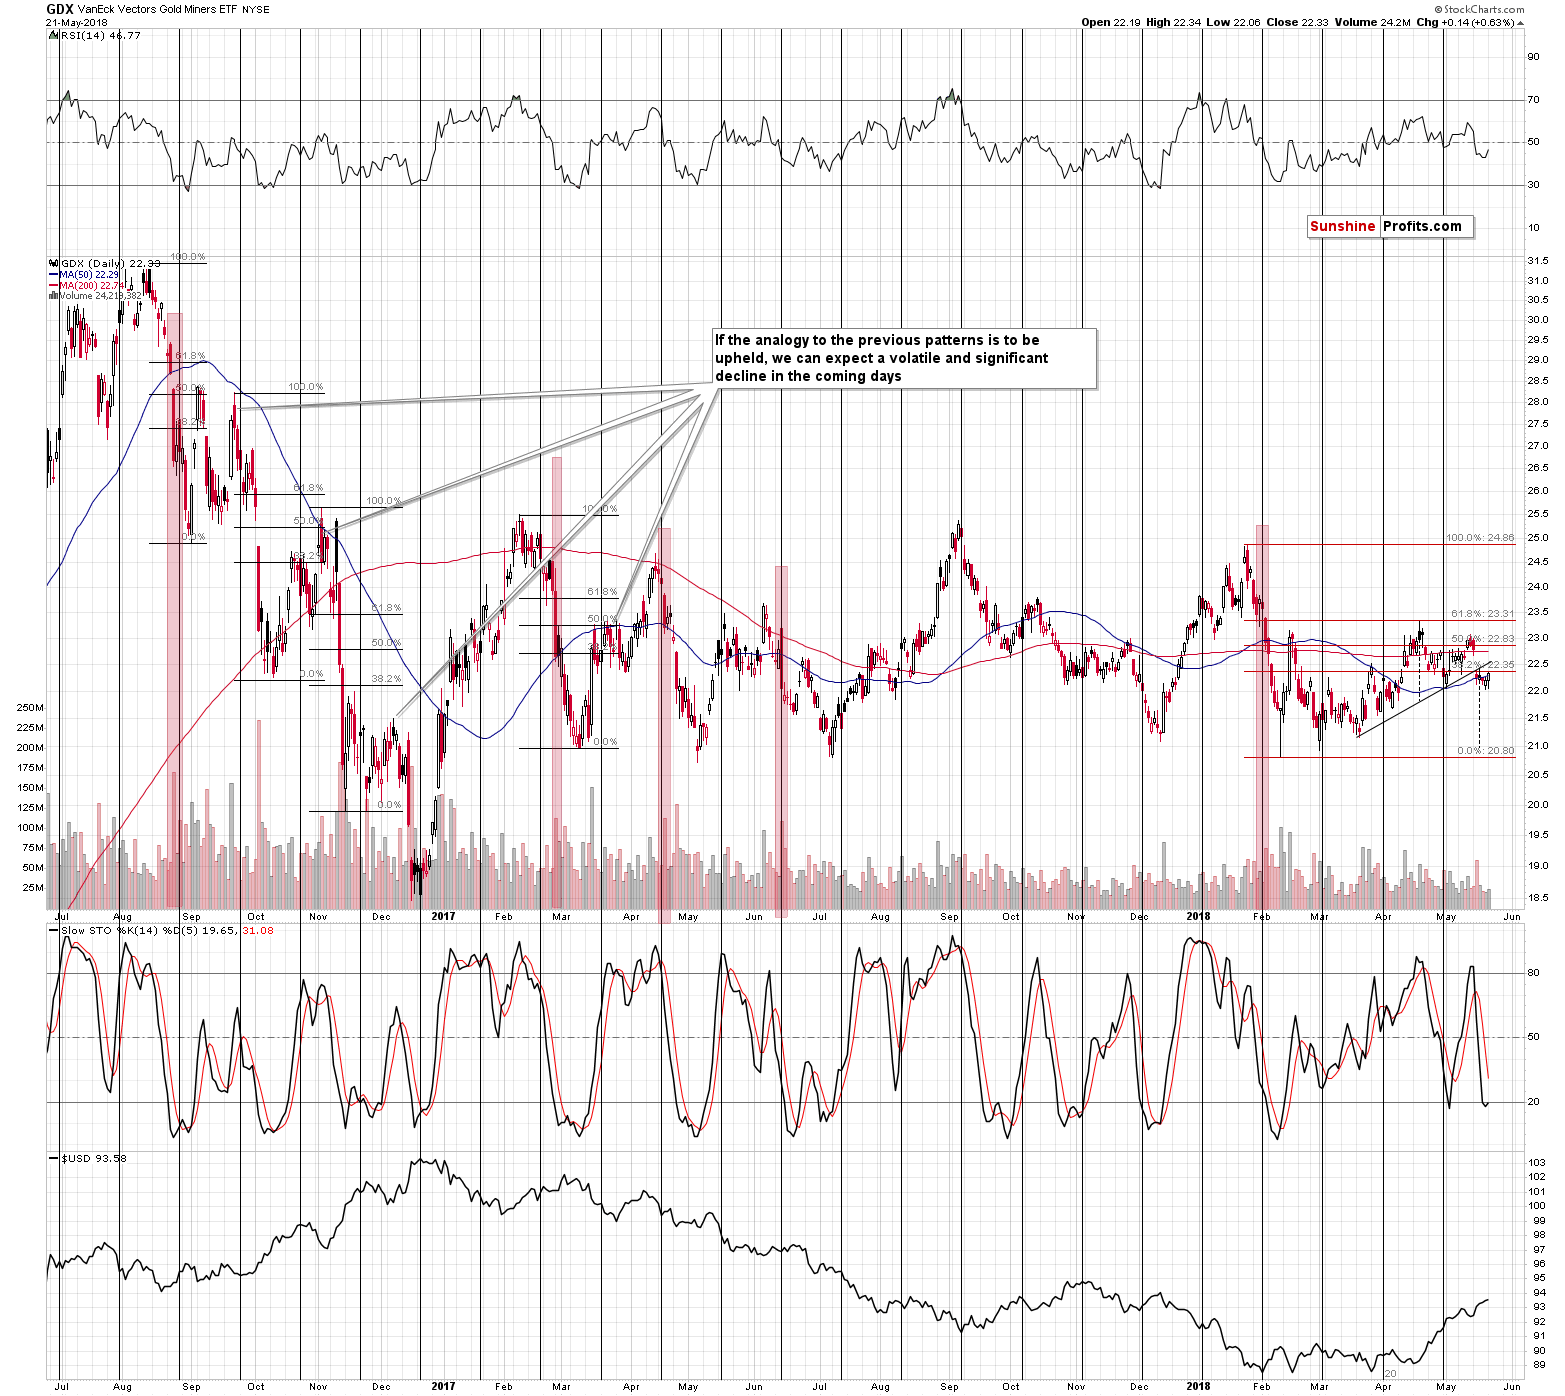
In yesterday’s alert, we described the situation in the mining stocks in the following way:
The breakdown in mining stocks is more than confirmed and while some may say that Friday’s intraday reversal invalidates the bearish picture, it’s not really the case.
The reason is that the volume that accompanied the “reversal” was weak. True reversals work because they show how buying power overcomes the selling pressure and take the price back up before the end of the day. In other words, it’s about showing who won a fierce battle. The volume confirms that this was indeed the case. If the volume is low, it means that there was no fierce battle, and thus no major victory. Therefore, there are no important implications.
Consequently, Friday’s session didn’t have bullish implications – it was yet another session during which mining stocks didn’t manage to invalidate the breakdown below the rising neck level of the bearish head-and-shoulders pattern and the 61.8% Fibonacci retracement level.
The volume that we saw during yesterday’s small upswing was not significant either, so it didn’t really change the outlook. In case of the miners the bullish case for the very short term seems weakest and the reason is that the miners tend to underperform at or very close to the tops (there are exceptions, though). In this case, we could see the GDX move once again back to the previously broken neck level of the head-and-shoulders pattern, which is currently at about $22.60. This move doesn’t seem significant enough to be worth trading, especially that both above-mentioned breakdowns were not invalidated and continue to have bearish implications.
Updated Game Plan
As one can read in our previous analyses, the precious metals sector could reverse temporarily this Wednesday or Thursday based on gold and silver’s apex-based turning points. These turning points provided to be extremely useful once again only a few days ago, so we should definitely pay attention to them.
We also emphasized that the above was what seemed most likely at this time, but we were not discarding other possibilities. It’s more important to stay flexible when the new developments emerge than to stick to one’s original scenario – and we plan to do so.
Based on yesterday’s performance in gold and the USD and the recent performance in silver and miners, it could be the case that the above-mentioned turning points will work differently. Namely, we could have somewhat higher prices of metals and miners today, tomorrow and possibly this Thursday and a big decline from that point.
So, we have one case (gold’s quick move to $1,250) that’s very bearish for the short term and based on it the short-term position seems justified. We also have another case (gold’s quick rise before it slides again to $1,250) that’s somewhat bullish for the short term, but that doesn’t seem worth trading as the potential upswing seems too small and the probability that it doesn’t happen at all is too high. Plus, the latter would mean a bet against the very strong medium-term trend.
Taking both scenarios into account, we decided to stick to our current speculative short position and wait out the possible adverse moves in the next few days. If the metals decline right away, we are still prepared to take profits close to $1,250 in gold.
On a side note, while we’re discussing the target for gold, we would like to reply to a question that we received recently. The question was: how high gold could bounce once it bottoms at $1,250? Our best guesstimate is: $1,275 as that’s the 38.2 Fibonacci retracement based on the December 2016 – 2018 rally, but at this point it’s just that – a guesstimate. If miners show great strength during this decline (doubtful), we’ll likely place the target higher and if they show exceptional weakness (more likely), we may even lower it. We have likely entered the stage of the decline when timing any corrective upswings will be particularly difficult and tricky and if there is not enough bullish signs, it will probably be best to stick to the original position or perhaps only limiting it.
Summary
Summing up, based on yesterday’s session, we have increased probability that instead of a quick decline and a turnaround on Wednesday or Thursday, we’ll see a quick (yet rather insignificant) upswing and a bearish turnaround this Wednesday or Thursday. Based on the current medium-term trend and the strength of the signals that confirm it along with the doubtful strength of the possible upswing, it seems that it’s justified to keep the current speculative short positions intact.
As always, we will keep you – our subscribers – informed.
To summarize:
Trading capital (supplementary part of the portfolio; our opinion): Full short positions (200% of the full position) in gold, silver and mining stocks are justified from the risk/reward perspective with the following stop-loss orders and initial target price levels:
- Gold: initial target price: $1,251; stop-loss: $1,382; initial target price for the DGLD ETN: $48.88; stop-loss for the DGLD ETN $37.48
- Silver: initial target price: $15.73; stop-loss: $18.06; initial target price for the DSLV ETN: $27.58; stop-loss for the DSLV ETN $19.17
- Mining stocks (price levels for the GDX ETF): initial target price: $21.03; stop-loss: $23.54; initial target price for the DUST ETF: $28.88; stop-loss for the DUST ETF $21.16
In case one wants to bet on junior mining stocks' prices (we do not suggest doing so – we think senior mining stocks are more predictable in the case of short-term trades – but if one wants to do it anyway, we provide the details), here are the stop-loss details and initial target prices:
- GDXJ ETF: initial target price: $30.62; stop-loss: $36.14
- JDST ETF: initial target price: $59.68 stop-loss: $40.86
Long-term capital (core part of the portfolio; our opinion): No positions (in other words: cash)
Insurance capital (core part of the portfolio; our opinion): Full position
Important Details for New Subscribers
Whether you already subscribed or not, we encourage you to find out how to make the most of our alerts and read our replies to the most common alert-and-gold-trading-related-questions.
Please note that the in the trading section we describe the situation for the day that the alert is posted. In other words, it we are writing about a speculative position, it means that it is up-to-date on the day it was posted. We are also featuring the initial target prices, so that you can decide whether keeping a position on a given day is something that is in tune with your approach (some moves are too small for medium-term traders and some might appear too big for day-traders).
Plus, you might want to read why our stop-loss orders are usually relatively far from the current price.
Please note that a full position doesn’t mean using all of the capital for a given trade. You will find details on our thoughts on gold portfolio structuring in the Key Insights section on our website.
As a reminder – “initial target price” means exactly that – an “initial” one, it’s not a price level at which we suggest closing positions. If this becomes the case (like it did in the previous trade) we will refer to these levels as levels of exit orders (exactly as we’ve done previously). Stop-loss levels, however, are naturally not “initial”, but something that, in our opinion, might be entered as an order.
Since it is impossible to synchronize target prices and stop-loss levels for all the ETFs and ETNs with the main markets that we provide these levels for (gold, silver and mining stocks – the GDX ETF), the stop-loss levels and target prices for other ETNs and ETF (among other: UGLD, DGLD, USLV, DSLV, NUGT, DUST, JNUG, JDST) are provided as supplementary, and not as “final”. This means that if a stop-loss or a target level is reached for any of the “additional instruments” (DGLD for instance), but not for the “main instrument” (gold in this case), we will view positions in both gold and DGLD as still open and the stop-loss for DGLD would have to be moved lower. On the other hand, if gold moves to a stop-loss level but DGLD doesn’t, then we will view both positions (in gold and DGLD) as closed. In other words, since it’s not possible to be 100% certain that each related instrument moves to a given level when the underlying instrument does, we can’t provide levels that would be binding. The levels that we do provide are our best estimate of the levels that will correspond to the levels in the underlying assets, but it will be the underlying assets that one will need to focus on regarding the signs pointing to closing a given position or keeping it open. We might adjust the levels in the “additional instruments” without adjusting the levels in the “main instruments”, which will simply mean that we have improved our estimation of these levels, not that we changed our outlook on the markets. We are already working on a tool that would update these levels on a daily basis for the most popular ETFs, ETNs and individual mining stocks.
Our preferred ways to invest in and to trade gold along with the reasoning can be found in the how to buy gold section. Additionally, our preferred ETFs and ETNs can be found in our Gold & Silver ETF Ranking.
As a reminder, Gold & Silver Trading Alerts are posted before or on each trading day (we usually post them before the opening bell, but we don't promise doing that each day). If there's anything urgent, we will send you an additional small alert before posting the main one.
=====
Latest Free Trading Alerts:
Gold dived below $1,300 last week, to many analysts’ surprise. They are panicking right now. But you do not have to. Let’s read our article and find out what is happening in the gold market!
Mayday, Mayday, Gold Is Sinking!
Friday's trading session was pretty uneventful, as investors continued to hesitate following early May move up. Is this over week-long consolidation a topping pattern or just some relatively flat correction before another leg up? Investors' sentiment improved following the U.S. - China trade talks, but there are still two possible medium-term scenarios.
=====
Hand-picked precious-metals-related links:
PRECIOUS-Gold prices slip as investors eye riskier assets
Hedge Funds Exit Gold Amid Strong Dollar and Lack of Fear
=====
In other news:
European shares eye four-month highs, Italy sell-off relents
When Will the ECB Pull Its Trillions From the Markets?
Corporate Bonds Sink Fast in One of Worst Tumbles Since 2000
Carney Pushes Back as BOE Debates Publishing Rate-Path Forecast
Cryptocurrencies have a mysterious allure – but are they just a fad?
=====
Thank you.
Sincerely,
Przemyslaw Radomski, CFA
Founder, Editor-in-chief, Gold & Silver Fund Manager
Gold & Silver Trading Alerts
Forex Trading Alerts
Oil Investment Updates
Oil Trading Alerts

