

Briefly: in our opinion, full (300% of the regular position size) speculative short positions in mining stocks are justified from the risk/reward point of view at the moment of publishing this Alert.
Since we posted this week’s flagship Gold & Silver Trading Alert yesterday, and since the markets were closed, there are not many price changes that I can discuss today. More precisely, I could discuss quite a few technical things, but they would not be particularly important, so it seems better for everyone that I focus on just two things that happened yesterday/today and then move to the more fundamental overview along with replies to two messages that I received. Also, if you haven’t read yesterday’s Gold & Silver Trading Analysis yet, I strongly encourage you to do so today.
Let’s start with the two things that you might be wondering about. The first is gold’s reversal and the second is the USD’s small decline.
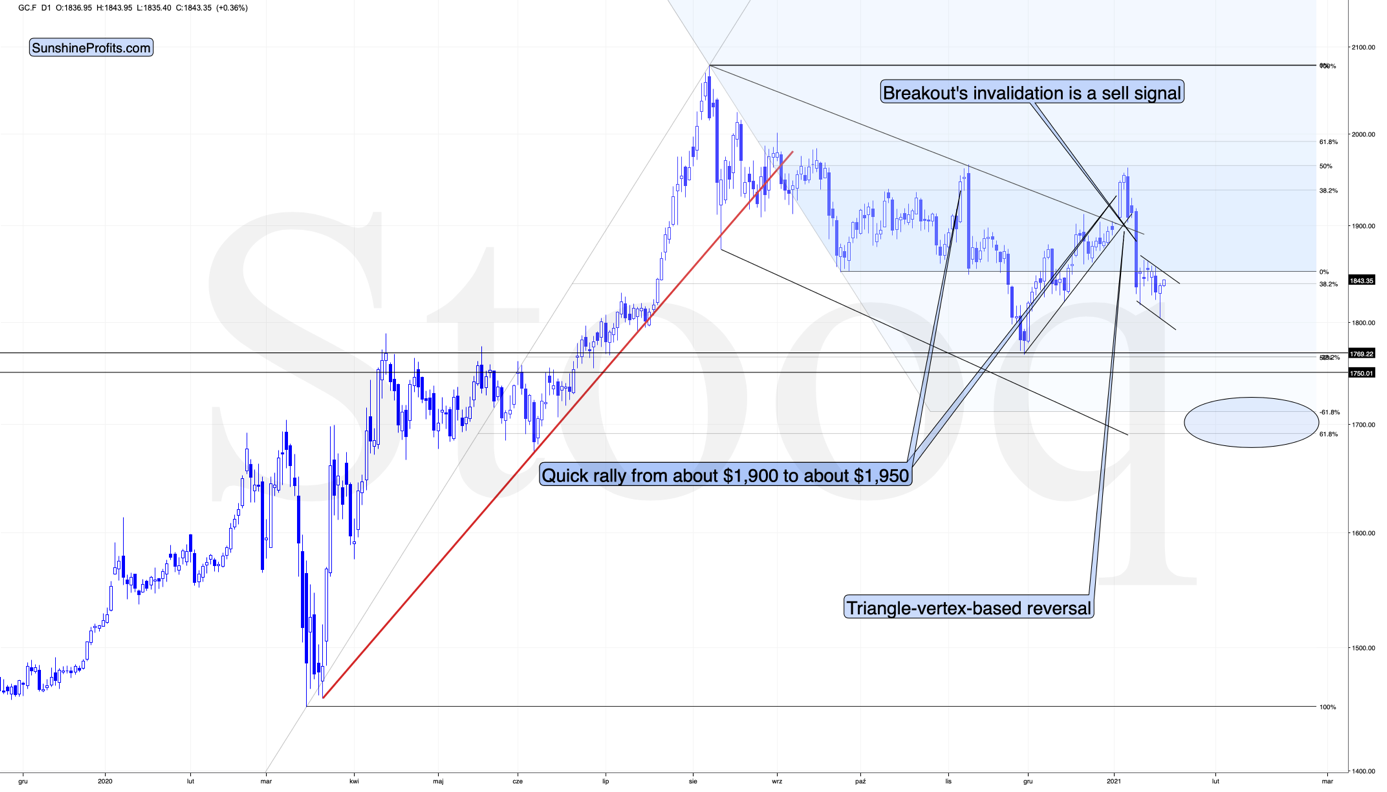
In short, yesterday’s reversal in gold is inconsequential, because it took place on a day when there was no trading in the U.S. Consequently, the data from this single session is not a reliable indication of anything. Besides, gold remains below its September 2020 lows and below its most recent short-term high. In fact, it’s even below the upper border of the small declining flag pattern.
And what about the USD’s small decline?
As you might have already guessed, it didn’t change anything either.
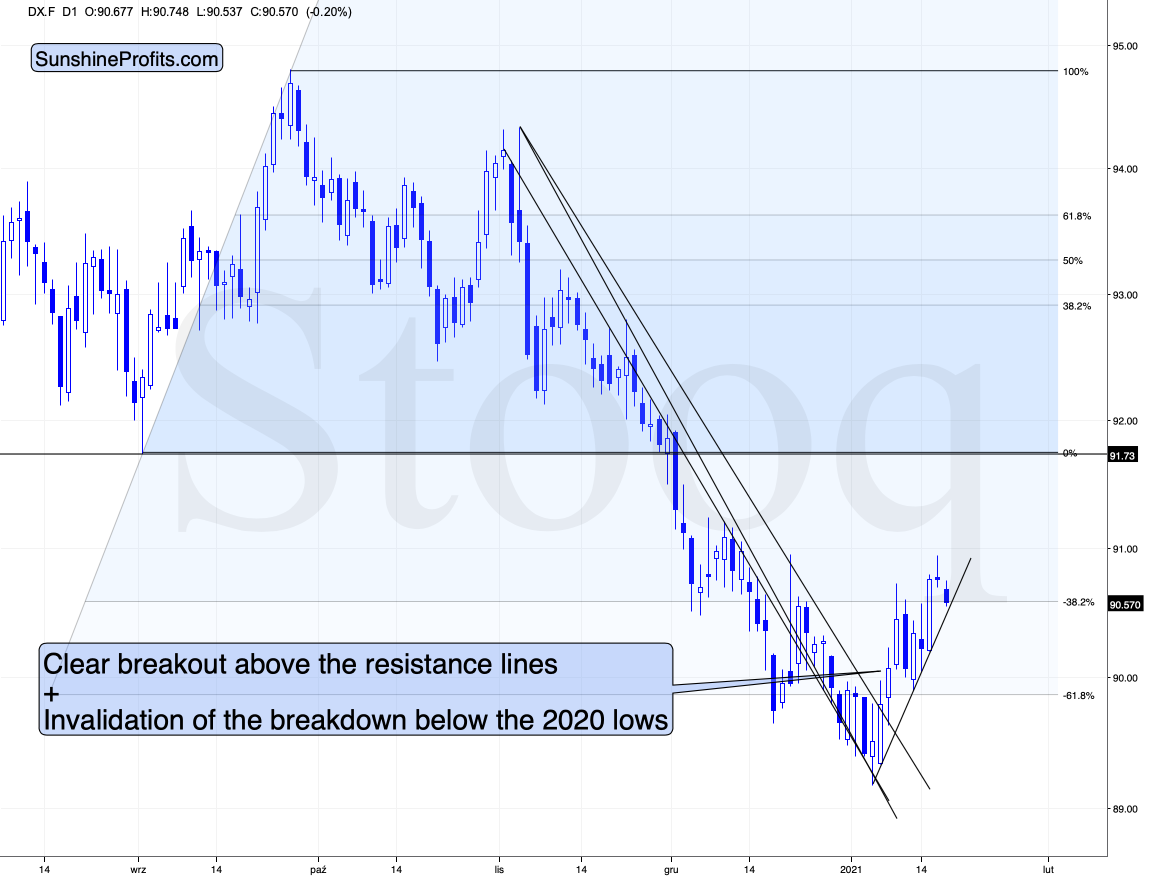
The USD Index is after a major breakout above the declining resistance lines and this breakout was confirmed. Consequently, the USD Index is likely to rally, but is it likely to rally shortly? The answer to this question is being clarified at the moment of writing these words, because the USD Index moved back to its rising short-term support line that’s based on the 2021 bottoms.
If the USD Index breaks below it, traders will view the 2021 rally as a zigzag corrective pattern and will probably sell the U.S. currency, causing it to decline, perhaps to the mid-January low or even triggering a re-test of the 2021 low.
If the USD Index performs well at this time and rallies back up after touching the support line, and then moves to new yearly highs, it will be then that traders realize that it was definitely not just a zigzag correction, but actually the major bottom. In the previous scenario, they would also realize that, but later, after an additional short-term decline.
The weak performance of mining stocks that we saw last week, and relatively strong performance of silver (up by 1.24%) compared to gold (up by 0.34%) in today’s pre-market trading suggest that PMs are very ready to slide right now. This – as markets are interconnected – might make the strength in the USD Index more likely than not. In this case, the second above-mentioned scenario would be realized, and the price moves that I’ve been describing for some time now, would gain momentum quickly.
In either case, it seems that the outlook for the precious metals market remains bearish for the short and medium-term. It is only the immediate and very short term that have any notable differences. Therefore, it seems to make sense to keep the short positions in the mining stocks intact.
Having said that, let’s discuss some non-technical issues.
Exhausting All Options
On Jan. 5, I warned that speculative call option buying could lead to a sharp reversal in U.S. equities (once the gambit unwinds).
I wrote:
In a nutshell, when investors buy call options, dealers hedge their exposure by purchasing the underlying asset (which causes the SPX to rise). As the dance continues, it manifests itself into a positive feedback loop where: speculators buy SPX call options … dealers hedge (by purchasing SPX ETF shares or using similar hedges) … the SPX rises … speculators buy more call options.
Rinse, repeat.
And while the merry-go-round can circle for some time, when the frenzy eventually reverses and dealers offload their hedges, a wave of selling hits the market.
For context, a similar event occurred in August and reached its climax from Sep.3 to Sep. 8. In just three trading days, the NASDAQ fell by 10%, the SPX fell by 7% and high-flyers like Tesla plunged by 26%.
And continuing their sprint towards the greatest Gamma squeeze of all-time, investors aren’t even stopping to tie their shoes.
Last week, small trader call option volume exceeded 9% of total NYSE (New York Stock Exchange) volume for the first time ever.
Please see below:
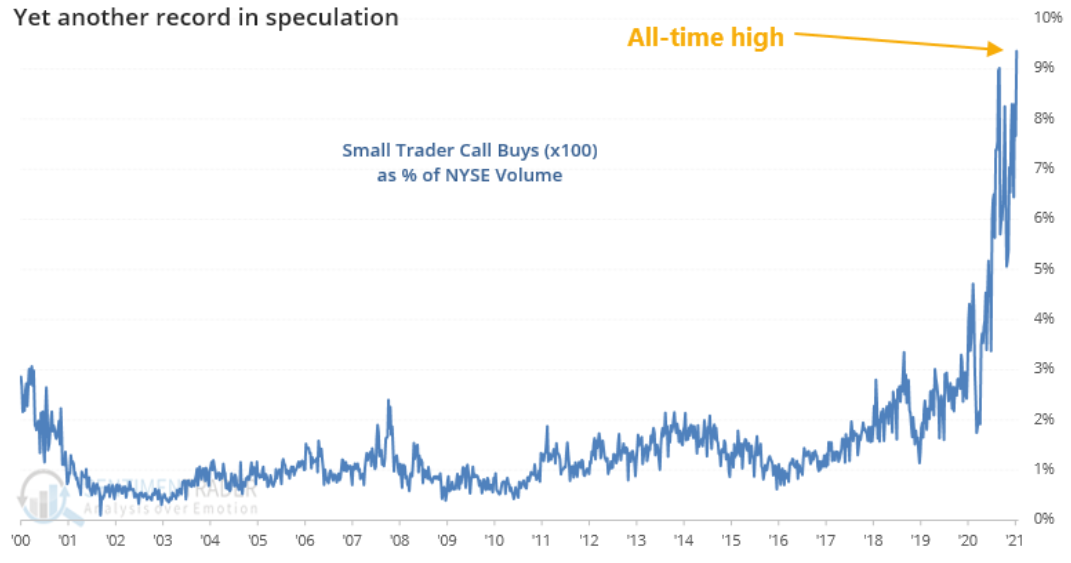 Source: Bloomberg/ SentimenTrader
For context, ‘small traders’ are investors that purchase 10 or less call option contracts (Remember, options sell in lots of 100, so small traders have exposure to 1,000 shares or less.)
Their behavior is important because small traders are a proxy for the most speculative cohort of the equity market. Unlike institutions that use options to hedge, small traders are retail participants that plow in at tops and bet on a perpetual rise in stocks prices (while also ignoring technical and fundamental history).
As further proof, more than 31 million call options exchanged hands on Jan. 14 – the second-highest daily total ever (with the all-time high of more than 35 million set on Nov. 24). Even more glaring, daily volume was more than 4.7x its historical average.
Please see below:
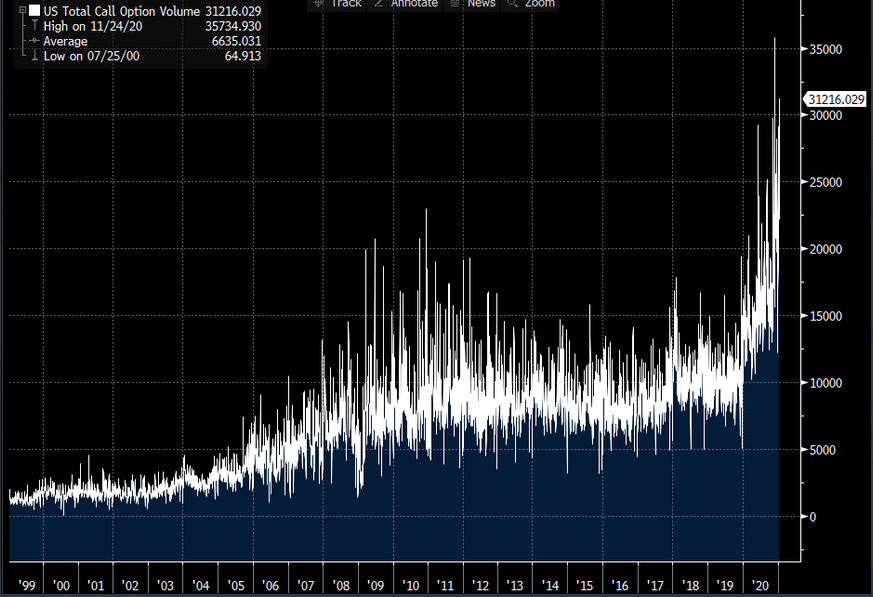 Source: Bloomberg/ Sarah Ponczek
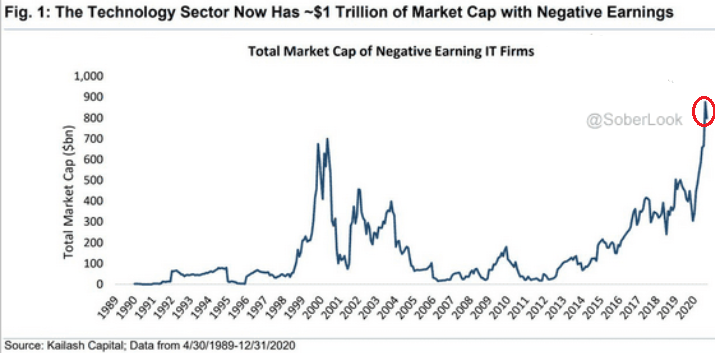
And leading the speculative charge, frantic call buying has occurred alongside unprofitable technology companies massively outperforming the NASDAQ 100 (as of the Jan. 13 close).
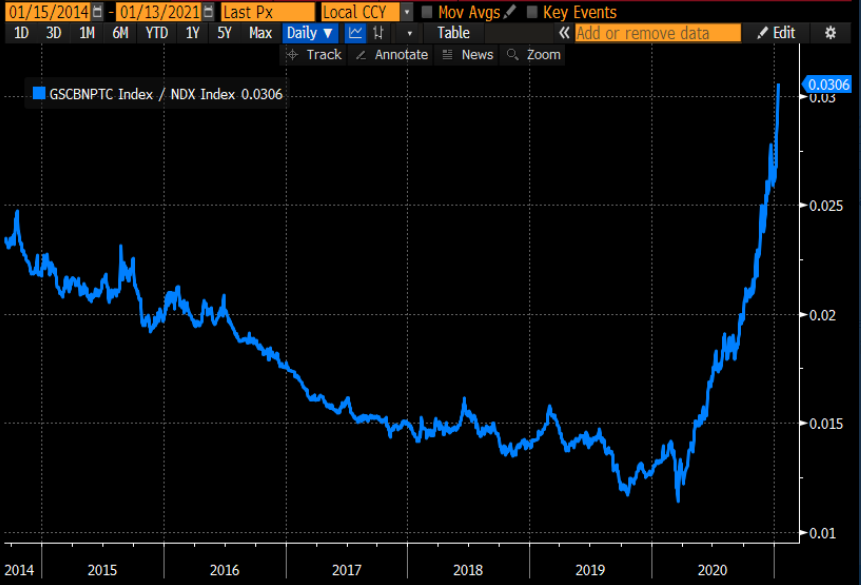 Source: Bloomberg/ Thunderdome Capital
To explain, the chart above depicts the ratio of Goldman Sachs’ non-profit tech index versus the NASDAQ 100 (NDX). When the blue line rises, it means that companies with negative earnings are outperforming the largest 100 companies in the NASDAQ (and vice versa). As a consequence of the vertical move higher in 2020, unprofitable technology companies ended the year with their highest combined market cap ever.
Furthermore, I warned yesterday (Jan. 18) that the bubble may be about to pop. With gold miners’ weakness acting as the canary in the coal mine, their 1999 top actually preceded the dot-com bust. And with today’s pattern eerily similar, we could be nearing another market meltdown.
I wrote:
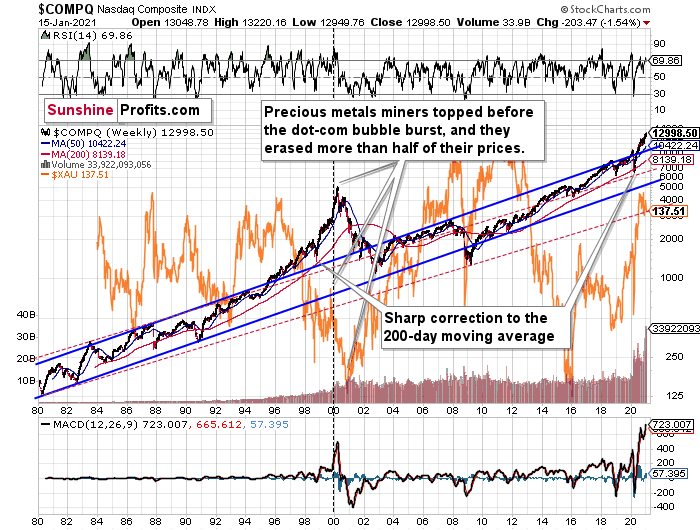
The two long-term channels above (the solid blue and red dashed lines), show that the NASDAQ is trading well above both historical trends.
Please note that the final part of the huge upswing materialized after the NASDAQ quickly declined to its 200-day moving average which was also slightly above the upper border of the rising trend channel marked with red dashed lines. We saw exactly the same thing in the first half of 2020.
The similarity between these two periods is also evident if one looks at the MACD indicator. There has been no other, even remotely similar, situation where this indicator would soar so high.
Furthermore, and because the devil is in the details, the gold miners’ 1999 top actually preceded the 2000 NASDAQ bubble bursting. It’s clear that miners (the XAU Index serves as a proxy) are on the left side of the dashed vertical line, while the tech stock top is on its right side. However, it’s important to note that it was stocks’ slide that exacerbated miners’ decline. Right now, the mining stocks are already declining, and the tech stocks continue to rally. Two decades ago, tech stocks topped about 6 months after miners. This might spoil the party of the tech stock bulls, but miners topped about 6 months ago…
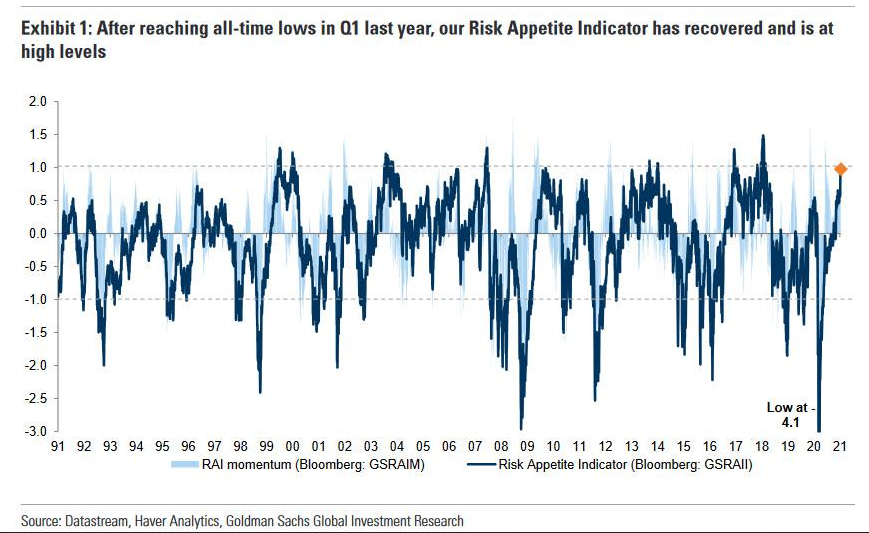
Also signaling excess, Goldman Sachs Risk Appetite Indicator (RAI) just hit its highest level (1.00) in four years. And while it’s still below record highs, Goldman strategist Christian Mueller-Glissman told clients that “from RAI levels close to 1 the asymmetry to add risk is worse: subsequent equity returns, especially in the near term, tend to be more negatively skewed and there is increased risk of drawdowns."
The bottom line?
Like I mentioned previously, if/when the equity bubble pops, the precious metals will be caught in the crossfire (As of Jan. 14, gold, silver and the gold miners have 250-day correlations of 0.64, 0.84 and 0.64 with the S&P 500.) Thus, given their preference to move in the same direction, an equity drawdown could accelerate the PMs’ slide in the coming weeks/months.
Then, at some point I expect PMs and miners to show strength despite rallying USD Index and declining stocks – just like what we saw in the first half of 2020 and in case of many other PM declines. And this would be THE bottom for the precious metals market.
Shorter Shorts
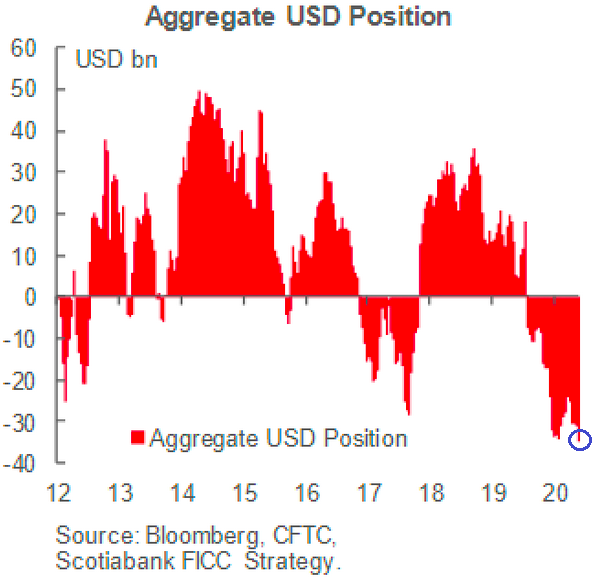
With 2006’s record now dead and gone, one of the largest potential short-squeezes just got a little larger.
Descending from the Great White North, the latest research from Scotiabank shows that speculative net-short positions (USD) just reached their highest level ever (the blue circle below).
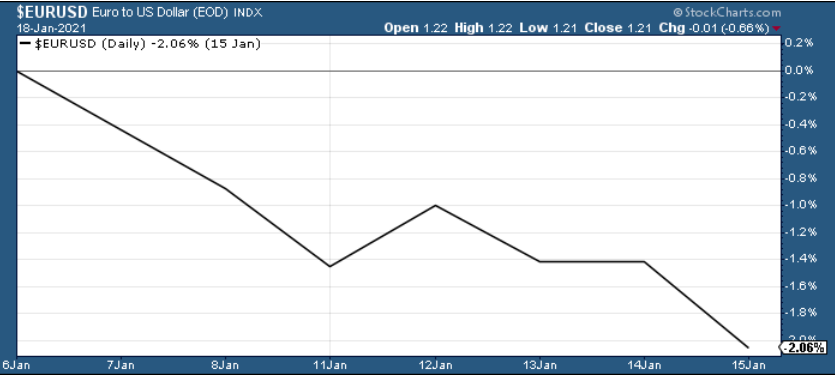
And with the euro still the apple of investors’ eye – despite the EUR/USD falling by more than 2% over the last eight trading days (the chart below) – proponents of a stronger euro are ignoring the Eurozone’s relative underperformance (Remember, currencies trade on a relative basis, so a less-bad U.S. economy is bullish for the U.S. dollar.)
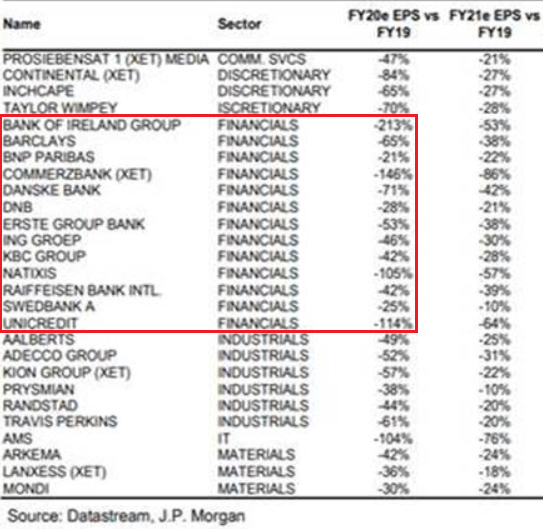
As further evidence, J.P. Morgan revealed that analysts expect fourth-quarter earnings to fall by an average of 10% year-over-year in the U.S. And given that valuations (and speculative activity) already exceed the dot-com bubble, the deterioration is problematic. However, on a relative basis, fourth-quarter earnings in Europe are expected to fall by a staggering 25%, which adds to a list of underperformances that already includes retail sales, inflation, interest rate differentials and central bank assets relative to GDP.
Moreover, amid the earnings destruction, Europe’s largest banks are expected to be among the hardest hit. And this matters, because financials are the most exposed to the real economy.
Please see below:
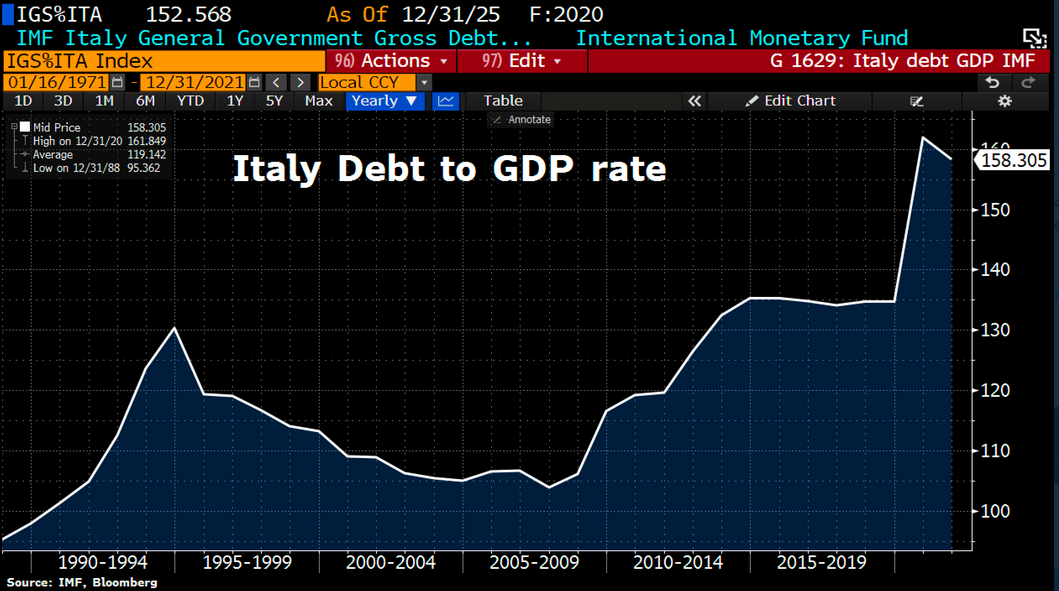
As another bearish development for the euro, the latest political malaise in Italy led the government to expand the country’s debt levels beyond the initial estimate. Government debt-to-GDP is expected to rise to a post-war record of 158.5% (well above the 149.4% reported in Q2:2020) after another €32 billion debt increase on Jan. 14. Even more ominous, Thursday’s request for a higher debt ceiling was the fifth upward revision since the pandemic hit in March (For context, the chart below depicts the forecast as of the end of 2020; thus, it doesn’t include Thursday’s raise.)
The key takeaway?
The EUR/USD remains in la-la land, but the walls are closing in. And because the currency pair accounts for nearly 58% of the movement in the USD Index, a meaningful decline should propel the USDX higher. More importantly though, given the USDX’s strong negative correlation with the PMs, a resurgent U.S. dollar means the metals are likely to incur further short-term weakness.
Letters to the Editor
Q: Dear Mr Przemyslaw Radomski,
I 'm one of your customers. I would like to ask you for advice. Before that I would like to congratulate you for the wonderful job you are doing. Thank you for that.
Well, I would like your opinion on whether it is a good idea to get a fixed rate mortgage for 15 years in order to buy a house in the Greater Toronto area in Ontario, Canada.
Thank you very much.
A: Thank you for your kind words - I appreciate them a lot.
Your question is actually about two issues that are connected: one is whether to get a fixed mortgage rate, and the second is whether to buy a house (as opposed to renting, assuming that you need to be able to live in it or use it in some other way).
As always, I’ll be 100% honest and I have to start by stating that I’m no specialist in either of these markets (debt, real estate) and that I can’t provide investment advice. Consequently, I would suggest that you consult this with an investment advisor, but my opinion on both markets is this:
The interest rates are ridiculously low around the world, and this situation might not persist for the next decade or more. In fact, I don’t see it as likely.
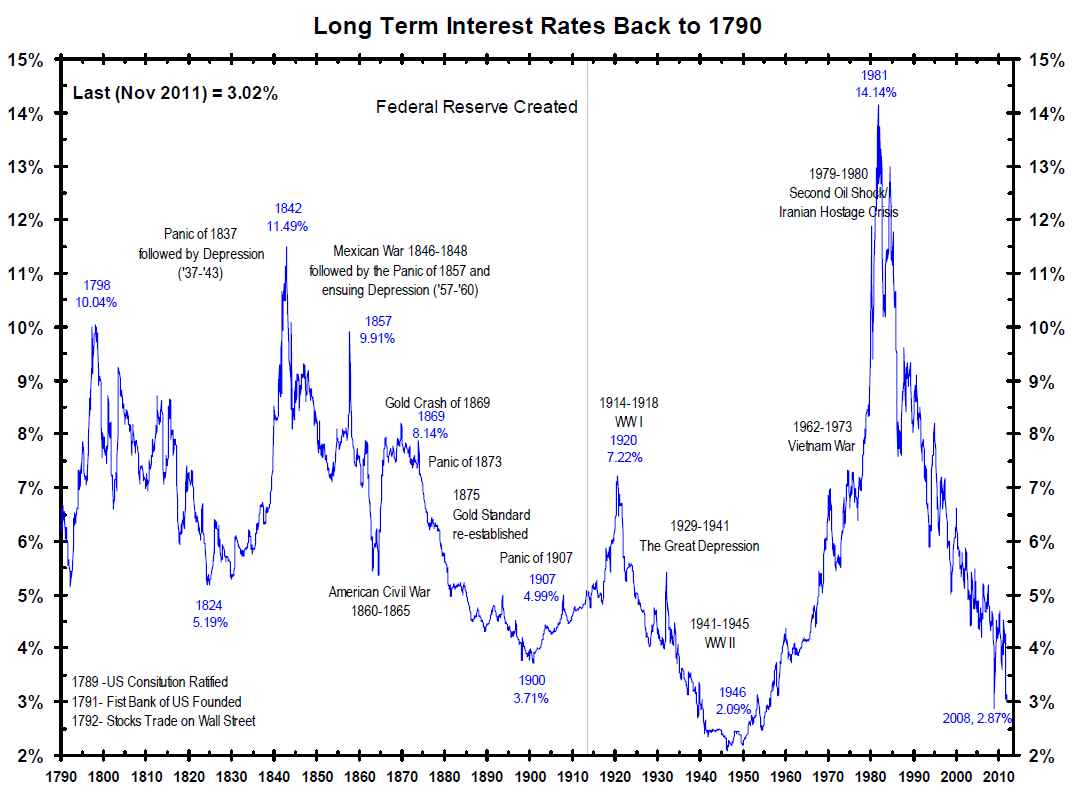
Source: What Drives The Bond Market?, Chicago CFA Handout by Bianco Research LLC, January 18, 2011
I like the very, very long-term charts, because they allow one to see patterns that are otherwise not visible. People often say that things will not repeat themselves, because the world is constantly changing. If there’s peace, they will say that there can be war and change everything. If there’s war, or at least a threat thereof, they will stay that things are going to change when we’ll have peace. If one political party is winning, then they say that everything will change when someone else is winning. And so on and so forth. But over the very, very long term, practically everything has already happened in one way or another. The above chart even covers the world when Ching Shih, rose from being a prostitute to being the pirate leader who commanded over 1800 ships that fought the British Empire, the Portuguese Empire, and the Qing dynasty (interestingly, despite this “extreme” career, she died peacefully, in bed, surrounded by her family).
And the clear tendency for the long-term interest rates to soar and plunge in very long trends still remained intact!
The world is changing… Bah.
The reason that I’m writing all this is to explain why I think that the long-term interest rates are much more likely to rise than fall in the following decade or so.
Consequently, as far as a fixed vs. floating rate is concerned, in my opinion the “fixed” is a better option.
As for the buying / renting issue is concerned, and whether to do it right now, I’d say that the reply would be better provided by yourself. And I don’t mean to be lazy in not providing an answer. What I mean is that the psychological benefit of house “ownership” could be very important. I haven’t experienced this effect myself, but it applies to most people – they feel safer in general, if they “own” the house that they reside in. If this was an important factor for me, I’d likely go for it.
If this factor is not an issue, as you’re thinking about buying a home and then making money from providing it to others (lease, rent etc.), then it’s different. In this case, I’d consider what kind of property this is.
If the stock market is going to slide, this will cause a landslide of problems in other markets as well – people will lose jobs, perhaps their houses, and the prices of the latter would likely fall in general in this case. The key word here is “general”. The thing is that during crises, the concentration of wealth increases substantially, and the particularly highly priced (a.k.a. luxurious) assets and items tend to become even more expensive. Penthouses in great neighborhoods, art, luxurious cars and so on. All these things would likely gain in value during a crisis. However, the “average” or “low-end” assets or items would likely decline in value.
Now, I wouldn’t want to own something that declines in value. I’d prefer to pay someone for using it and if I liked it, I’d buy it after it already declines in price, thus effectively saving more on the purchase than I would have paid by that time for the privilege of using it.
So, with regard to real estate, things are not so simple, and it all “depends” – which is why I’m not able to provide a clearer reply. I hope you’ll find the above useful.
Q: Dear PR,
Sending you the best as the Precious Metals sector works through its projected decline.
I thought today’s newsletter (Jan 18) was exceptionally clear. Your discussion of the Euro, Interest Rates, Dollar Short Positions, GDXJ patterns, etc., all sunk in more this time, even though I know that you have been discussing these topics all along. You show how it all hangs together and makes for a very probable outcome. That you can do this in advance is wonderful! There are so many parts that you are bringing in and knitting together. You present a very comprehensive and compelling precious metals commentary. I really like your graphs. They say it all! Well done!
Stay well!
A: Thank you very much, I’m very happy to read these messages!
The above doesn’t include a question, but I included it to emphasize one important thing.
I want to warn everyone against getting so confident in my ideas and suggestions that you forget about position size management. Yes, all that I’ve described today, yesterday, and in the previous days fits very well, but there can be things that I actually didn’t notice (despite dedicating a lot of energy to it, it’s impossible for any single person to see everything, even if they all care about the analysis as much as I do). Or something may happen that’s completely random. It used to be the case that a single tweet could move the market and there was no way to predict the short-term price movement in this environment. Or there could be an extra several-week-long period of waiting before the above-mentioned moves materialize, simply because of some political plays. Or perhaps a local attempt to manipulate the market could really trigger some countertrend moves. In order to make money in the long run, one needs to be sure that they continue to have lots of capital even if a single trade (or a few trades in a row) go in the wrong direction. In general, there’s a max 2% loss rule per trade, and I’m already beyond that in what I wrote (300% position size implies the 6% max loss). It’s already a very large position, so please keep in mind not to overdo it. It’s much better to have a position that’s too small than one that’s too big. In the end the latter will catch up to everyone sooner or later. You will find more details in the “Positions Sizes” section of my gold portfolio report.
Overview of the Upcoming Decline
- As far as the current overview of the upcoming decline is concerned, I think it has already begun.
- During the final part of the slide (which could end within the next 1-12 weeks or so), I expect silver to decline more than miners. That would align with how the markets initially reacted to the COVID-19 threat.
- The impact of all the new rounds of money printing in the U.S. and Europe on the precious metals prices is incredibly positive in the long run, which does not make the short-term decline improbable. Markets can and will get ahead of themselves and decline afterward – sometimes very profoundly – before continuing with their upward climb.
- The plan is to exit the current short positions in miners after they decline far and fast, but at the same time, silver drops just “significantly” (we expect this to happen in 1 – 5 weeks ). In other words, the decline in silver should be severe, but the decline in the miners should look “ridiculous”. That’s what we did in March when we bought practically right at the bottom . It is a soft, but simultaneously broad instruction, so additional confirmations are necessary.
- As a point of reference, given that the inverse pattern above mirrors today’s price action, the duration of the precious metals’ decline could last longer than my initial forecast. Keep in mind though, a prolonged bear market is not my base case; I’m merely indicating that the possibility exists.
- In absence, I expect a bottom to form with gold falling to roughly $1,700 - $1,750 . If – at the same time – gold moves to about $1,700 - $1,750 and miners are already after a ridiculously big drop (say, to $31 - $32 in the GDX ETF – or lower), we will probably exit the short positions in the miners and at the same time enter short positions in silver. However, it could also be the case that we’ll wait for a rebound before re-entering short position in silver – it’s too early to say at this time. It’s also possible that we’ll enter very quick long positions between those short positions.
- The precious metals market's final bottom is likely to take shape when gold shows significant strength relative to the USD Index . It could take the form of a gold’s rally or a bullish reversal, despite the ongoing USD Index rally.
Summary
Summing up, the outlook for gold and the rest of the precious metals market is bearish for at least the next few weeks. After topping at its triangle-vertex-based reversal, gold moved sharply lower and it just invalidated the breakout above its declining resistance line, while breaking below the rising support line. All this happened as the USD Index rallied visibly above its declining resistance lines and invalidated the breakdown below the 2020 lows. This creates a strongly bearish combination for the precious metals market.
The USD Index and cryptocurrencies suggest that we’re seeing the repeat of early 2018, when the USD Index bottomed. Given the current correlations between PMs and the USD Index, the rally in the USDX is likely to have very bearish implications for the precious metals market.
Despite a recent decline, it seems that the USD Index is going to move higher in the following months and weeks, in turn causing gold to decline. At some point gold is likely to stop responding to dollar’s bearish indications, and based on the above analysis, it seems that this is already taking place.
Naturally, everyone's trading is their responsibility. But in our opinion, if there ever was a time to either enter a short position in the miners or increase its size if it was not already sizable, it's now. We made money on the March decline, and on the March rebound, with another massive slide already underway.
After the sell-off (that takes gold to about $1,500), we expect the precious metals to rally significantly. The final part of the decline might take as little as 1-5 weeks, so it's important to stay alert to any changes.
Most importantly, please stay healthy and safe. We made a lot of money on the March decline and the subsequent rebound (its initial part) price moves (and we'll likely earn much more in the following weeks and months), but you have to be healthy to enjoy the results.
As always, we'll keep you - our subscribers - informed.
To summarize:
Trading capital (supplementary part of the portfolio; our opinion): Full speculative short positions (300% of the full position) in mining stocks is justified from the risk to reward point of view with the following binding exit profit-take price levels:
Senior mining stocks (price levels for the GDX ETF): binding profit-take exit price: $32.02; stop-loss: none (the volatility is too big to justify a SL order in case of this particular trade); binding profit-take level for the DUST ETF: $28.73; stop-loss for the DUST ETF: none (the volatility is too big to justify a SL order in case of this particular trade)
Junior mining stocks (price levels for the GDXJ ETF): binding profit-take exit price: $42.72; stop-loss: none (the volatility is too big to justify a SL order in case of this particular trade); binding profit-take level for the JDST ETF: $21.22; stop-loss for the JDST ETF: none (the volatility is too big to justify a SL order in case of this particular trade)
For-your-information targets (our opinion; we continue to think that mining stocks are the preferred way of taking advantage of the upcoming price move, but if for whatever reason one wants / has to use silver or gold for this trade, we are providing the details anyway. In our view, silver has greater potential than gold does):
Silver futures downside profit-take exit price: unclear at this time - initially, it might be a good idea to exit, when gold moves to $1,703.
Gold futures downside profit-take exit price: $1,703
Long-term capital (core part of the portfolio; our opinion): No positions (in other words: cash
Insurance capital (core part of the portfolio; our opinion): Full position
Whether you already subscribed or not, we encourage you to find out how to make the most of our alerts and read our replies to the most common alert-and-gold-trading-related-questions.
Please note that we describe the situation for the day that the alert is posted in the trading section. In other words, if we are writing about a speculative position, it means that it is up-to-date on the day it was posted. We are also featuring the initial target prices to decide whether keeping a position on a given day is in tune with your approach (some moves are too small for medium-term traders, and some might appear too big for day-traders).
Additionally, you might want to read why our stop-loss orders are usually relatively far from the current price.
Please note that a full position doesn't mean using all of the capital for a given trade. You will find details on our thoughts on gold portfolio structuring in the Key Insights section on our website.
As a reminder - "initial target price" means exactly that - an "initial" one. It's not a price level at which we suggest closing positions. If this becomes the case (like it did in the previous trade), we will refer to these levels as levels of exit orders (exactly as we've done previously). Stop-loss levels, however, are naturally not "initial", but something that, in our opinion, might be entered as an order.
Since it is impossible to synchronize target prices and stop-loss levels for all the ETFs and ETNs with the main markets that we provide these levels for (gold, silver and mining stocks - the GDX ETF), the stop-loss levels and target prices for other ETNs and ETF (among other: UGL, GLL, AGQ, ZSL, NUGT, DUST, JNUG, JDST) are provided as supplementary, and not as "final". This means that if a stop-loss or a target level is reached for any of the "additional instruments" (GLL for instance), but not for the "main instrument" (gold in this case), we will view positions in both gold and GLL as still open and the stop-loss for GLL would have to be moved lower. On the other hand, if gold moves to a stop-loss level but GLL doesn't, then we will view both positions (in gold and GLL) as closed. In other words, since it's not possible to be 100% certain that each related instrument moves to a given level when the underlying instrument does, we can't provide levels that would be binding. The levels that we do provide are our best estimate of the levels that will correspond to the levels in the underlying assets, but it will be the underlying assets that one will need to focus on regarding the signs pointing to closing a given position or keeping it open. We might adjust the levels in the "additional instruments" without adjusting the levels in the "main instruments", which will simply mean that we have improved our estimation of these levels, not that we changed our outlook on the markets. We are already working on a tool that would update these levels daily for the most popular ETFs, ETNs and individual mining stocks.
Our preferred ways to invest in and to trade gold along with the reasoning can be found in the how to buy gold section. Furthermore, our preferred ETFs and ETNs can be found in our Gold & Silver ETF Ranking.
As a reminder, Gold & Silver Trading Alerts are posted before or on each trading day (we usually post them before the opening bell, but we don't promise doing that each day). If there's anything urgent, we will send you an additional small alert before posting the main one.
Thank you.
Przemyslaw Radomski, CFA
Founder, Editor-in-chief

