

Briefly: in our opinion, full (300% of the regular position size) speculative short positions in junior mining stocks are justified from the risk/reward point of view at the moment of publishing this Alert.
Quite a lot happened yesterday on the markets, but did as much change? Let’s start today’s discussion with an examination of the fundamentals.
No Pivot
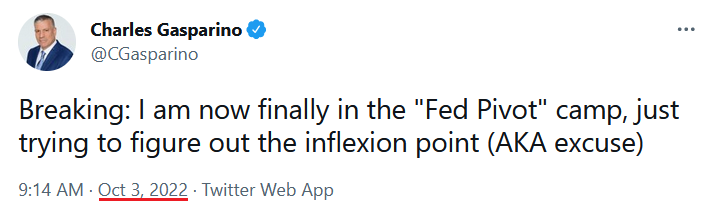
With short squeezes abound on Oct. 3, gold, silver, mining stocks and the S&P 500 rose sharply. However, while oversold conditions and one-sided positioning can lead to violent short-covering rallies, the ‘here we go again’ narrative is destined to fail.
To explain, after the Bank of England (BoE) resumed QE to help offset a liquidity crunch in the U.K. bond market, the post-GFC crowd hoped the Fed would be next. Then, with Credit Suisse’s credit default swap (CDS) rate soaring in recent days, rumors of insolvency poured gasoline on the pivot fire. In a nutshell: “if things blow up, the Fed will turn dovish”.
However, while market participants like to turn whispers into shouts, the new narrative contrasts fundamental reality. One, Sarah Cha, Financial Sector Specialist at Goldman Sachs, noted how colleague Jonathan Weetman described the Credit Suisse drama as “unwarranted.” She wrote:
“CS off 7% following online/social media speculation and multiple press articles over the weekend around what appears to be a risk-off market fueled negative feedback loop around capital position. Weetman calls the weakness in the stock unwarranted and walks through some of the considerations in his note this morning which includes:
- The liquid balance sheet
- No Equities Prime business
- Levered loans a very well covered bear point but that the composition & timing of a potential recap (he thinks consensus forming around CHF 4-5b) alongside IB restructuring the key question from investors.”
Thus, while one cannot be sure of Credit Suisse's financial health, Goldman Sachs has little incentive to support the bank. In fact, amplifying the panic, then purchasing the stock and waiting for a reversal would be more profitable for Goldman Sachs. Therefore, the rumors are likely more semblance than substance.
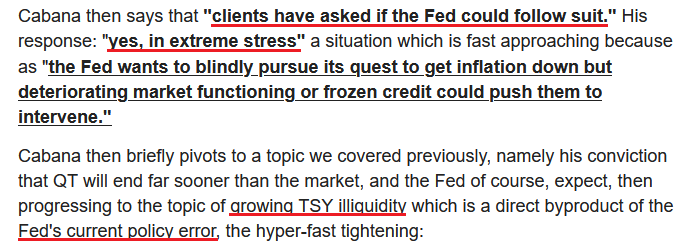
In addition, with the Fed holding an emergency meeting on Oct. 3, speculation has arisen that the central bank may attempt to lower U.S. Treasury yields and weaken the USD Index. For example, Mark Cabana, Head of U.S. Rates Strategy at Bank of America, compared the BoE to the Fed on Oct. 3. He wrote:
 Source: ZeroHedge
Yet, with tales of Treasury market illiquidity resurfacing – which could force the Fed to intervene to avoid a crash in bond prices – it’s important not to assign credibility to individuals that constantly sound the same alarm. Remember, it’s like The Boy Who Cried Wolf. They recycle the same warning, while the wolf only arrives 1% of the time.
Please see below:
 Source: Axios
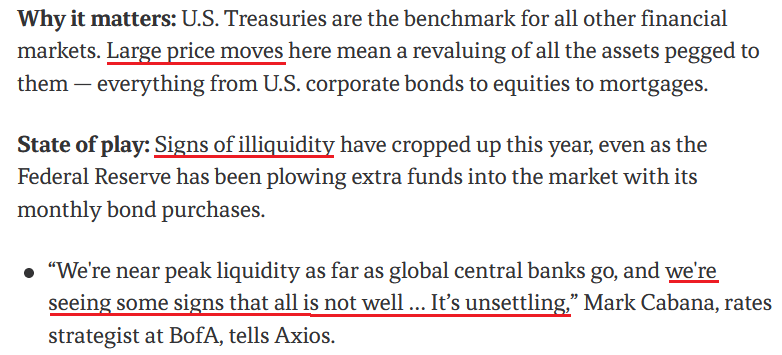
To explain, the screenshot above is from an article written on Nov. 17, 2021. Here is the link if you want to read it: https://www.axios.com/2021/11/17/treasury-market-stress-signs-regulators
As you can see, Cabana said the same thing nearly a year ago. Moreover, the U.S. 10-Year Treasury yield ended the Nov. 17, 2021 session at 1.59%, while the GDXJ ETF closed at $47.38. So, if you had positioned for Cabana's warning back then, you would have lost a lot of money buying the U.S. 10-Year Treasury Note and the junior miners' index.
As a result, more important than the information you're digesting is where the information comes from. Many 'analysts' lack objectivity and don't disclose how wrong they've been. Therefore, while Cabana awaits the Treasury market's implosion, his warning hasn't made his clients any money over the last ~11 months.
Conversely, all we (subscribers to Gold & Silver Trading Alerts) had this year were profitable transactions: both long and short.
Likewise, while we've had several GDXJ ETF short squeezes and pivot prognostications in 2022, the junior miners have continued to hit new lows. Thus, we view the current move as a countertrend rally within a medium-term downswing. In contrast, uninformed assessments of the fundamentals highlight why narratives seem so powerful in the short term.
Please see below:
To explain, extremely impressionable investors flock to narratives like a snowball rolling down a hill. The more ground it covers, the larger it becomes. However, if you bought the GDXJ ETF every time one of these false narratives emerged, your portfolio would have suffered substantial losses.
Remember, none of these supposed pivot-worthy issues solve inflation. In reality, the recent deceleration in month-over-month (MoM) inflation has occurred because the Fed maintained a hawkish stance. If that reverses, the small amount of realized progress will evaporate, and the Fed will confront the same problem again.
Follow the Data
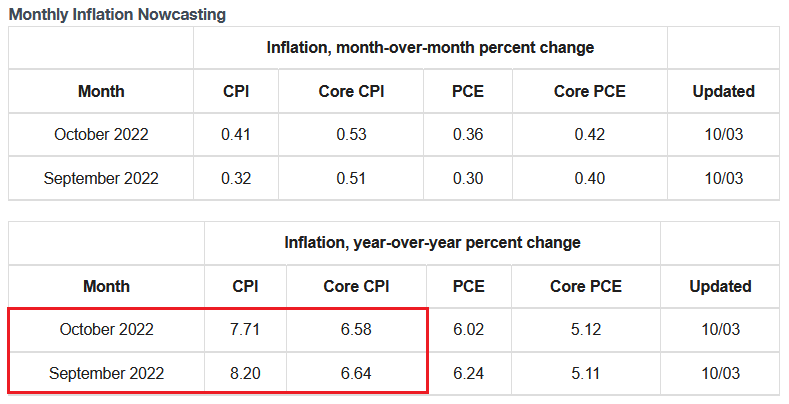
The Cleveland Fed projects that the headline and core Consumer Price Indexes (CPI) will hit 8.20% and 6.64% year-over-year (YoY) in September and 7.71% and 6.58% YoY in October; and while lower commodity prices help slow the headline CPI, resilient consumer demand should keep the core CPI uplifted.
Please see below:
 Source: Cleveland Fed
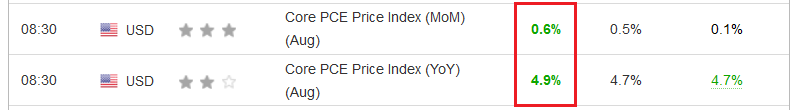
In addition, it was only one day ago that the core Personal Consumption Expenditures (PCE) Index re-accelerated YoY and outperformed expectations. For context, I wrote on Oct. 3:
With the core PCE Index – the Fed’s preferred inflation gauge – outperforming expectations on Sep. 30, inflation is nowhere near the levels that support a dovish pivot.
Please see below:
 Source: Investing.com
To explain, the core PCE Index came in at 4.9% year-over-year (YoY), which exceeded economists' consensus estimate of 4.7% YoY. Also, August's print exceeded the 4.7% YoY realized in July. As such, inflation remains highly problematic.
On top of that, the Atlanta Fed’s third-quarter real GDP estimate (updated on Oct. 3) stands at 2.3%, which is near the highs set in August.
Please see below:
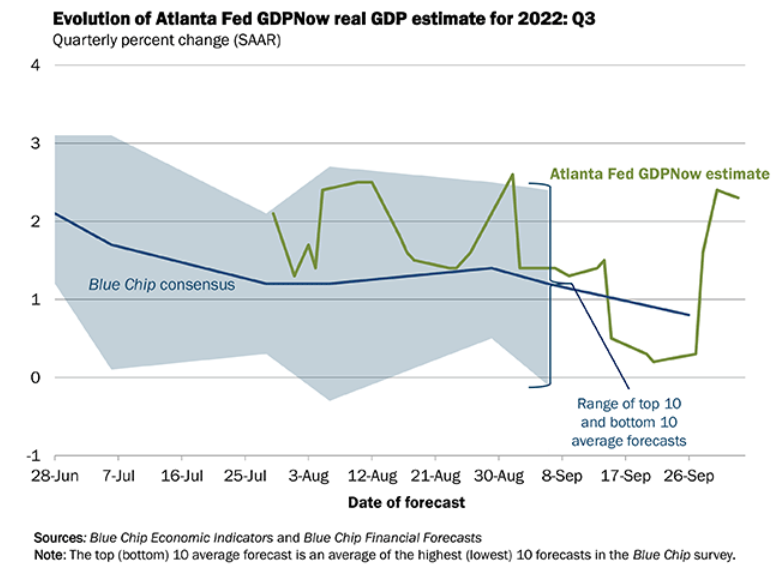
To explain, the green line above tracks the Atlanta Fed’s Q3 real GDP estimate, while the blue line above tracks the Blue Chip consensus estimate (investment banks). If you analyze the sharp rise in the green line on the right side of the chart, you can see that expected economic growth is far from crisis levels. Therefore, the data does not support a dovish pivot.
As further evidence, S&P Global released its U.S. Manufacturing PMI on Oct. 3. The headline index increased from 51.5 in August to 52.0 in September. The report revealed:
“On the price front, input costs rose at a slower pace in September. The rate of inflation was still historically elevated.”
In addition:
“Manufacturers registered a softer increase in selling prices compared to earlier in the year. That said, the pace of charge inflation ticked up from August as firms sought to pass through higher cost burdens to clients.”
So while inflation has slowed (which it should after 12 25 basis point rate hikes in 2022), U.S. manufacturers increased their selling prices at a faster pace in September versus August. As such, the pivot crowd is buying hope and selling reality.
More importantly:
 Source: S&P Global
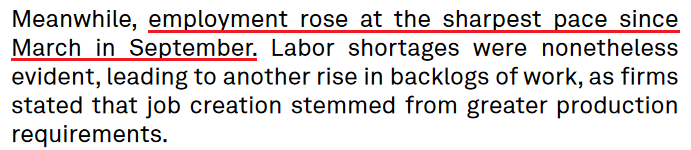
With employment (one-half of the Fed’s dual mandate) going strong, the U.S. labor market remains on solid footing. Moreover, with increased hiring poised to uplift wages, the inflationary headwind will only be exacerbated if the Fed turns dovish.
Furthermore, with real GDP growth relatively strong (if the Atlanta Fed’s projection holds) and realized inflation still outperforming, the three metrics signal a higher, not lower, U.S. federal funds rate (FFR). Thus, the post-GFC crowd is repeating the same mistakes they made throughout 2021 and 2022.
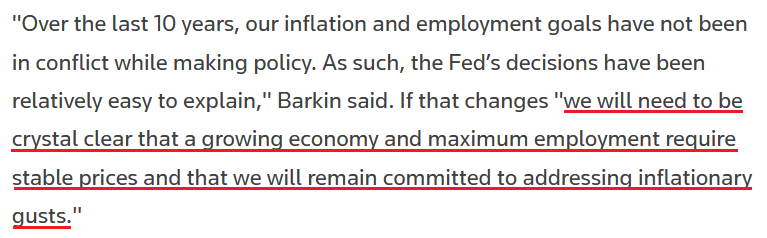
Finally, Richmond Fed President Thomas Barkin said on Oct. 3 that inflation uncertainties “could make looking through short-term shocks more difficult. They could make gradual rate increase paths less effective. They could make market functioning interventions somewhat trickier.”
He added:
“Our efforts to stabilize inflation expectations could require periods where we tighten monetary policy more than has been our recent pattern.”
As a result, Barkin is the latest Fed official to reiterate that inflation is the top priority; and he understands that without “stable prices,” employment and growth are living on borrowed time.
 Source: Reuters
The Bottom Line
While it’s hard to count how many times investors have predicted a dovish pivot in 2022, each iteration has been incorrect. Moreover, with realized inflation, projected real GDP growth, and the U.S. labor market still resilient, investors are in la-la land if they think these metrics support a dovish 180.
Likewise, the alarmists citing Treasury illiquidity, market functioning, and financial stability as reasons for a pivot tell the same stories over and over. Therefore, while the Fed will pivot at some point, timing matters, and their timing has been way off. As such, it’s important not to overthink short-term moves: assets become oversold, narratives create doubt, and short-covering sparks decent rallies. However, those gains are unlikely to hold since the medium-term technicals and fundamentals don’t support the moves.
What are the voters concerned about the most at this time?
Inflation.
Period.
In conclusion, the PMs rallied on Oct. 3, as hope uplifted risk assets. Also, the USD Index and U.S. real yields declined, which often occurs when risk-on sentiment dominates. Despite that, the optimism should evaporate in the months ahead, as all of the GDXJ ETFs 2022 rallies have failed, and this one should be no different.
Technically Speaking
The GDXJ rallied by over 5% yesterday, which might trigger some concerns.
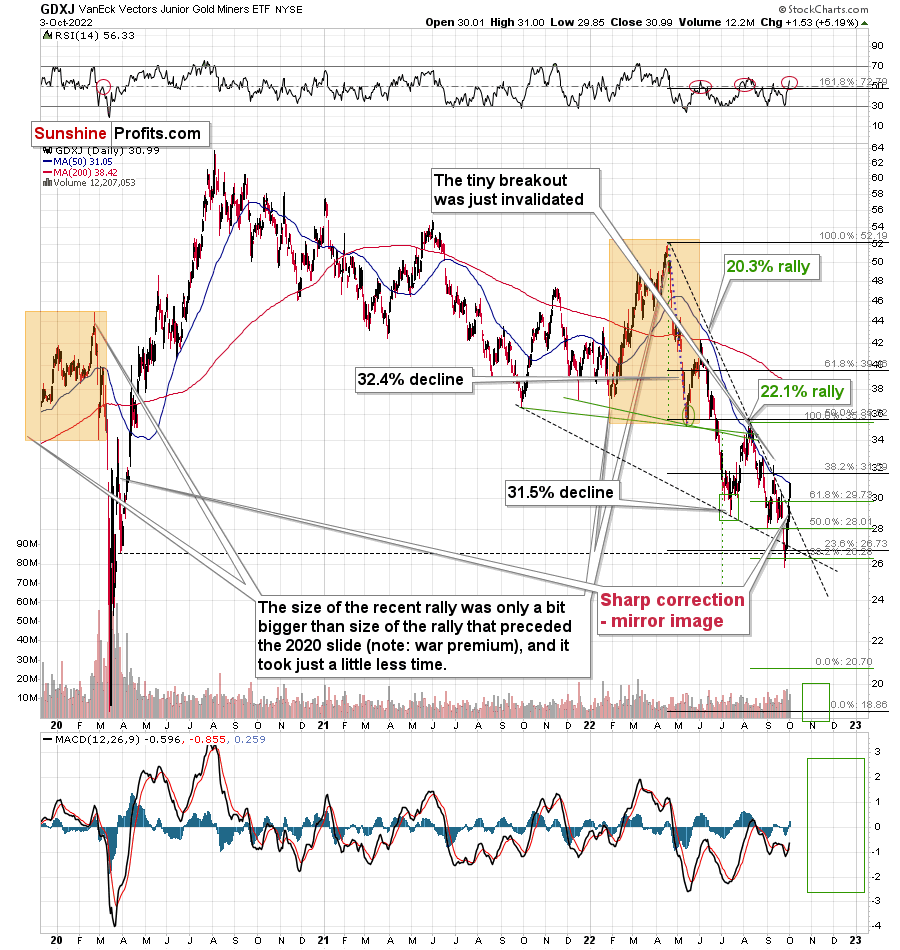
In reality, however, this is more of what we’ve already seen in the previous weeks.
That’s the fourth attempt of the GDXJ to break above its 50-day moving average (marked in blue). All previous cases failed, and in all previous cases the rally taking prices to this MA were sharp.
Is this time different? That’s unlikely, as the fundamentals (as explained earlier today) haven’t changed.
Additionally, please note that the RSI just jumped above 50, and ever since the April 2022 top, these levels in the RSI meant that local tops were in. I marked that with red ellipses in the upper part of the chart.
There’s also one additional factor explaining why this counter-trend bounce might be so volatile – that’s because the mirror image of this decline – the 2020 rally – also features a sharp correction around those price levels.
This time, the correction doesn’t have to be as big as the move that led to it was not as sharp.
Now, as you may recall, I previously had a downside target of about $26, but I ended up resigning from it. I continue to think that this decision was justified from the risk to reward point of view (given the data that we had available at that time), as there were previously corrective upswings, and it was not a no-brainer that we’re going to see a rebound also one more time.
However, as geopolitics came into play this time, the counter-trend rally has indeed materialized. Since it doesn’t make much sense to try to predict those near-term geopolitical events – the world is too unpredictable, it’s better to focus on the part of the picture where we can actually gain an extra edge over other market participants. That is recognizing trends and tendencies. Once the very short-term dust settles, the markets are likely to get back to their previous trends and surprise those who assume that short-term geopolitical events have a lasting impact on the markets. They don’t. If that was the case, gold would be above $2,000 at this time, as that’ where it soared based on the Russian invasion. Well, the war didn’t end, and yet gold is at about $1,700.
From the long-term point of view, it’s clear that the “rally” that we saw recently is just a temporary rebound that follows a breakdown below an important long-term support line. Thus, it’s likely nothing more than a temporary verification of the breakdown that doesn’t change the downtrend.
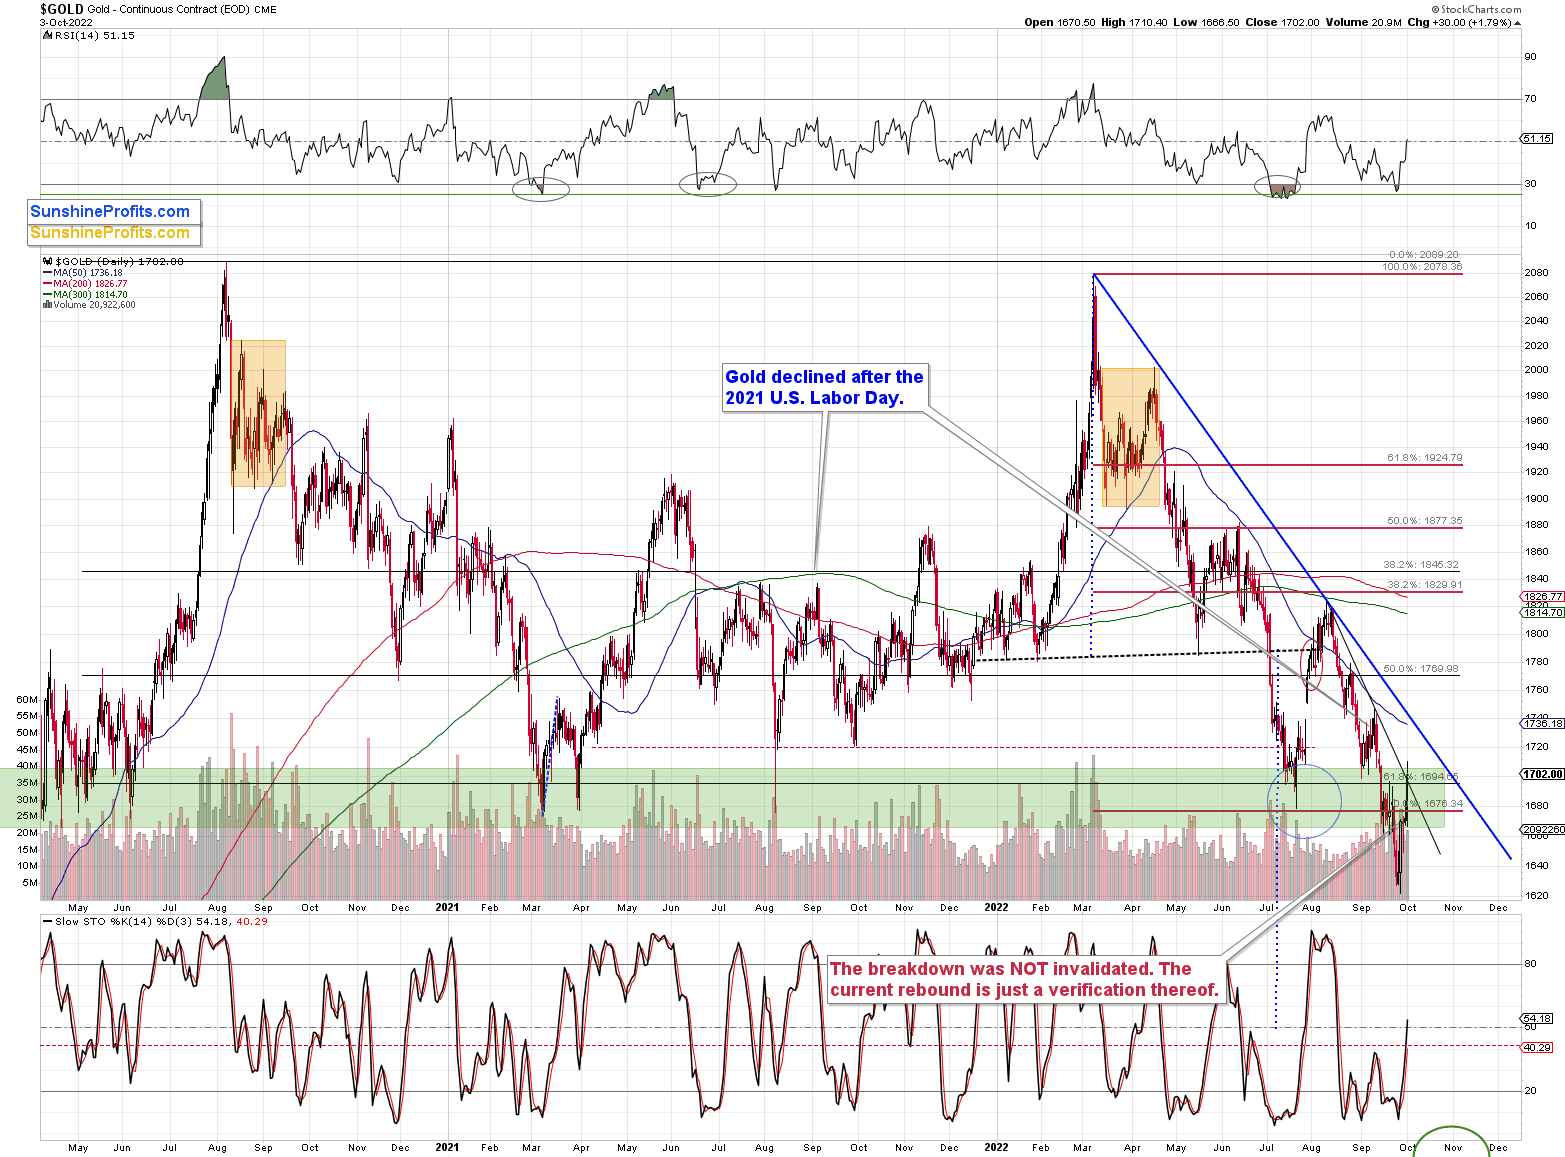
Gold is now slightly above $1,700 (gold futures are trading at $1,718 at the moment of writing these words). There’s very strong resistance just $20 higher – at about $1,740 – the previous high and the declining blue resistance line based on the March and August 2022 highs.
Gold might reverse right away because it’s in the resistance zone and the breakdown below this zone was already confirmed. However, if it first soars to $1,740 and declines only after that, it won’t really change much from the medium-term point of view.
Either way, the link to 2013 is likely to remain intact, and the next really big move is likely to be to the downside.
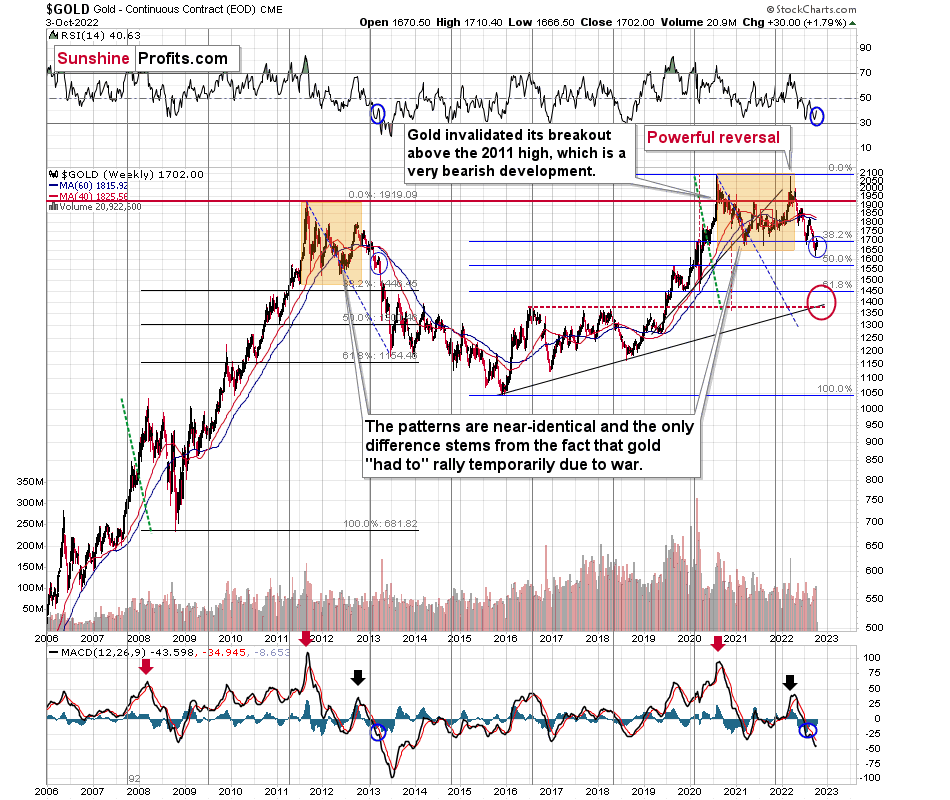
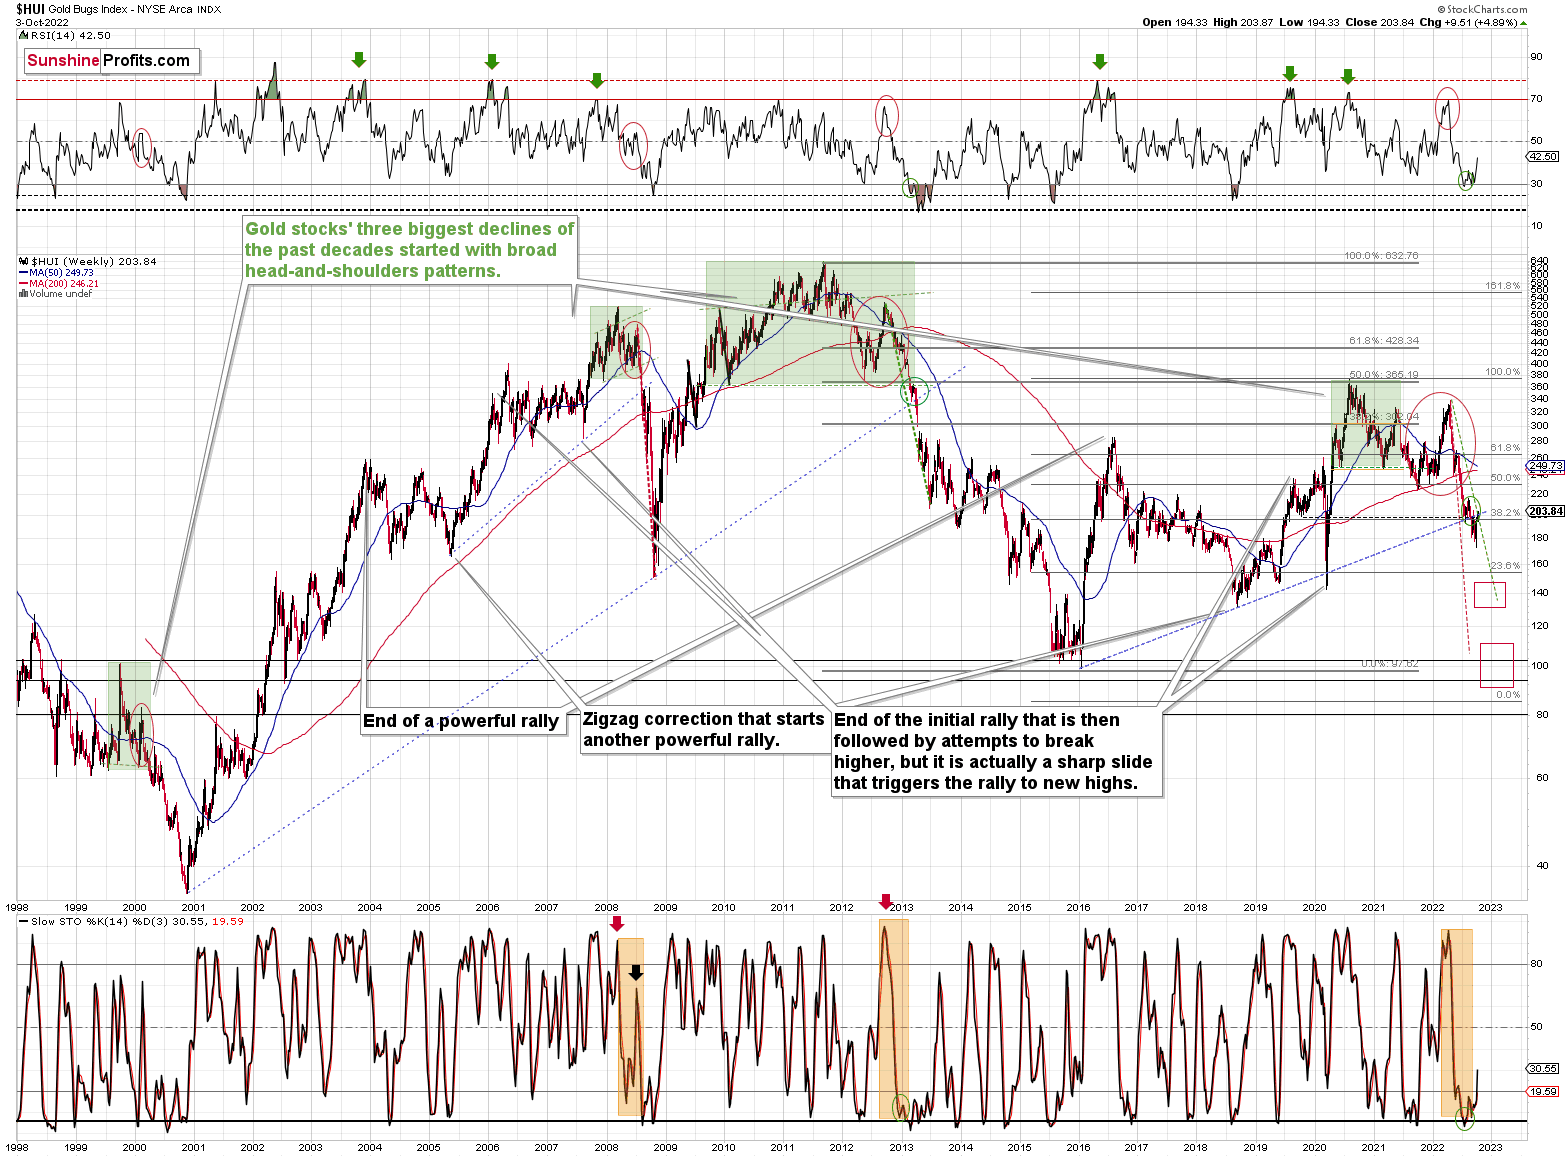
Zooming out, is the situation now really different than what we’ve seen in 2013? No – it remains extremely similar, and the implications are extremely bearish.
Especially since we just saw a major bearish sign from the silver market.
In yesterday’s intraday Alert, I wrote the following about silver’s outperformance:
The precious metals market moved higher today, and I just received the following question:
“What is happening with silver?”
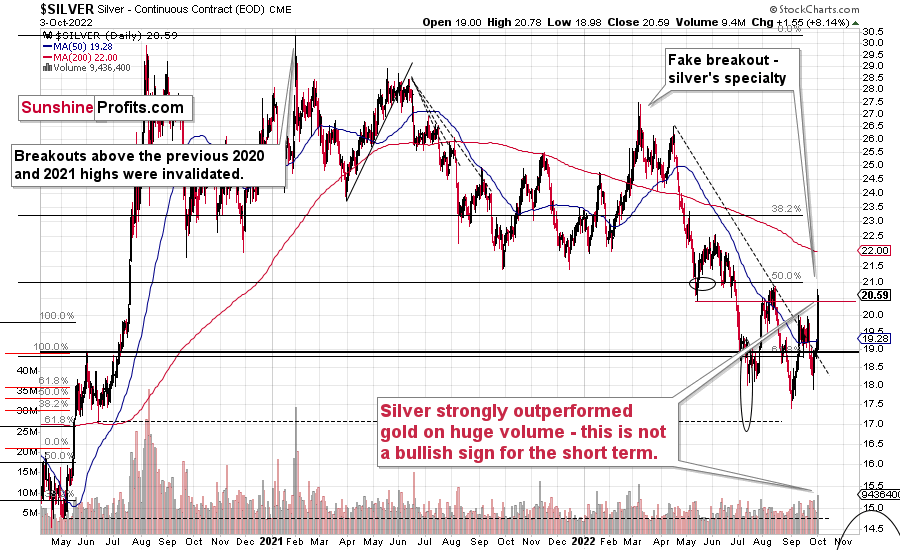
The thing is that silver soared in a major way today, gaining about $1.5. It moved above its September 2022 high, and almost touched its August high.
The GDXJ did move above $30 (it has yet to close above it, though), and gold moved a bit above its late-September highs, and the downtrend in both markets remains visibly intact.
However, silver soared. What gives?
Those, who have been following my analyses for some time likely know what this means. It means that the current move up is likely fake. Silver tends to outperform gold in a major, yet brief way, right at the end of a given upswing, or close to it.
That’s exactly what we see today.
The S&P 500 futures are up today, but let’s not forget that they broke to new yearly lows in weekly terms. Therefore, it would take more than a daily rally to invalidate this bearish indication. Do you remember the Sep. 28 session, where stocks “invalidated” the breakdown to new lows? Well, it was followed by another slide. Since Friday’s breakdown was more important (weekly!), it seems that the bearish forces are likely to return shortly this time as well. And with them, lower gold, silver, and mining stock values.
All in all, the very bearish outlook for the following weeks/months remains intact.
Now, we know that silver’s daily rally was accompanied by one of the biggest volume readings that we’ve seen so far this year. This makes the above even more up-to-date.
The session with the highest volume was the 2022 top, by the way.
So, where do we go from here?
If you’d like a price prediction for the next three days, then I don’t think it’s possible for anyone to provide it. The markets are volatile and are focusing on pretty much random things at the moment. I described what the reality is, and I described what people choose to focus on instead. Emotions, not logic, drive these price moves. Consequently, we could theoretically use – as always – technical tools. However, with this kind of volatility, it’s possible that we get an immediate turnaround, but it’s also possible that the rally remains sharp for several hours – days, and we get a massive reversal only then.
Fortunately, we’re not in the day-trading business, and I haven’t written about short positions in silver, either (the price levels for silver and gold are only provided as some subscribers request that). This means that we can simply continue to focus on what’s much more predictable by using tools that don’t just randomly stop being useful.
The link to 2013 remains intact, and so does the very bearish outlook. When in doubt, or when things appear too hectic, and you want to drop the towel, give up, and run for the hills, take several deep breaths, and return to the long-term charts. Has anything major happened to them. No. So, whatever you see is most likely just short-term price noise.
Investing and trading are simple but not easy. This year has been extremely profitable so far, but no market can move up or down without corrections, and no positions can grow more and more profitable each day – there have to be some corrections. The key thing is how one approaches those days. Will one allow short-term emotions to cloud their vision, or will one stand firm and in tune with the original strategy?
I can’t make any guarantees with regard to gold’s price performance or profitability, but I do think that this counter-trend upswing is just a very temporary phenomenon, and that the big downtrend remains intact. In my opinion, the short position in junior mining stocks remains justified from the risk to reward point of view, and I’m keeping my position intact. Of course, whatever you decide to do with your money is completely up to you – it’s your capital, after all.
Overview of the Upcoming Part of the Decline
- It seems to me that the corrective upswing is over or about to be over after an additional – very brief – rally, and that the next big move lower is already underway.
- If we see a situation where miners slide in a meaningful and volatile way while silver doesn’t (it just declines moderately), I plan to – once again – switch from short positions in miners to short positions in silver. At this time, it’s too early to say at what price levels this could take place and if we get this kind of opportunity at all – perhaps with gold prices close to $1,600.
- I plan to switch from the short positions in junior mining stocks or silver (whichever I’ll have at that moment) to long positions in junior mining stocks when gold / mining stocks move to their 2020 lows (approximately). While I’m probably not going to write about it at this stage yet, this is when some investors might consider getting back in with their long-term investing capital (or perhaps 1/3 or 1/2 thereof).
- I plan to return to short positions in junior mining stocks after a rebound – and the rebound could take gold from about $1,450 to about $1,550, and it could take the GDXJ from about $20 to about $24.
- I plan to exit all remaining short positions once gold shows substantial strength relative to the USD Index while the latter is still rallying. This may be the case with gold prices close to $1,400 and GDXJ close to $15 . This moment (when gold performs very strongly against the rallying USD and miners are strong relative to gold after its substantial decline) is likely to be the best entry point for long-term investments, in my view. This can also happen with gold close to $1,400, but at the moment it’s too early to say with certainty.
- The above is based on the information available today, and it might change in the following days/weeks.
You will find my general overview of the outlook for gold on the chart below:
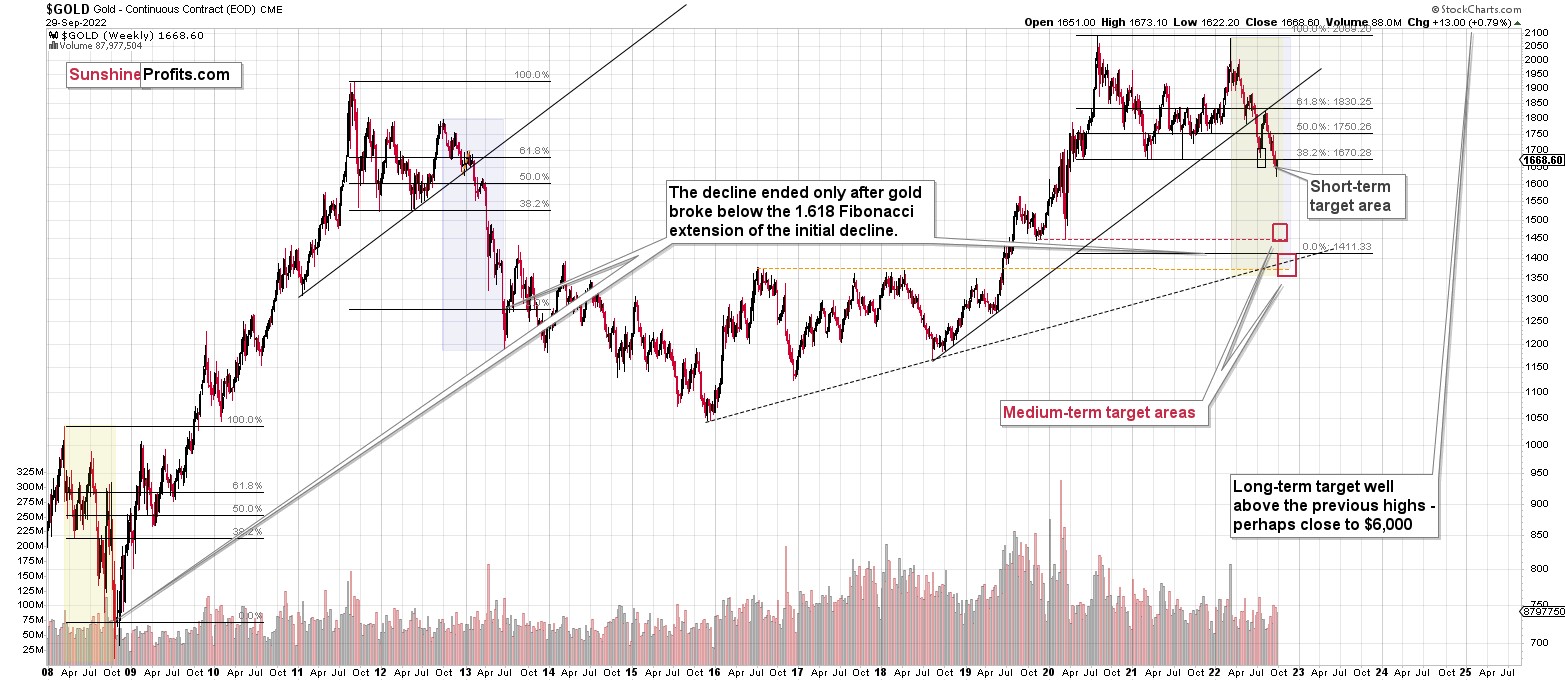
Please note that the above timing details are relatively broad and “for general overview only” – so that you know more or less what I think and how volatile I think the moves are likely to be – on an approximate basis. These time targets are not binding nor clear enough for me to think that they should be used for purchasing options, warrants, or similar instruments.
Summary
Summing up, it seems that the biggest part of the 2013-like decline is taking place right now, and – while I can’t make any promises regarding performance - it seems likely to me that our big profits are about to become huge, and then ridiculously big in the relatively near future.
The current quick upswing most likely doesn’t change anything. Fundamentals and technicals continue to point to lower precious metals values in the coming weeks / months. The current geopolitical news-based rally is likely to serve as nothing more than just a verification of the breakdown below the previous lows in gold.
Things might happen very fast in the coming days, and if I plan to make any adjustments, I’ll keep you informed. Still, if the targets that I’m mentioning in the “Trading” part of the summary are reached, I think that profits should be taken off the table without an additional confirmation from me. I will probably get on the long side of the market at that time, but I’ll send a confirmation if I decide to do so.
After the final sell-off (that takes gold to about $1,350-$1,500), I expect the precious metals to rally significantly. The final part of the decline might take as little as 1-5 weeks, so it's important to stay alert to any changes.
As always, we'll keep you – our subscribers – informed.
To summarize:
Trading capital (supplementary part of the portfolio; our opinion): Full speculative short positions (300% of the full position) in junior mining stocks are justified from the risk to reward point of view with the following binding exit profit-take price levels:
Mining stocks (price levels for the GDXJ ETF): binding profit-take exit price: $20.32; stop-loss: none (the volatility is too big to justify a stop-loss order in case of this particular trade)
Alternatively, if one seeks leverage, we’re providing the binding profit-take levels for the JDST (2x leveraged). The binding profit-take level for the JDST: $29.87; stop-loss for the JDST: none (the volatility is too big to justify a SL order in case of this particular trade).
For-your-information targets (our opinion; we continue to think that mining stocks are the preferred way of taking advantage of the upcoming price move, but if for whatever reason one wants / has to use silver or gold for this trade, we are providing the details anyway.):
Silver futures downside profit-take exit price: $12.32
SLV profit-take exit price: $11.32
ZSL profit-take exit price: $79.87
Gold futures downside profit-take exit price: $1,504
HGD.TO – alternative (Canadian) 2x inverse leveraged gold stocks ETF – the upside profit-take exit price: $19.87
HZD.TO – alternative (Canadian) 2x inverse leveraged silver ETF – the upside profit-take exit price: $49.87
Long-term capital (core part of the portfolio; our opinion): No positions (in other words: cash)
Insurance capital (core part of the portfolio; our opinion): Full position
Whether you’ve already subscribed or not, we encourage you to find out how to make the most of our alerts and read our replies to the most common alert-and-gold-trading-related-questions.
Please note that we describe the situation for the day that the alert is posted in the trading section. In other words, if we are writing about a speculative position, it means that it is up-to-date on the day it was posted. We are also featuring the initial target prices to decide whether keeping a position on a given day is in tune with your approach (some moves are too small for medium-term traders, and some might appear too big for day-traders).
Additionally, you might want to read why our stop-loss orders are usually relatively far from the current price.
Please note that a full position doesn't mean using all of the capital for a given trade. You will find details on our thoughts on gold portfolio structuring in the Key Insights section on our website.
As a reminder - "initial target price" means exactly that - an "initial" one. It's not a price level at which we suggest closing positions. If this becomes the case (as it did in the previous trade), we will refer to these levels as levels of exit orders (exactly as we've done previously). Stop-loss levels, however, are naturally not "initial", but something that, in our opinion, might be entered as an order.
Since it is impossible to synchronize target prices and stop-loss levels for all the ETFs and ETNs with the main markets that we provide these levels for (gold, silver and mining stocks - the GDX ETF), the stop-loss levels and target prices for other ETNs and ETF (among other: UGL, GLL, AGQ, ZSL, NUGT, DUST, JNUG, JDST) are provided as supplementary, and not as "final". This means that if a stop-loss or a target level is reached for any of the "additional instruments" (GLL for instance), but not for the "main instrument" (gold in this case), we will view positions in both gold and GLL as still open and the stop-loss for GLL would have to be moved lower. On the other hand, if gold moves to a stop-loss level but GLL doesn't, then we will view both positions (in gold and GLL) as closed. In other words, since it's not possible to be 100% certain that each related instrument moves to a given level when the underlying instrument does, we can't provide levels that would be binding. The levels that we do provide are our best estimate of the levels that will correspond to the levels in the underlying assets, but it will be the underlying assets that one will need to focus on regarding the signs pointing to closing a given position or keeping it open. We might adjust the levels in the "additional instruments" without adjusting the levels in the "main instruments", which will simply mean that we have improved our estimation of these levels, not that we changed our outlook on the markets. We are already working on a tool that would update these levels daily for the most popular ETFs, ETNs and individual mining stocks.
Our preferred ways to invest in and to trade gold along with the reasoning can be found in the how to buy gold section. Furthermore, our preferred ETFs and ETNs can be found in our Gold & Silver ETF Ranking.
As a reminder, Gold & Silver Trading Alerts are posted before or on each trading day (we usually post them before the opening bell, but we don't promise doing that each day). If there's anything urgent, we will send you an additional small alert before posting the main one.
Thank you.
Przemyslaw Radomski, CFA
Founder, Editor-in-chief

