

Briefly: in our opinion, full speculative long position (150% of the regular position size) in silver is justified from the risk/reward point of view at the moment of publishing this Alert.
Gold declined sharply yesterday, and it took the mining stocks with it. Silver was down but not significantly so.
The decline made the outlook less bullish, but not bearish just yet. Of course, that relates to the short-term only - the outlook never stopped being bearish in case of the medium term.
It could be the case that the second top in gold is already in. However, it doesn't necessarily mean that the decline will accelerate immediately. We could still get another move higher in the PMs, especially if the USD Index declines. During this time, silver would be likely to outperform, just like we had indicated previously.
Why could gold move higher once again? As that would be in tune with how it topped in October 2008, September 2011, and in the first months of 2018. These are the multi-top formations where the first top was formed on huge volume - we featured charts with them in Monday's flagship Gold & Silver Trading Alert.
Anatomy of Gold Tops
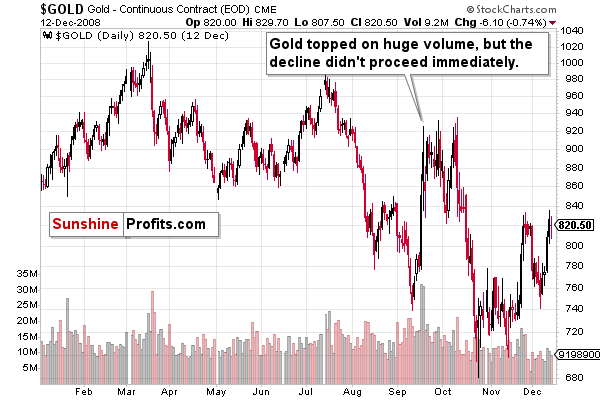
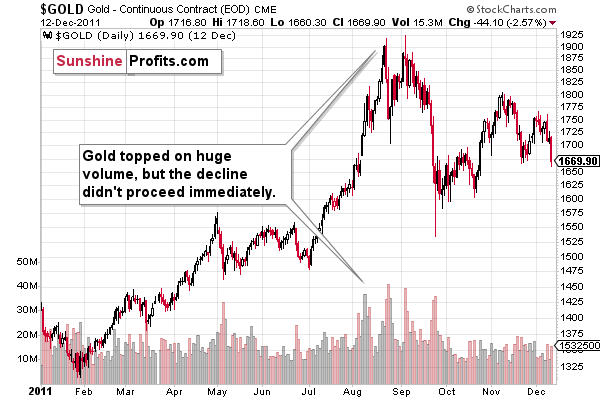
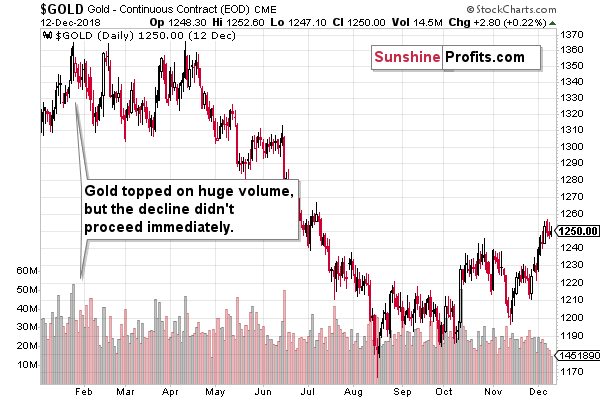
In all three cases, gold topped on huge volume, but the decline didn't proceed immediately. There was a delay in all cases and a re-test of the previous high. The delay took between several days and a few months.
Since a similar pattern followed the huge-volume tops, it seems that we might still see a re-test of the recent high in the near future. We already saw one re-test - gold moved close to $1,600 but failed to rally above it. In all three cases, the attempts to move higher were then followed by sharply lower prices. But, these sharply lower prices were then followed by rallies anyway. Sometimes (2008 and 2018), gold attempted to move to new highs, and sometimes (2011) all gold was able to do was to correct a bit more than half of the preceding decline. Either way, gold didn't slide immediately. This means that gold is likely to decline, but back and forth trading is likely to take place first. Gold could form lower highs and lower lows during this stage, but it's unlikely to just drop hundreds of dollars in a day. At least not shortly.
Gold is likely to decline by hundreds of dollars, but it will take months, not just a day. It could be the case that this move is already underway, but even if it is, choppy trading is much more likely than a decisive, enormous slide now.
Let's add the more up-to-date news to the mix of analogies. In Monday's gold analysis, we explained that the link between fear of the coronavirus and gold is similar to the fear of the ebola virus in 2014.
We also emphasized that based on the fear factor, gold is likely to rally particularly visibly when the fear reaches extreme levels. Based on the levels the fear of ebola reached and the increasing easiness of sharing information and emotions online, the fear of coronavirus has most likely not reached its peak.
However, gold's decline puts this assumption to the test.
Gold Performance in the Coronavirus Days
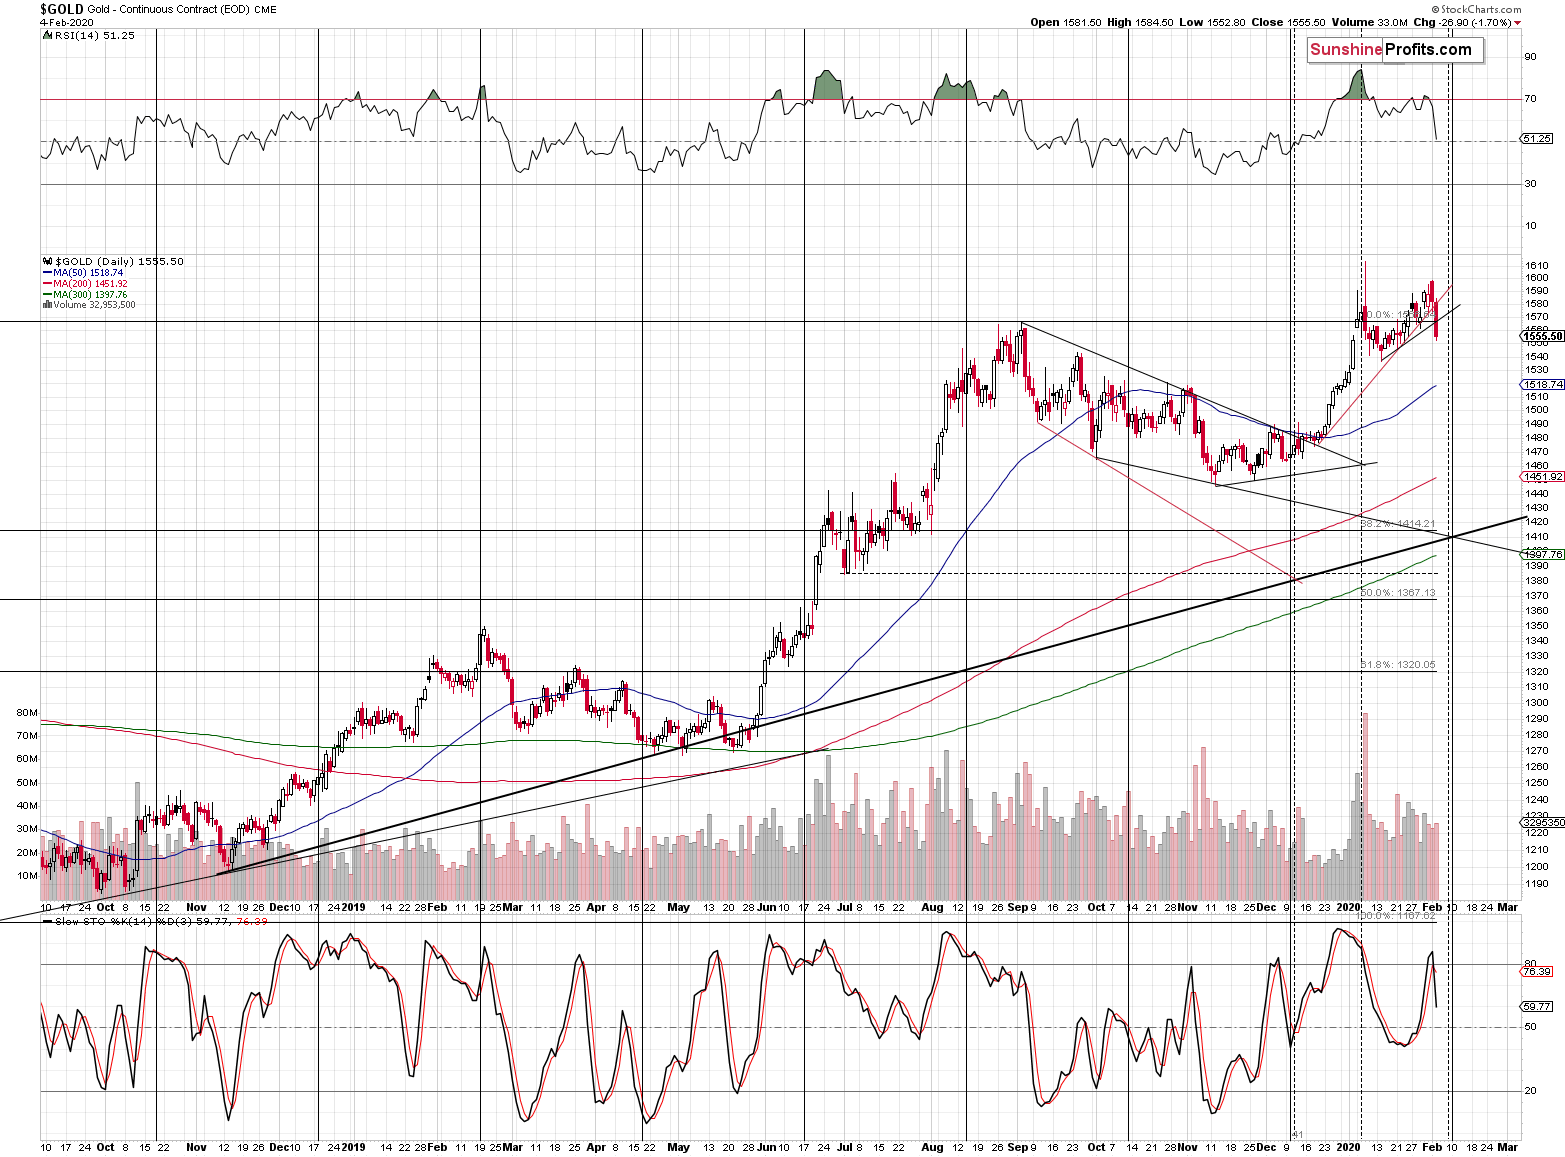
Gold declined about $40 from its recent high.
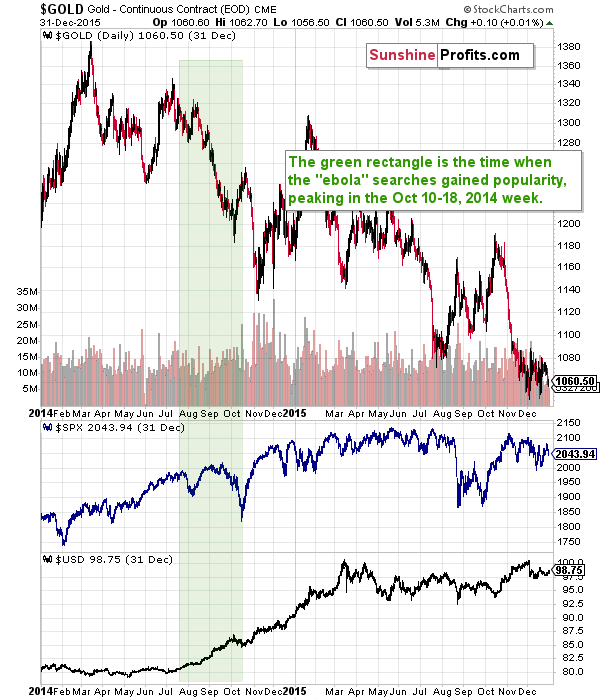
Nothing like that happened during the ebola-scare-peak upswing that we saw in October 2014. It didn't happen during the initial August 2014 rally either.
This may mean that the fear has already peaked.
It may also mean that what we saw was only the initial peak - similar to the August 2014 one.
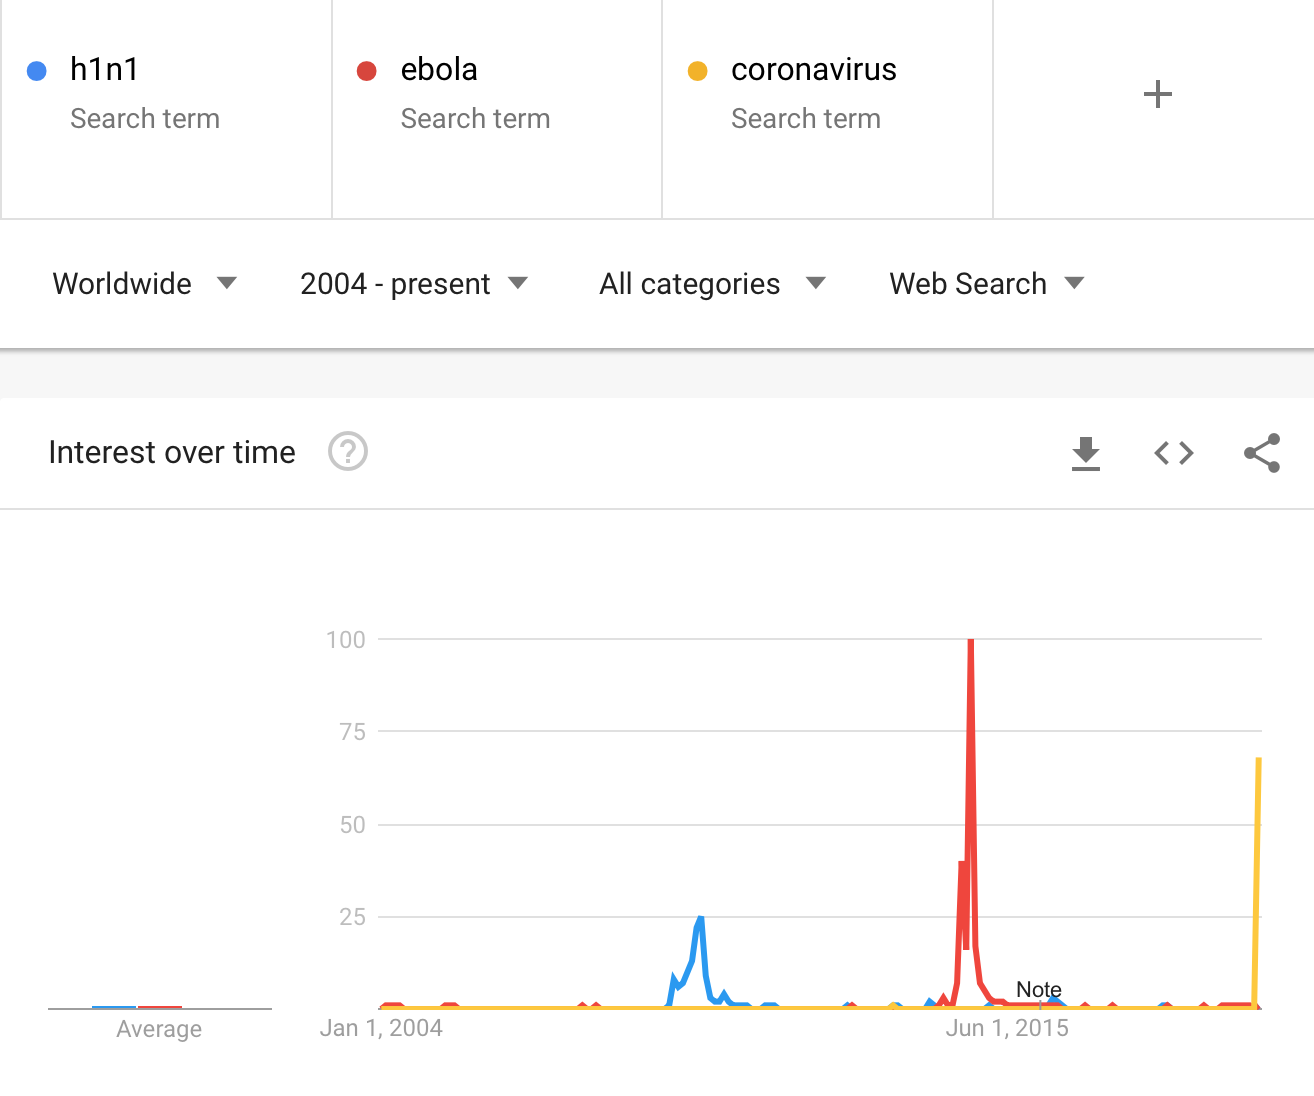
(chart courtesy of Google Trends)
It took some time before both: ebola and h1n1 (swine flu) virus scares were over. The coronavirus scare seems to have only begun.
This means that gold might do whatever it was doing before the coronavirus became the hot topic for some time, and then rally once again when the fear truly spikes.
In mid-2014, gold declined significantly, between both peaks of fear and it wasn't a good idea to wait for the fear to peak as the downtrend was much stronger. Even though the interest in ebola spiked well above its previous high, gold topped well below the previous top.
Based on the virus fear analogy, we are likely to see a short-term rally in gold, but not necessarily right away, and with a top as high as gold's current price. Based on the first-top-on-huge-volume analogy, we are likely to see another very short-term move higher, but it might not be significant - gold might not return to its previous highs as it didn't manage to do so in 2011.
This suggests that, given the way gold reacted yesterday, it's better to stay out of the gold market for a while and prepare to enter a short position to profit on the upcoming big decline. The same goes for the mining stocks, which are unlikely to rally far as the rally in the PMs is ending, not starting.
In case of gold we have two analogies that together paint a rather unclear picture for the short term, and in case of silver, we have two analogies where one is very bullish, and one is rather neutral.
The very bullish case stems from the fact that silver tends to outperform during the final parts of rallies in the precious metals sector.
The rather neutral part is that during the ebola scare, silver didn't perform as well as gold did. The situations are similar, so perhaps silver won't perform as greatly after all.
Both factors are likely to contribute to silver's performance so based on all that we wrote today, we are moving our profit-take levels for silver lower.
Silver's Short-Term Outlook
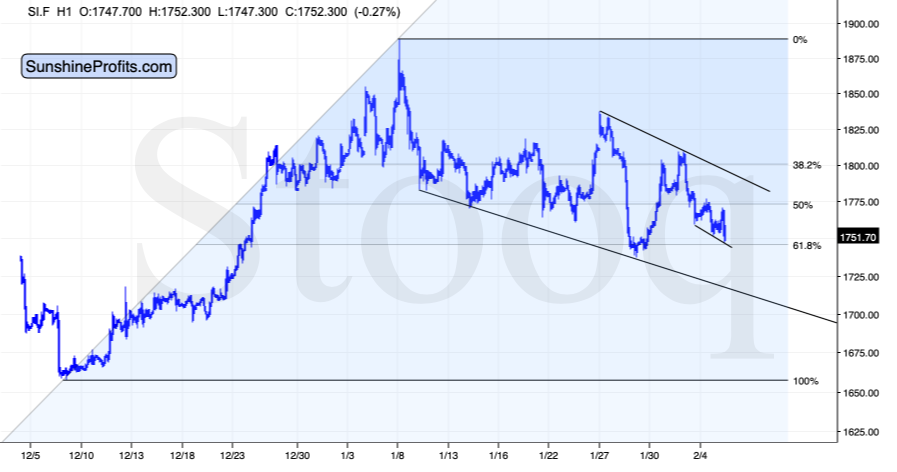
Earlier today, silver seems to have bottomed at the combination of the very short-term declining support line and the 61.8% Fibonacci retracement. It's moving back up as we are writing this.
While silver could still move to or above the early January low, we are moving the profit-take level slightly below the declining resistance line based on the most recent highs. The plan is to then wait for a bearish confirmation, and position ourselves to profit from the upcoming big decline in the PMs.
Meanwhile in the USD Index
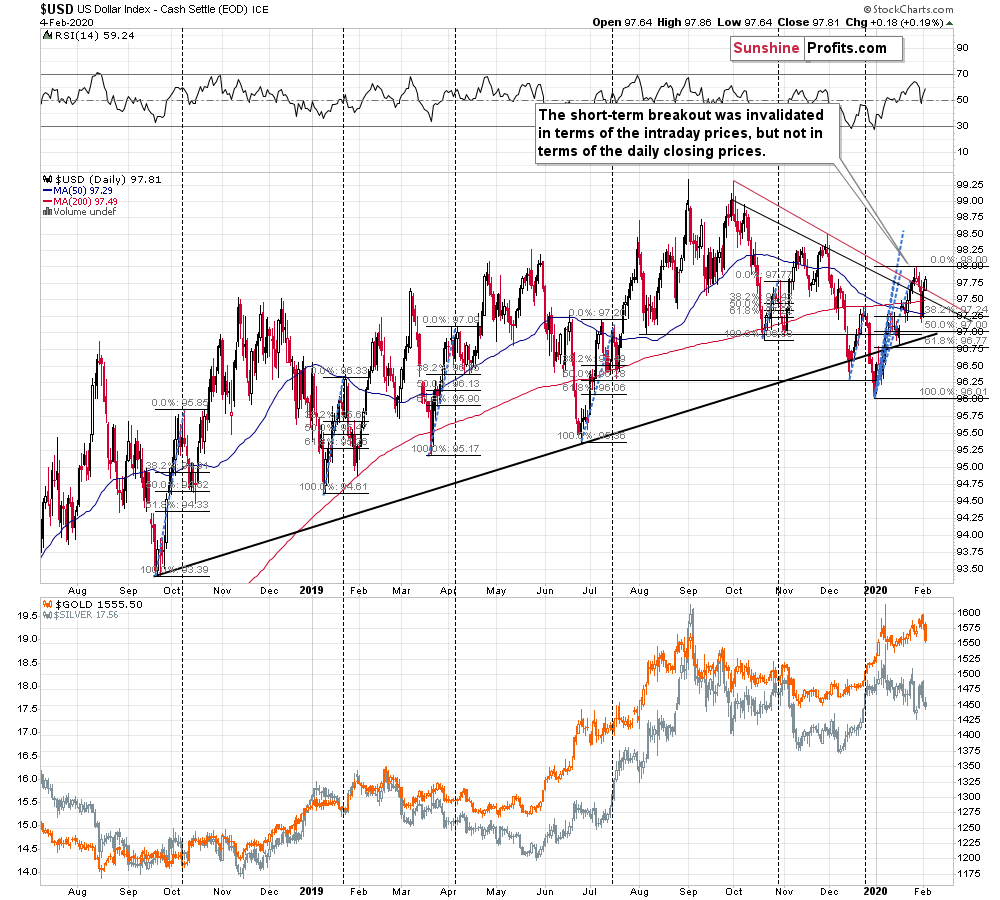
The thing that could make the PMs rally is another decline in the USD Index. After all, that's what triggered the late-January comeback. And a decline in the USD Index could very well take place shortly, as our yesterday's comments on the above chart remain up-to-date:
The above chart shows that the USD Index has not only rallied, but that yesterday's session was volatile overall. It's not that surprising given the significant amount of news that hit the market yesterday. As we wrote in yesterday's Market News Report, most of the news were important from traders' point of view, but not necessarily so from investors' point of view. Indeed, the bigger trends didn't change at all, but the short-term turmoil was definitely present. This has implications going forward as well. Since the news was most likely to cause short-term movement, but not much more, then what was likely to happen, has probably already happened. In other words, one shouldn't expect additional significant market movement based on yesterday's news (like the ISM Manufacturing PMI).
Yesterday, the USD Index moved back above the declining resistance line that's based on the closing prices and in today's pre-market trading, it moved above the upper one, based on the intraday prices. This second attempt to break above the resistance lines may or may not be successful - it's far from being confirmed. In our view, another decline is still more likely.
That's what we saw in April and July 2019 - 2 of the previous 5 similar cases. The additional factor that supports this outcome is the similarity to the shape of the last two important tops - the October and November 2019 tops. In October, there was a small corrective upswing before the decline accelerated. In November, the USDX moved briefly above the previous high before the decline really picked up.
Let's keep in mind that USD's early February rally is likely to be short lived and that the USDX tends to give these gains away closer to the middle of the month, before rallying again. A decline in the next 5 days or so and then a rally would perfectly fit the scenario that we outlined as likely for PMs - a rally for another week or so and then a reversal followed by a decline.
Summary
Summing up, this week or the first days of the next week are likely to include a top in the precious metals market and the end of the short-term rally. Even if gold and silver won't rally above their recent highs, we are still likely to see a very short-term upswing. The medium-term outlook is very bearish and once the short-term correction is over, the declines are likely to resume.
Silver is likely to rally, but given how gold already declined, it might not rally as high as we had been expecting it to initially. Consequently, we are moving the profit-take level for silver lower.
As always, we'll keep you - our subscribers - informed.
To summarize:
Trading capital (supplementary part of the portfolio; our opinion): Full speculative long position (150% of the full position) in silver is justified from the risk/reward perspective with the following stop-loss orders and binding exit profit-take price levels:
- Silver futures: profit-take exit price: $17.89; stop-loss: $17.24; initial target price for the USLV ETN: $90.47; stop-loss for the USLV ETN: $82.95
Long-term capital (core part of the portfolio; our opinion): No positions (in other words: cash)
Insurance capital (core part of the portfolio; our opinion): Full position
Whether you already subscribed or not, we encourage you to find out how to make the most of our alerts and read our replies to the most common alert-and-gold-trading-related-questions.
Please note that the in the trading section we describe the situation for the day that the alert is posted. In other words, it we are writing about a speculative position, it means that it is up-to-date on the day it was posted. We are also featuring the initial target prices, so that you can decide whether keeping a position on a given day is something that is in tune with your approach (some moves are too small for medium-term traders and some might appear too big for day-traders).
Plus, you might want to read why our stop-loss orders are usually relatively far from the current price.
Please note that a full position doesn't mean using all of the capital for a given trade. You will find details on our thoughts on gold portfolio structuring in the Key Insights section on our website.
As a reminder - "initial target price" means exactly that - an "initial" one, it's not a price level at which we suggest closing positions. If this becomes the case (like it did in the previous trade) we will refer to these levels as levels of exit orders (exactly as we've done previously). Stop-loss levels, however, are naturally not "initial", but something that, in our opinion, might be entered as an order.
Since it is impossible to synchronize target prices and stop-loss levels for all the ETFs and ETNs with the main markets that we provide these levels for (gold, silver and mining stocks - the GDX ETF), the stop-loss levels and target prices for other ETNs and ETF (among other: UGLD, DGLD, USLV, DSLV, NUGT, DUST, JNUG, JDST) are provided as supplementary, and not as "final". This means that if a stop-loss or a target level is reached for any of the "additional instruments" (DGLD for instance), but not for the "main instrument" (gold in this case), we will view positions in both gold and DGLD as still open and the stop-loss for DGLD would have to be moved lower. On the other hand, if gold moves to a stop-loss level but DGLD doesn't, then we will view both positions (in gold and DGLD) as closed. In other words, since it's not possible to be 100% certain that each related instrument moves to a given level when the underlying instrument does, we can't provide levels that would be binding. The levels that we do provide are our best estimate of the levels that will correspond to the levels in the underlying assets, but it will be the underlying assets that one will need to focus on regarding the signs pointing to closing a given position or keeping it open. We might adjust the levels in the "additional instruments" without adjusting the levels in the "main instruments", which will simply mean that we have improved our estimation of these levels, not that we changed our outlook on the markets. We are already working on a tool that would update these levels on a daily basis for the most popular ETFs, ETNs and individual mining stocks.
Our preferred ways to invest in and to trade gold along with the reasoning can be found in the how to buy gold section. Additionally, our preferred ETFs and ETNs can be found in our Gold & Silver ETF Ranking.
As a reminder, Gold & Silver Trading Alerts are posted before or on each trading day (we usually post them before the opening bell, but we don't promise doing that each day). If there's anything urgent, we will send you an additional small alert before posting the main one.
Thank you.
Sincerely,
Przemyslaw Radomski, CFA
Editor-in-chief, Gold & Silver Fund Manager

