

Briefly: in our opinion, full (300% of the regular position size) speculative short positions in junior mining stocks are justified from the risk/reward point of view at the moment of publishing this Alert.
Very little changed on the markets on Friday, which means that practically everything I wrote in Friday’s flagship analysis, remains up-to-date. Consequently, today’s analysis will be to a large extent based on what I wrote then. I will put quotes in italics. I’ll start with some of my previous fundamental remarks as they provide key context for this week’s price movement:
What to Watch for [THIS] Week
With more U.S. economic data releases next week, the most important are as follows:
- Sep. 21: FOMC meeting, Summary of Economic Projections (SEP), Chairman Jerome Powell’s press conference.
While the latest Consumer Price Index (CPI) release elicited fears of a 75 or 100 basis point rate hike, the real story is the Fed’s SEP. It will be interesting to see if officials increased their 2023 median projection for the FFR. Likewise, Powell’s presser is also immensely important.
- Sep. 22: KC Fed manufacturing index
Similar to the New York and Philadelphia Fed’s regional reports, the KC Fed’s data will highlight the growth, employment, and inflation developments in Missouri.
- Sep. 23: S&P Global Composite PMI
S&P Global's data is obtained from a nationwide survey, so it's more relevant than the regional reports and is one of the most important releases of the week.
All in all, economic data releases impact the PMs because they impact monetary policy. Moreover, if we continue to see higher employment and inflation, the Fed should keep its foot on the hawkish accelerator. If that occurs, the outcome is profoundly bearish for the PMs.
The FOMC is Coming – So What?
Let’s take an extra look at the paragraph about Sep. 21. I put two parts thereof in bold.
The key thing is that the market now expects interest rates to be raised by at least 0.75%. In fact, right now, about 3/4 of market participants now expect the rates to be hiked by 0.75%, and about 1/4 expect that the rates will be hiked by 1%.
Please remember that the markets’ participants’ expectations tend to move from one extreme to the other, and while previously people became way too dovish, it seems that they have now become excessively bearish with regard to the short term.
Since it’s not clear for the market what’s going to happen, it will be surprised either way. A positive surprise would be bullish for stocks and other markets (like junior miners!), and a negative surprise would be bearish for stocks and other markets (like junior miners!).
The U.S. midterm elections are just around the corner, remember? Is the Fed likely to negatively surprise the market shortly before the elections? That seems very unlikely to me.
The Fed is now hiking interest rates by 0.75%, which means that it will be relatively easy – from the psychological point of view – it’s just the same thing over and over again. It will also be easy to defend when someone asks questions about the decision. “We steadily continue our policy as we’re approaching our goals, and those goals have not been met” – sounds believable, right? And it needs to sound believable if the Fed wants to “avoid the blame” for the stock market crash (that’s going to happen anyway).
So, in my opinion, the Fed won’t hike rates by 1% next week but rather by 0.75%. And then perhaps it will simply continue hiking in this way until the stocks crash and the public “screams” for some kind of relief.
But let’s not go that far. For now, the key thing is that while the rates are likely to be raised exactly by 0.75% next week, the markets are also likely to get a bullish trigger when this decision is made. And – given the looming elections – I wouldn’t be surprised to also hear Powell saying something bullish/dovish during his press conference.
Given the data on one hand and the election-related pressure on the other hand, the optimal scenario for him seems to be to hike the rates, but pretend that he didn’t. As an alternative to what I wrote above, the Fed could hike by 1% but then be very dovish in the speech, stating that they will consider pausing the hikes or something like that.
Either way, based on both the above-mentioned scenarios, the stock market would be likely to bottom once the rates are hiked. Not because that’s fundamentally bullish, but because that will be more dovish than what is being expected on average. In other words, some people will get their expectations fulfilled, but some will be surprised – in a dovish manner, as a 0.75% hike is smaller than a 1% hike.
And that’s only the event itself that I’ve covered so far.
There’s also the market’s tendency to act on the rumor and then reverse on the fact. So, the above – bottom of the rate hike announcement that is already being expected – could happen even if everyone expected the Fed to hike by exactly 0.75%.
In other words, the markets tend to get ahead of themselves.
In this case, it’s quite likely that the markets are about to decline more than they “should” based on the expectations of about a quarter of market participants that the rates are going to be hiked by 1%.
This makes the above-mentioned scenario (markets could bottom close to the Fed’s rate hike decision and then we could see a temporary rebound) even more likely. Technicals support it too.
At this point, I’d like to insert a question that I just received:
Q: Hi PR,
Exciting times in the PM market! I really appreciate your timely analysis. If I am reading last Friday’s analysis correctly, you believe that the market is currently pricing in a fairly hawkish FOMC meeting, and if the Fed comes out with a 75bps hike coupled with a “data dependent” news conference, the indices will likely rally. Won’t this be bullish for junior miners? Knowing you won’t provide individually specific investment advice, wouldn’t it be generally prudent to either sell before Wednesday or at least tighten up stop losses on the JDST position?
Thanks for your time.
A: Thank you, I’m very happy to be of assistance. To clarify, my thoughts about interest rate expectations are not a belief – I’m reporting a fact. Here’s a link to the CME FedWatch tool. At the moment of writing these odds, the market sees an 80% probability of a 0.75% rate hike and a 20% probability of a 1% rate hike.
And yes, if the indices rally based on the 0.75% hike, it would likely be bullish for the miners. It might make sense to sell before Wednesday or on Wednesday.
However, given the similarity to 2013, it could be the case that we’re going to see a powerful slide right before Wednesday’s rebound. And perhaps the downside targets will actually be reached before the FOMC. We’ll see. I’ll keep monitoring the markets and report to you – my subscribers – if needed.
Also, I personally prefer to focus on relative valuations (gold vs. silver, gold stocks vs. gold, gold vs. USDX) than on the price of a given asset itself. This means that I prefer not to use stop-loss orders but rather close the position when the short-term outlook changes. Please note that we haven’t used stop-loss orders in months, and yet, we have only made profitable trades this year.
Technically Speaking
As I just wrote about the stock market, let’s take a closer look at it.
On Friday, I wrote the following:
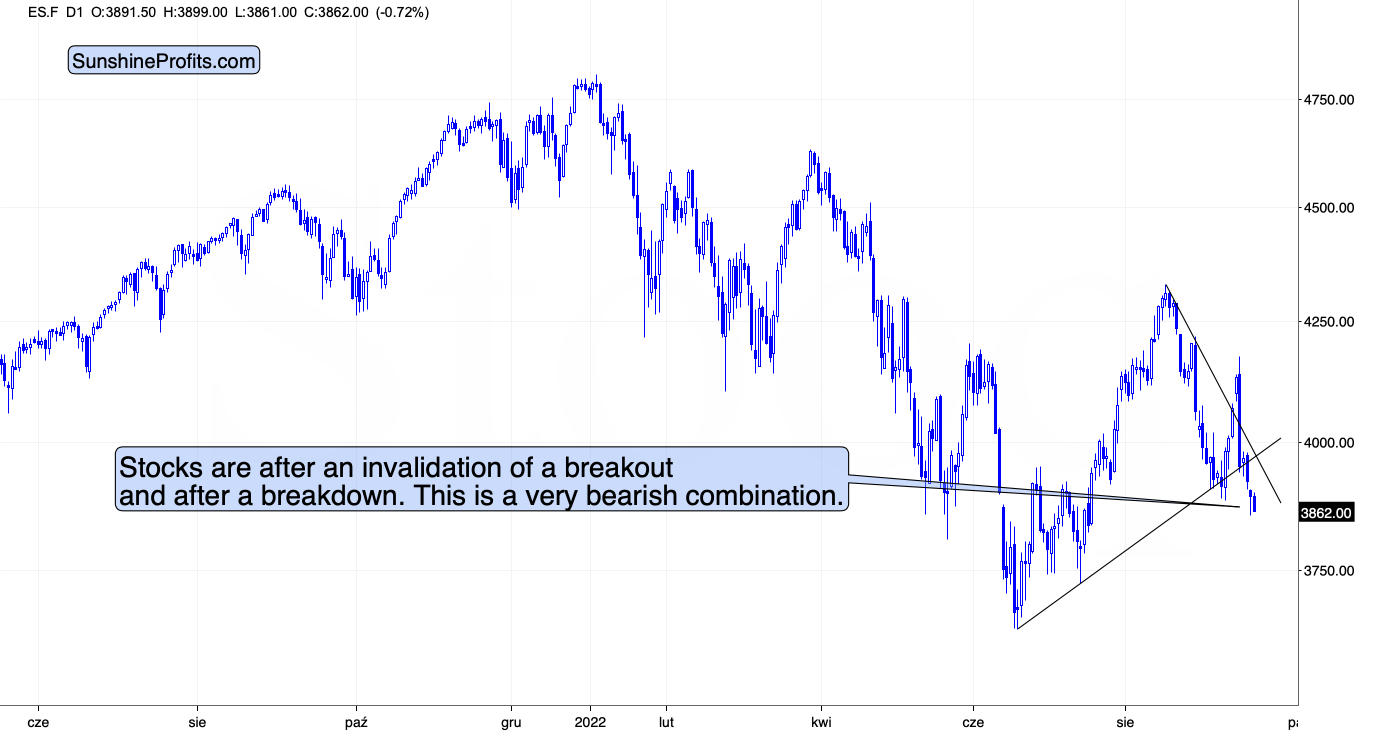
Stocks are after the invalidation of a breakout and right after a breakdown below a rising support line. They also just (in today’s pre-market trading) broke to new monthly lows.
This opens the door wide open to further declines. The previous 2022 lows provide support, but I wouldn’t be surprised stocks if fall even further before forming a short-term bottom.
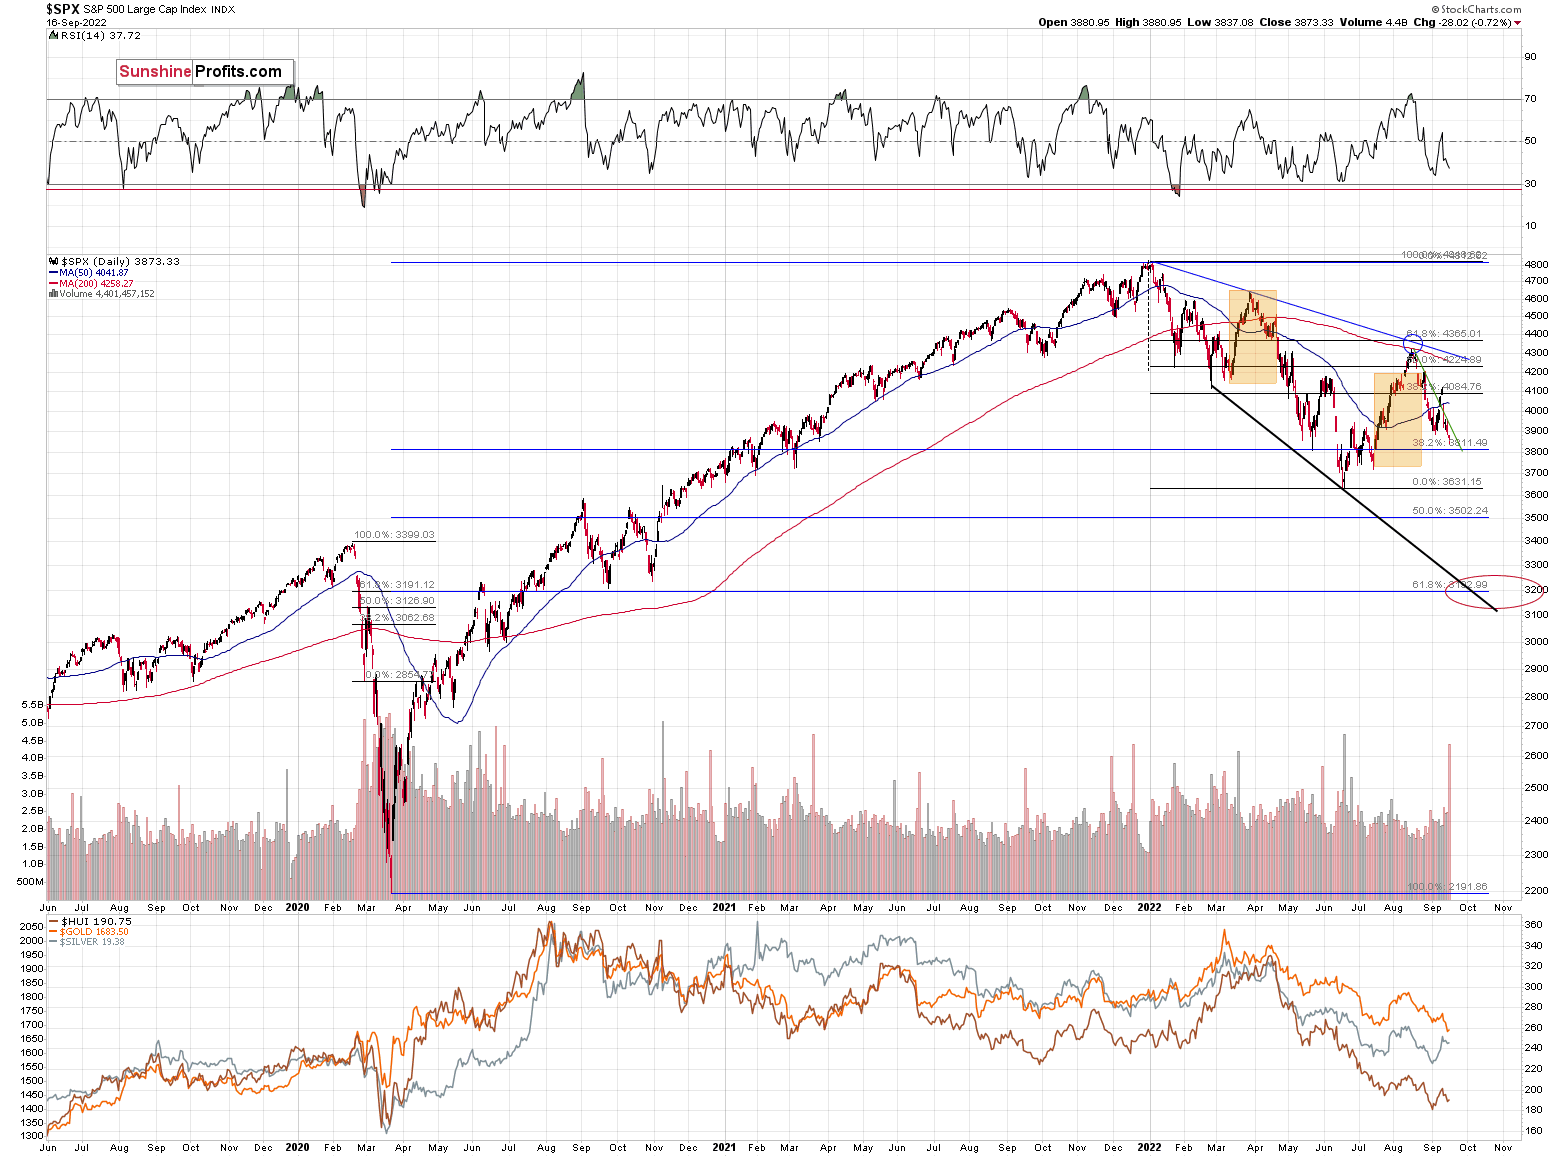
Based on the 50% Fibonacci retracement, the mid-2020 highs, and the fact that it’s a quite round number, there’s strong support at about 3,500 – that’s where we could see the next short-term bottom.
Yes, it’s far, but given how the rate expectations just shifted, that we just saw an invalidation of a breakout and a move to new monthly lows, it’s not unrealistic.
During Friday’s trading, stocks reversed, and this reversal took place on huge volume – one of the biggest sessions volume-wise.
However, at the same time, stocks failed to get back above their previous September 2022 low, and they are also down in today’s pre-market trading (the S&P 500 futures that is). This appears bearish, not bullish, despite the shape of Friday’s session.
Let’s keep in mind that it was a breakdown to new monthly lows in terms of the weekly closing prices.
Speaking of weekly breakdowns…
Gold Breaks Below the 2022 and 2021 Lows!
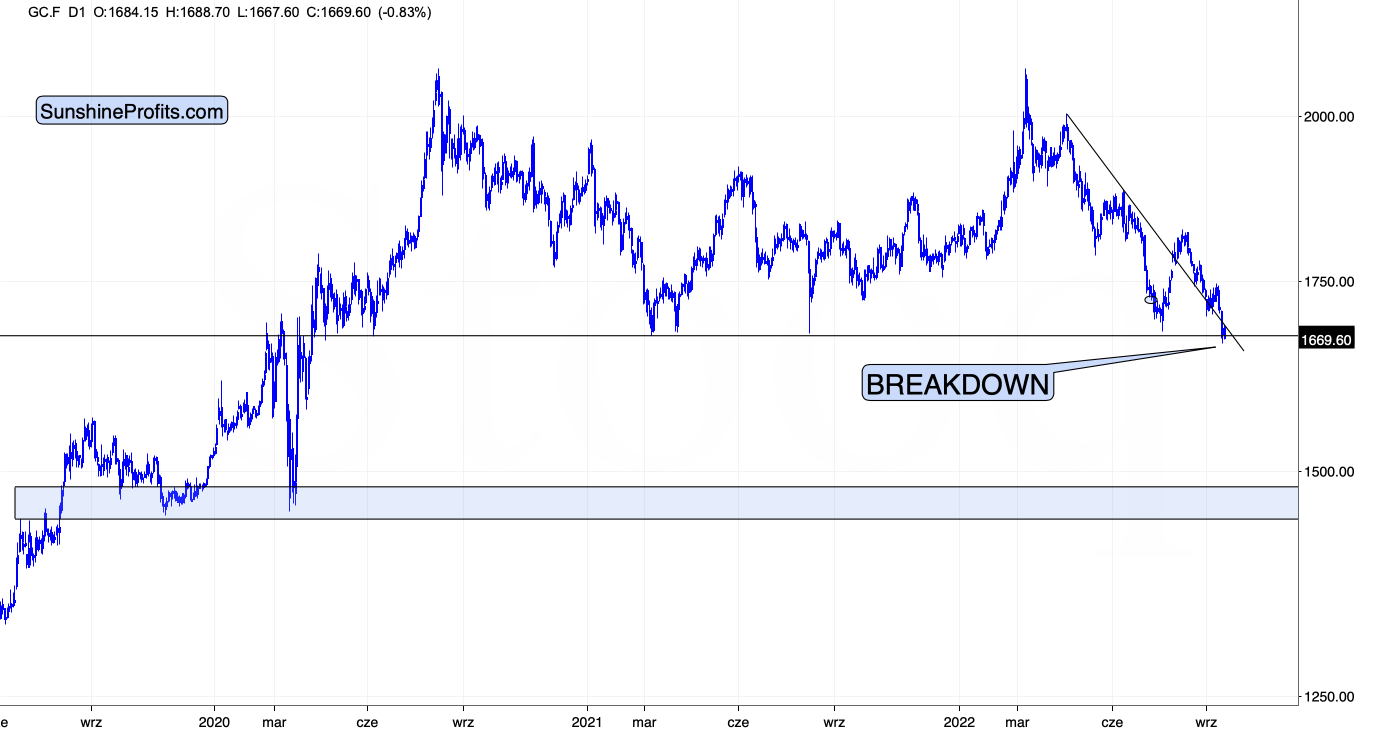
Gold is currently (once again) trading below its 2021 lows.
After Friday’s small rebound (similar to the one in stocks), gold is moving down once again.
The major detail about Friday’s session was that it was the final session of the week. It turned out that we saw a major breakdown below the previous medium-term lows in terms of the weekly closing prices.
While intraday prices are somewhat important, daily closes are important, and it’s the case that weekly closes are very important.
Consequently, the implications here are very bearish, and it could be the case that what we saw on Friday and what we see today is the beginning of a big move lower.
Given similar price moves and similar emotional environments (fear/greed combination that are ultimately represented by price/volume moves), markets behave in similar ways. What we see right now is a remarkably clear analogy to what we saw in 2013. Based on this analogy, we were likely to see a relatively steady decline with corrective upswings. That’s exactly what happened.
However, this week’s breakdown shows that the gold market is now ready to enter the next stage of the analogy. The stage on which it truly slides.
There is some support right below the $1,600 level based on the previous short-term bottom. However, based on the analogy to 2013, it seems that gold is likely to drop much more than just slightly below $1,600 before bouncing in a meaningful manner.
The really strong combination of support levels is located a bit below $1,500 – approximately between $1,450 and $1,480.
The 2020 lows seem to be the most notable – and thus most important – part of the entire support area. At that time, gold futures bottomed at $1,450.90, so any move below $1,460 can be viewed as the target being “in” – it will be “close enough” from the practical point of view.
(Junior) Mining Stocks
If gold is about to slide to its 2020 lows, and then below, the same is likely to take place in junior mining stocks.
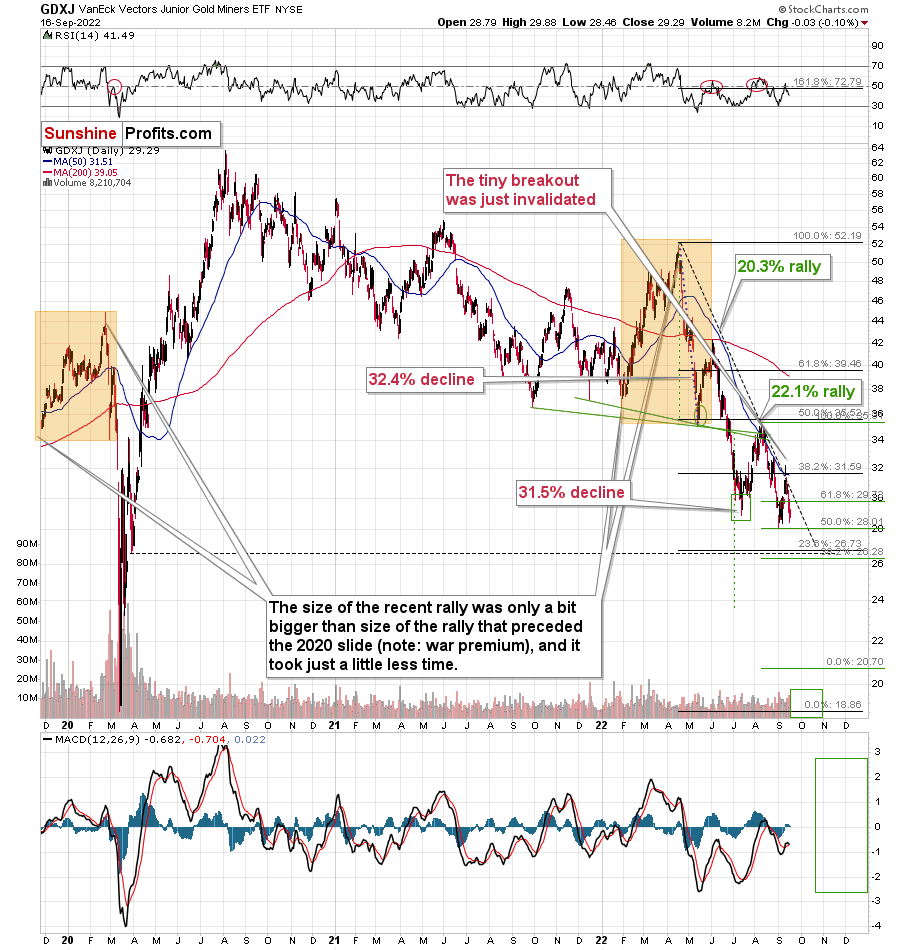
The GDXJ is still declining rather steadily, and not sharply, but that’s very much in tune with what happened in 2013. Consequently, it’s not bullish. I explained the analogy i.a. in yesterday’s Gold & Silver Trading Alert, so I won’t go into those details again today.
What I do want to emphasize is that junior miners can really slide that fast and that low.
Remember what happened in 2020? Yes, it’s not 2020, and it’s not the start of the pandemic / lockdowns. However, junior miners are not starting their decline from about $40. They started it at about $32 right now. So, if they decline to $20 or slightly below it, then this immediate-term – while being huge – will still be smaller than what we saw in 2020.
Once the GDXJ declines to $20 or so (and gold to about $1,450), then both markets are likely to rebound. In the case of the GDXJ, I wouldn’t be surprised to see a very quick rebound to $24 or so.
Then, as gold declines one more time, GDXJ could slide all the way down to its 2016 low or even slightly below it. Yes, a move to $15 or so (from the above-mentioned $24) could indeed take place.
And yes, it does sound ridiculous, but this is the case only when one compares the above to the normal market circumstances. Based on gold’s breakdown below 2021 lows and – most importantly – analogy to 2013 – it seems that these are not normal circumstances. This is likely a repeat of one of the biggest declines of the previous decades.
Will the precious metals sector really slide this week? It seems likely, but there’s no guarantee that it will happen. If it does – we are prepared. If it doesn’t, it’s likely to slide relatively soon anyway, so we’d probably just have to wait a bit longer. Either way, it seems that the short positions in junior mining stocks are justified from the risk to reward point of view.
Having said that, let’s take a look at the markets from a more fundamental angle.
High Five
With the crowd reacting rather than anticipating, consensus rate hike expectations have materially shifted on Wall Street. Moreover, while I’ve been warning for months that the U.S. federal funds rate (FFR) needed to go much higher than many expected, suddenly, the consensus aligns with our way of thinking. To explain, I wrote on Aug. 1:
While the consensus assumes the Fed is near the end of its rate hike cycle, the Consumer Price Index (CPI) is on the fast track to 2% and a 3% FFR will be enough to capsize inflation, market participants are living in fantasy land.
For example, I’ve warned on numerous occasions that demand is much stronger than the consensus realizes. With Americans’ checking account balances at unprecedented all-time highs and the Atlanta Fed’s wage growth tracker hitting an all-time high in June, the FFR needs to go meaningfully above 3%. I wrote on Jul. 25:
With more earnings calls showcasing how the situation continues to worsen, market participants don’t realize that the U.S. federal funds rate needs to hit ~4.5% or more for the Fed to materially reduce inflation. For context, the consensus expects a figure in the 2.5% to 3.5% range.
Thus, what a difference ~two months makes. With strategists increasing their FFR projections and the new consensus calling for 4% to 5% (roughly 4.5% is now priced in), the crowd is always late to the party.
Please see below:
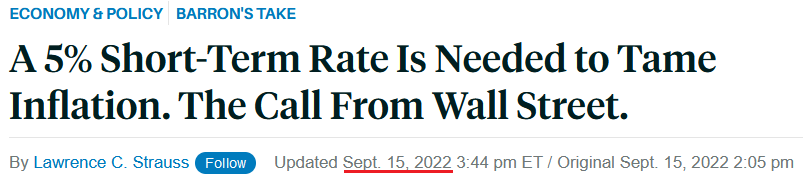 Source: Barron’s
To that point, while I warned repeatedly that the FFR needs to eclipse the inflation rate to curb the pricing pressures, suddenly, Wall Street is waking up to this reality as well.
Please see below:
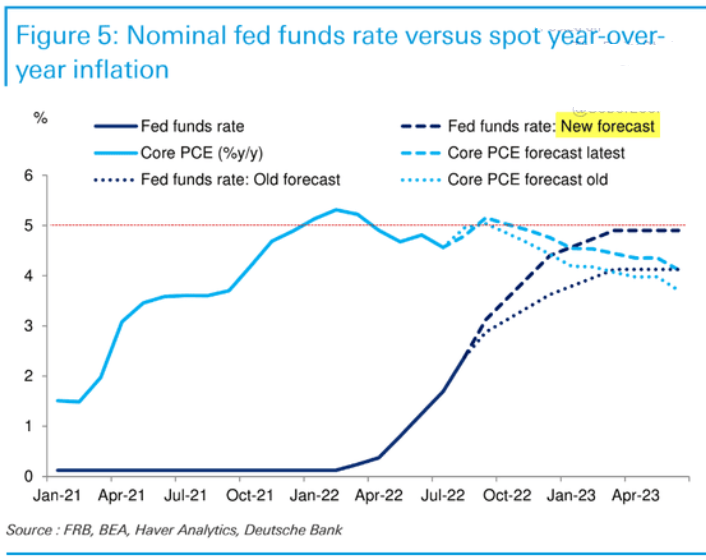
To explain, Deutsche Bank increased its FFR projection from ~4% to 5% and told clients how the FFR has always risen above the year-over-year (YoY) percentage change in the core Personal Consumption Expenditures (PCE) Index to reduce inflation. Furthermore, with the core PCE peaking at 5.31% (so far), market expectations have moved closer to reality.
More importantly, a realization is profoundly bearish for gold, silver, mining stocks and the S&P 500. For example, the U.S. 10-Year real yield hit another 2022 high of 1.07% on Sep. 16, and the metric is only 10 basis points away from its 2018 high. In addition, further rate hikes are bullish for the USD Index and the U.S. 10-Year real yield, which means the PMs confront a treacherous fundamental environment in the months ahead.
On top of that, while I warned that consumer demand was much more resilient than the consensus realized, the cash hoard built up by American households will make the Fed’s inflation fight highly arduous. To explain, I wrote on Mar. 31:
There is a misnomer in the financial markets that inflation is a supply-side phenomenon. In a nutshell: COVID-19 restrictions, labor shortages, and manufacturing disruptions are the reasons for inflation’s reign. As such, when these issues are no longer present, inflation will normalize and the U.S. economy will enjoy a “soft landing.”
However, investors’ faith in the narrative will likely lead to plenty of pain over the medium term. For example, I’ve noted for some time that the U.S. economy remains in a healthy position; and with U.S. consumers flush with cash and a red-hot labor market helping to bloat their wallets, their propensity to spend keeps economic data elevated.
Likewise, while most investors assumed that consumer spending and inflation would fall off a cliff when enhanced unemployment benefits ended in September, the reality is that neither will die easily.
U.S. households have nearly $3.89 trillion in their checking accounts. For context, this is 288% more than Q4 2019 (pre-COVID-19). As a result, investors misunderstand the amount of demand that’s driving inflation.
To that point, the Fed updated the data on Sep. 9; and with the metric hitting another all-time high, American households have nearly $4.708 trillion in their checking accounts (as of Q2), a 357% increase from Q4 2019.
Please see below:
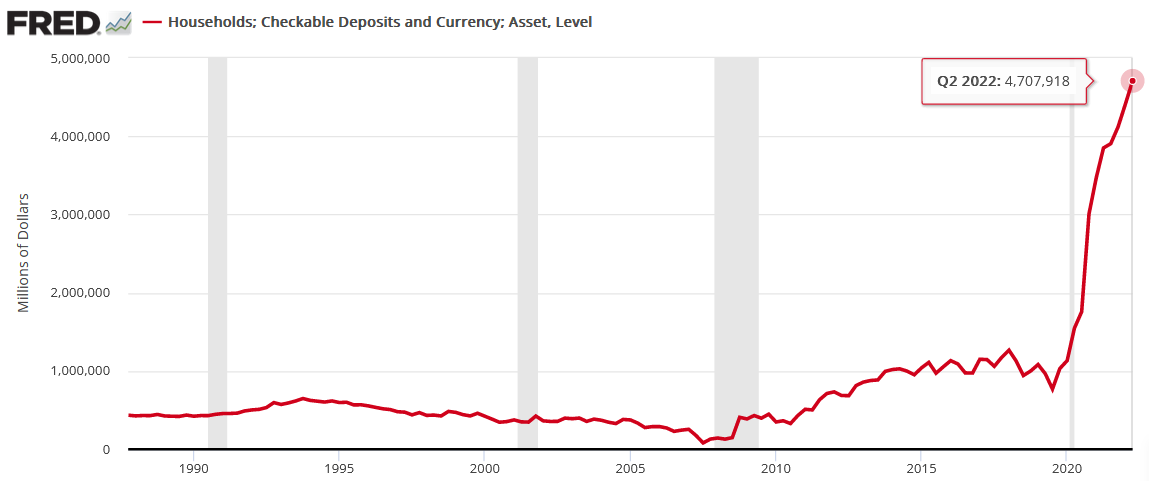
Furthermore, the Q2 figure is 6.7% higher than Q1. So while the old narrative assumed that Americans had exhausted all of their spending power, and therefore, inflation would subside, the reality is that Americans have more money in their checking accounts now than in 2021. As such, the Fed will have to keep its foot on the hawkish accelerator, and a realization has ominous implications for risk assets.
More Is Needed
With the next FOMC meeting scheduled for Sep. 20-21, the real story is whether or not officials increase their median FFR projection. Moreover, with inflation slowing at a snail’s pace, a higher-for-longer FFR is needed to cool the pricing pressures.
For example, the Cleveland Fed estimates that the headline and core CPIs will increase by 0.33% and 0.51% month-over-month (MoM), respectively, when September’s data is released on Oct. 13. Thus, the Fed’s 2022 rate hikes have done little to eliminate inflation outside of cooling the U.S. housing market.
Please see below:
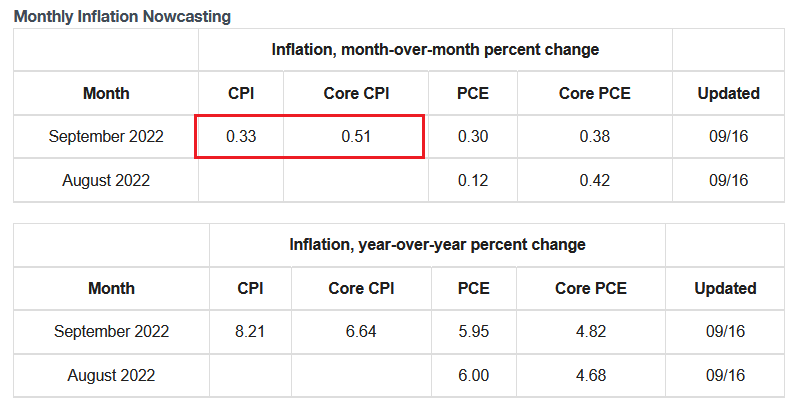 Source: Cleveland Fed
In addition, Bank of America projects that the core CPI will end 2022 at 5.9% YoY. Likewise, with the headline CPI projected to end the year even higher, the figures are nowhere near 2%.
Please see below:
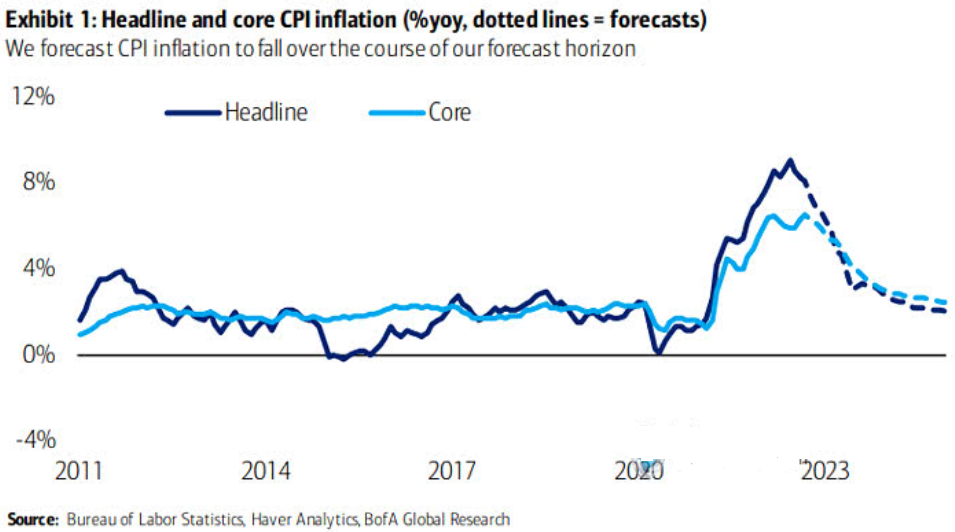
To explain, the dark and light blue lines above track the realized headline and core CPIs, while the dashed lines above represent Bank of America’s projections. If you analyze the right side of the chart, you can see that the headline and core CPIs aren’t expected to approach 2% until 2024 and beyond. As a result, the Fed can’t wait that long and will need to act in the interim to normalize the metrics.
Speaking of which, I noted above how the Cleveland Fed expects the headline CPI to increase by 0.33% MoM in September. Well, if the index maintains a similar monthly trajectory, the headline CPI will still be north of 4% YoY in Q2 2023.
Please see below:
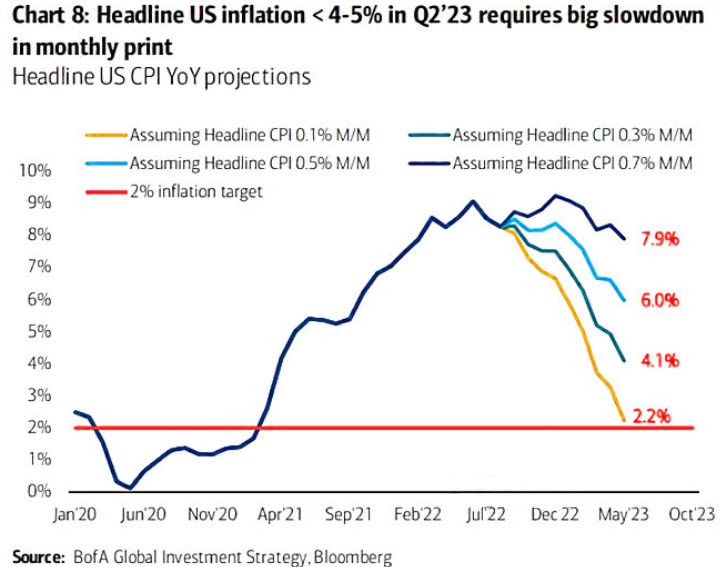
To explain, the various lines above track the YoY path of the headline CPI, assuming constant MoM prints. If you analyze the teal line, 0.30% MoM readings will equate to a 4.1% YoY reading in Q2 2023.
However, it’s important to remember that while lower commodity prices are bearish for the headline CPI, they’re bullish for the core CPI. Remember, less money spent on oil, gas, and food affords Americans more cash to spend on discretionary items. Therefore, it’s no surprise that the headline CPI declined YoY in August (the red line below), while the core CPI increased YoY in August (the green line below).
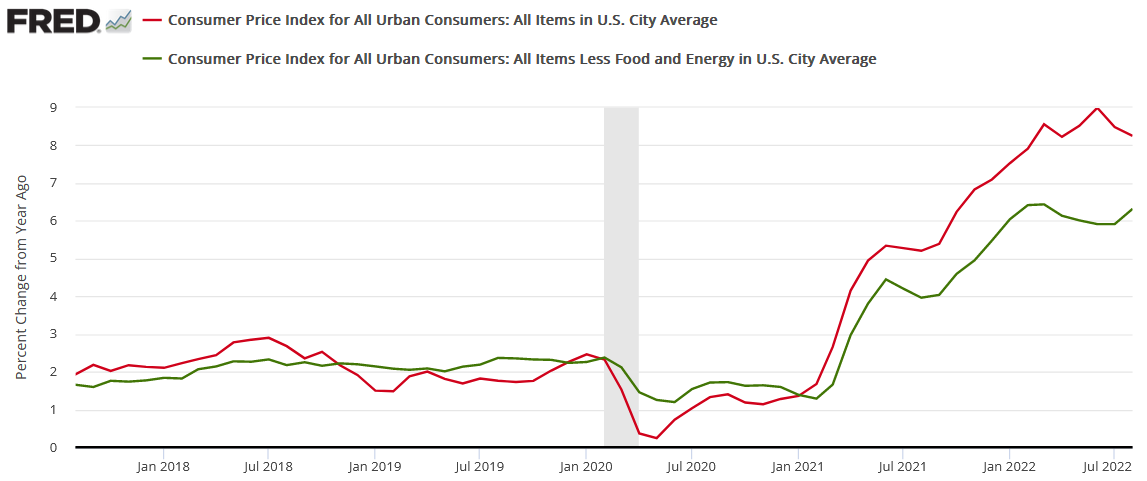
Thus, even though a headline CPI of 4.1% is roughly double the Fed’s 2% target, there is much more to this inflation story than food and energy. As such, the Fed should target Americans’ discretionary spending to alleviate inflation. Since 1954, every inflation fight has ended in a recession.
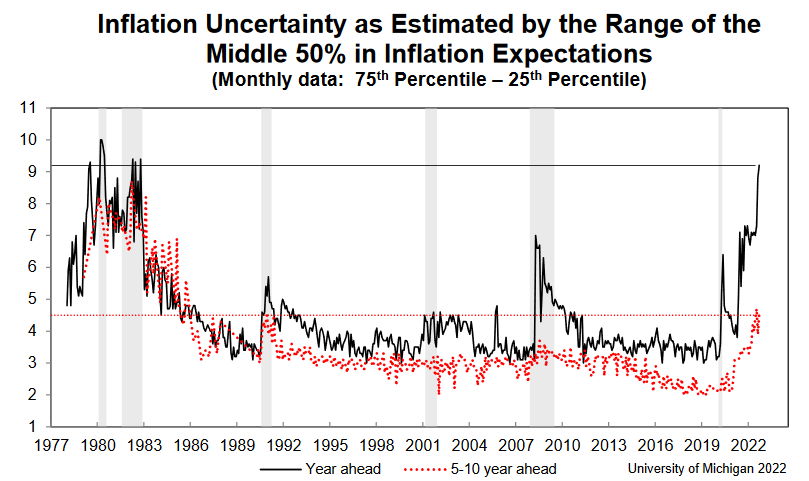
Finally, the University of Michigan released its Consumer Sentiment Index on Sep. 16. Moreover, while Americans’ inflation expectations declined, the report revealed:
“It is unclear if these improvements will persist, as consumers continued to exhibit substantial uncertainty over the future trajectory of prices. Uncertainty over short-run inflation reached levels last seen in 1982, and uncertainty over long-run inflation rose from 3.9 to 4.5 this month, well above the 3.4 level seen last September.”
As a result, with Americans extremely anxious about the year-ahead inflation outlook (the black line below), the Fed has plenty of work to do to restore its credibility.
The Bottom Line
While the crowd now sees things from our perspective, the hawkish ramifications of a 4.5% to 5.5% FFR are still far from priced in. For example, reducing Americans’ discretionary spending is profoundly bearish for S&P 500 companies’ earnings. Therefore, while households still have plenty of money to spend, weakening the U.S. labor market, reducing wages, and forcing Americans to draw down their checking account balances should have drastic implications in the months ahead.
Furthermore, the liquidity beneficiaries should suffer the most, and gold, silver, and mining stocks are highly sensitive to the performance of the USD Index and the U.S. 10-Year real yield.
In conclusion, the PMs were mixed on Sep. 16, as the GDXJ ETF ended the day in the red. Moreover, with the Fed hawked up and the U.S. 10-Year real yield continuing its ascent, the PMs’ medium-term outlooks continue to worsen. As such, we expect lower lows to materialize in the months ahead before long-term buying opportunities emerge.
Overview of the Upcoming Part of the Decline
- It seems to me that the corrective upswing is over, and that the next big move lower is already underway.
- If we see a situation where miners slide in a meaningful and volatile way while silver doesn’t (it just declines moderately), I plan to – once again – switch from short positions in miners to short positions in silver. At this time, it’s too early to say at what price levels this could take place and if we get this kind of opportunity at all – perhaps with gold prices close to $1,600.
- I plan to switch from the short positions in junior mining stocks or silver (whichever I’ll have at that moment) to long positions in junior mining stocks when gold / mining stocks move to their 2020 lows (approximately). While I’m probably not going to write about it at this stage yet, this is when some investors might consider getting back in with their long-term investing capital (or perhaps 1/3 or 1/2 thereof).
- I plan to return to short positions in junior mining stocks after a rebound – and the rebound could take gold from about $1,450 to about $1,550, and it could take the GDXJ from about $20 to about $24.
- I plan to exit all remaining short positions once gold shows substantial strength relative to the USD Index while the latter is still rallying. This may be the case with gold prices close to $1,400 and GDXJ close to $15 . This moment (when gold performs very strongly against the rallying USD and miners are strong relative to gold after its substantial decline) is likely to be the best entry point for long-term investments, in my view. This can also happen with gold close to $1,400, but at the moment it’s too early to say with certainty.
- The above is based on the information available today, and it might change in the following days/weeks.
You will find my general overview of the outlook for gold on the chart below:
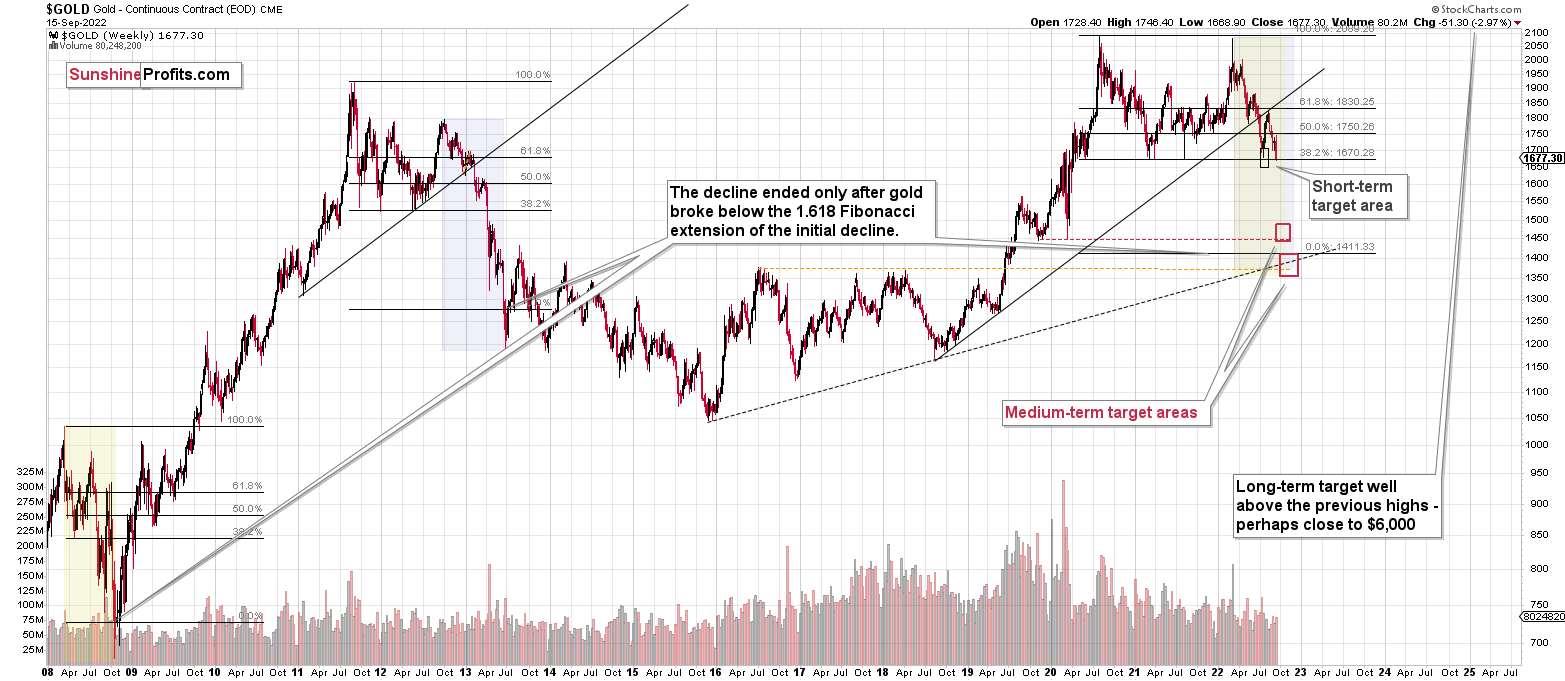
Please note that the above timing details are relatively broad and “for general overview only” – so that you know more or less what I think and how volatile I think the moves are likely to be – on an approximate basis. These time targets are not binding nor clear enough for me to think that they should be used for purchasing options, warrants, or similar instruments.
Summary
Summing up, it seems that the biggest part of the 2013-like decline is taking place right now, and – while I can’t make any promises regarding performance - it seems likely to me that our big profits are about to become huge, and then ridiculously big in the relatively near future.
Please make sure that you check the updates in the “Overview of the Upcoming Part of the Decline” section.
Things might happen very fast in the coming days, and if I plan to make any adjustments, I’ll keep you informed. Still, if the targets that I’m mentioning in the “Trading” part of the summary are reached, I think that profits should be taken off the table without an additional confirmation from me. I will probably get on the long side of the market at that time, but I’ll send a confirmation if I decide to do so.
After the final sell-off (that takes gold to about $1,350-$1,500), I expect the precious metals to rally significantly. The final part of the decline might take as little as 1-5 weeks, so it's important to stay alert to any changes.
As always, we'll keep you – our subscribers – informed.
To summarize:
Trading capital (supplementary part of the portfolio; our opinion): Full speculative short positions (300% of the full position) in junior mining stocks are justified from the risk to reward point of view with the following binding exit profit-take price levels:
Mining stocks (price levels for the GDXJ ETF): binding profit-take exit price: $20.32; stop-loss: none (the volatility is too big to justify a stop-loss order in case of this particular trade)
Alternatively, if one seeks leverage, we’re providing the binding profit-take levels for the JDST (2x leveraged). The binding profit-take level for the JDST: $29.87; stop-loss for the JDST: none (the volatility is too big to justify a SL order in case of this particular trade).
For-your-information targets (our opinion; we continue to think that mining stocks are the preferred way of taking advantage of the upcoming price move, but if for whatever reason one wants / has to use silver or gold for this trade, we are providing the details anyway.):
Silver futures downside profit-take exit price: $12.32
SLV profit-take exit price: $11.32
ZSL profit-take exit price: $79.87
Gold futures downside profit-take exit price: $1,504
HGD.TO – alternative (Canadian) 2x inverse leveraged gold stocks ETF – the upside profit-take exit price: $19.87
HZD.TO – alternative (Canadian) 2x inverse leveraged silver ETF – the upside profit-take exit price: $49.87
Long-term capital (core part of the portfolio; our opinion): No positions (in other words: cash)
Insurance capital (core part of the portfolio; our opinion): Full position
Whether you’ve already subscribed or not, we encourage you to find out how to make the most of our alerts and read our replies to the most common alert-and-gold-trading-related-questions.
Please note that we describe the situation for the day that the alert is posted in the trading section. In other words, if we are writing about a speculative position, it means that it is up-to-date on the day it was posted. We are also featuring the initial target prices to decide whether keeping a position on a given day is in tune with your approach (some moves are too small for medium-term traders, and some might appear too big for day-traders).
Additionally, you might want to read why our stop-loss orders are usually relatively far from the current price.
Please note that a full position doesn't mean using all of the capital for a given trade. You will find details on our thoughts on gold portfolio structuring in the Key Insights section on our website.
As a reminder - "initial target price" means exactly that - an "initial" one. It's not a price level at which we suggest closing positions. If this becomes the case (as it did in the previous trade), we will refer to these levels as levels of exit orders (exactly as we've done previously). Stop-loss levels, however, are naturally not "initial", but something that, in our opinion, might be entered as an order.
Since it is impossible to synchronize target prices and stop-loss levels for all the ETFs and ETNs with the main markets that we provide these levels for (gold, silver and mining stocks - the GDX ETF), the stop-loss levels and target prices for other ETNs and ETF (among other: UGL, GLL, AGQ, ZSL, NUGT, DUST, JNUG, JDST) are provided as supplementary, and not as "final". This means that if a stop-loss or a target level is reached for any of the "additional instruments" (GLL for instance), but not for the "main instrument" (gold in this case), we will view positions in both gold and GLL as still open and the stop-loss for GLL would have to be moved lower. On the other hand, if gold moves to a stop-loss level but GLL doesn't, then we will view both positions (in gold and GLL) as closed. In other words, since it's not possible to be 100% certain that each related instrument moves to a given level when the underlying instrument does, we can't provide levels that would be binding. The levels that we do provide are our best estimate of the levels that will correspond to the levels in the underlying assets, but it will be the underlying assets that one will need to focus on regarding the signs pointing to closing a given position or keeping it open. We might adjust the levels in the "additional instruments" without adjusting the levels in the "main instruments", which will simply mean that we have improved our estimation of these levels, not that we changed our outlook on the markets. We are already working on a tool that would update these levels daily for the most popular ETFs, ETNs and individual mining stocks.
Our preferred ways to invest in and to trade gold along with the reasoning can be found in the how to buy gold section. Furthermore, our preferred ETFs and ETNs can be found in our Gold & Silver ETF Ranking.
As a reminder, Gold & Silver Trading Alerts are posted before or on each trading day (we usually post them before the opening bell, but we don't promise doing that each day). If there's anything urgent, we will send you an additional small alert before posting the main one.
Thank you.
Przemyslaw Radomski, CFA
Founder, Editor-in-chief

