Briefly: in our opinion, full (300% of the regular position size) speculative short positions in mining stocks are justified from the risk/reward point of view at the moment of publishing this Alert.
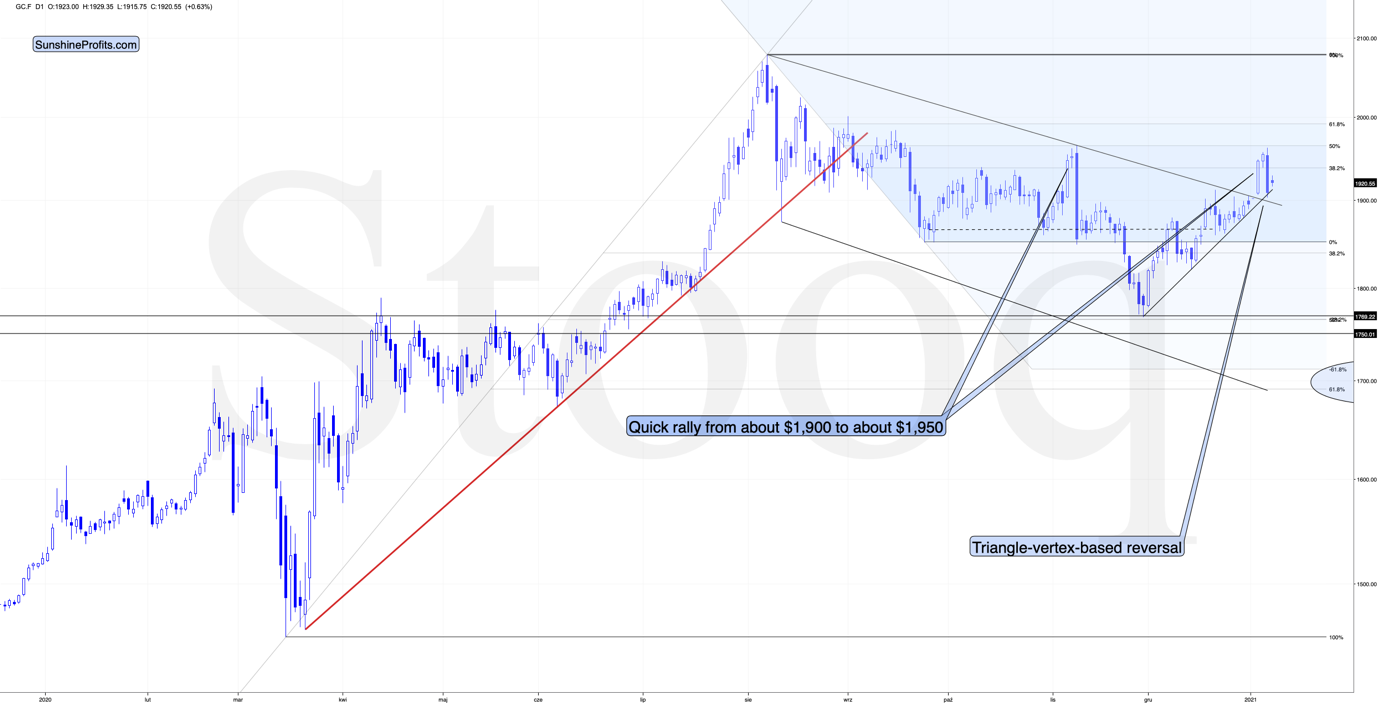
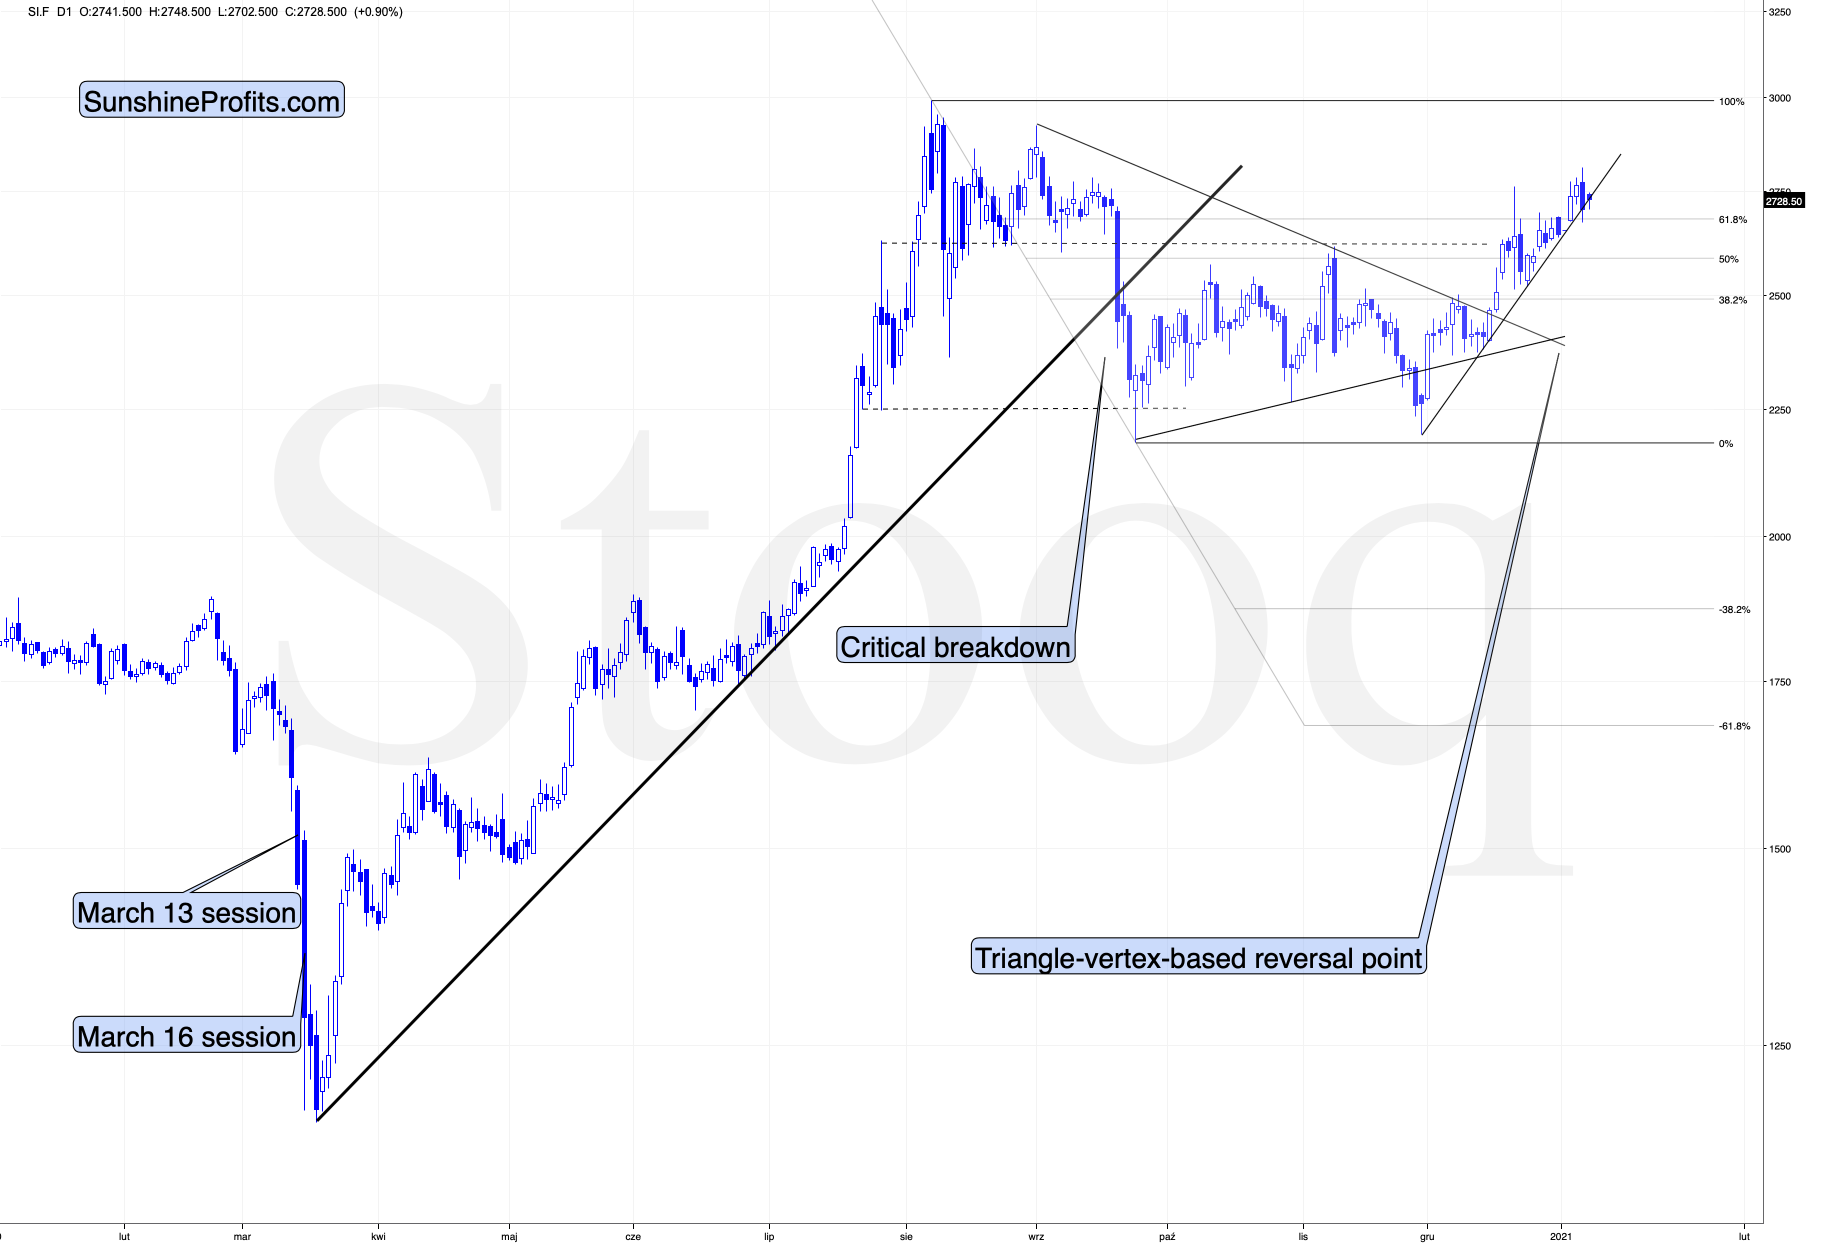
Gold was likely to top at its triangle-vertex-based reversal, similarly to what it did in November, and that’s exactly what happened.
Figure 1 - COMEX Gold Futures
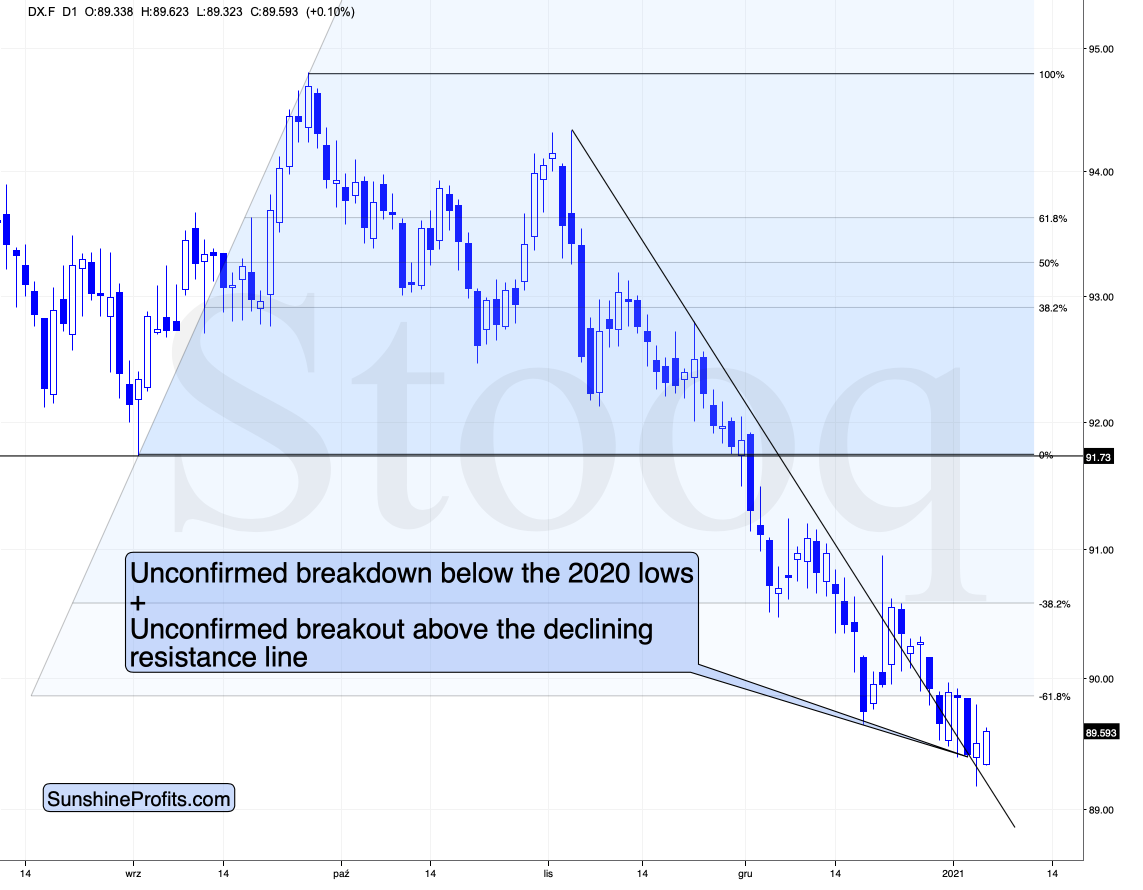
The daily slide was not as big as the one we saw in early November, but the rally in the USD Index was also not as big as the one in early November.
Figure 2 - USD Index
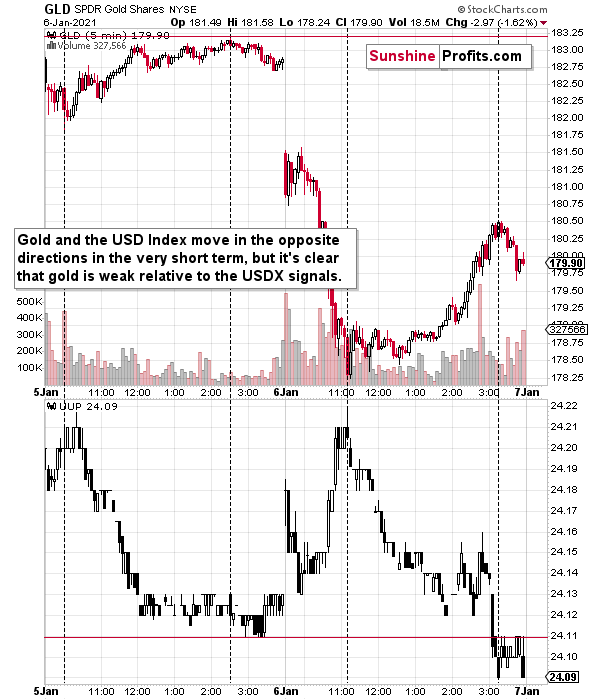
In fact, the USD Index closed yesterday’s (Jan. 6) session just slightly higher in terms of the futures prices, and it actually closed slightly lower in ETF terms (UUP ETF in this case).
Figure 3 - SPDR Gold Shares (GLD) and Invesco DB US Dollar Index Bullish Fund (UUP)
Comparing both ETFs with identical opening and closing hours, we see how closely gold was reacting to moves in the U.S. currency, but at the same time how it was magnifying the USD’s rallies (by declining more) and how it was mostly ignoring the USD’s declines (by rallying less).
Ultimately, the UUP ETF ended yesterday’s session slightly below the Jan. 5 closing price, and the GLD ETF didn’t end above its Jan. 5 closing price. Conversely, it didn’t even manage to erase half of the intraday decline before the closing bell.
The above tells us that if the USD Index rallies more visibly here and breaks above the declining resistance line in a decisive manner, gold would be likely to truly plunge.
And that’s exactly what’s likely to happen! The USD Index is extremely oversold and just a little strength here will allow it to break above the steep resistance line.
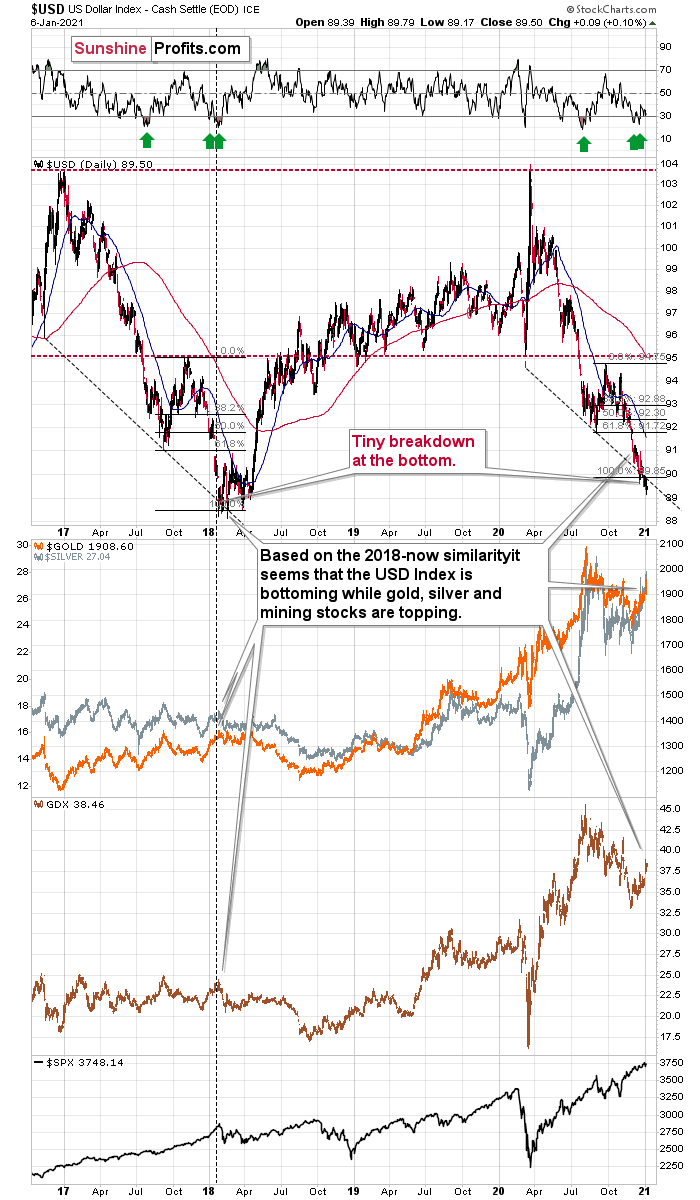
Figure 4 -USD Index (ICE), USD, GOLD, GDX, and SPX Comparison
With the situation looking just like it did in early 2018, it seems that the USD index is bottoming, and the precious metals sector is topping.
The USD Index is slightly below the Fibonacci-extension-based target based on the size of the most recent corrective upswing and the declining dashed resistance line. The same situation in 2018 (also please note that cryptocurrencies are in a price bubble now just like they were in early 2018) meant that the final bottom was already in. The situation in the RSI indicator is similar as well.
Let’s get back to gold.
Figure 5 - COMEX Gold Futures
Please note that after topping at its triangle-vertex-based reversal, gold then declined but stopped at its rising support line.
Figure 6 - COMEX Silver Futures
Silver did pretty much the same thing.
They both stopped where they were likely to stop, which is quite normal. The USD Index didn’t rally yet in a particularly visible way and the UUP ETF even declined somewhat yesterday. But the day when the PMs are going to get a significant push lower is coming. It’s likely very, very close. And then, once gold and silver break below their rising support lines, we’ll see significantly lower prices.
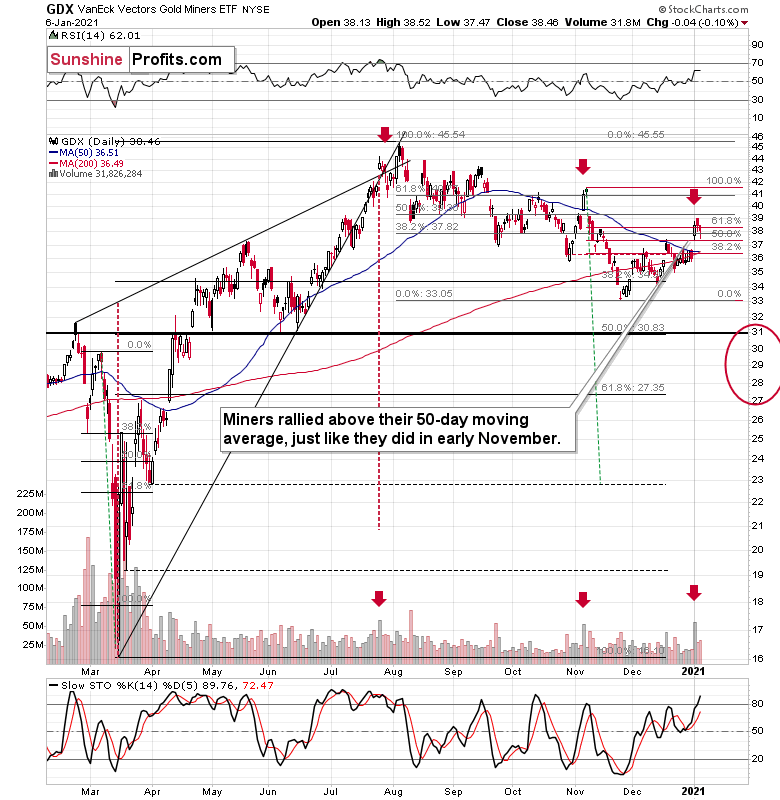
Figure 7 - VanEck Vectors Gold Miners ETF (GDX) and Slow Stochastic Oscillator (Slow STO) comparison
Mining stocks moved somewhat lower yesterday, but the decline was relatively small at first sight. Are miners showing strength here?
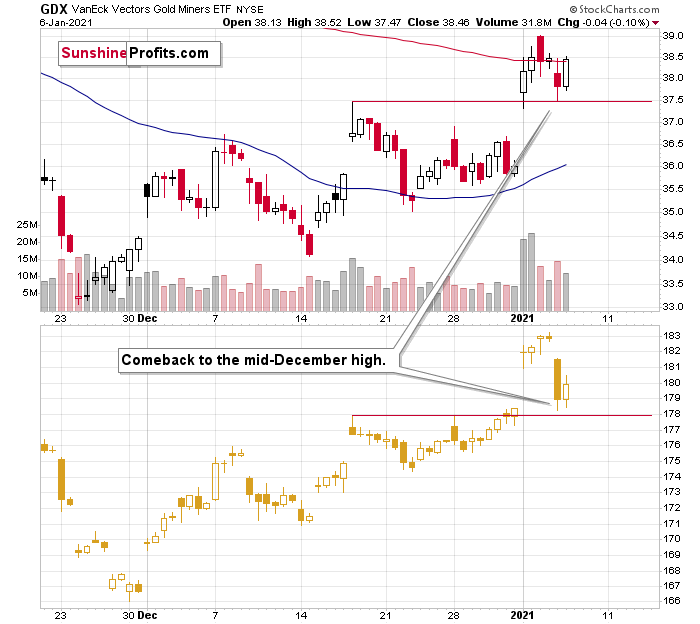
Let’s take one more look at the GDX while comparing it with the GLD ETF so that they both have the same opening and closing hours.
Figure 8 - GDX and GLD ETFs comparison
As you can see, both ETFs have actually moved to their mid-December highs and then moved back up yesterday. The GDX corrected a bit more of the daily decline, but nothing more.
What seems like a show of strength is more of an intraday price noise. If this persists and miners hold up well despite gold’s declines, it might be a bullish indication, but it’s way too early to draw bullish conclusions from miners’ performance.
The spike in volume in the GDX ETF that we saw recently continues to emphasize the similarity between the recent top, the November top, and the late-July top. The implications remain bearish.
Yielding to Pressure
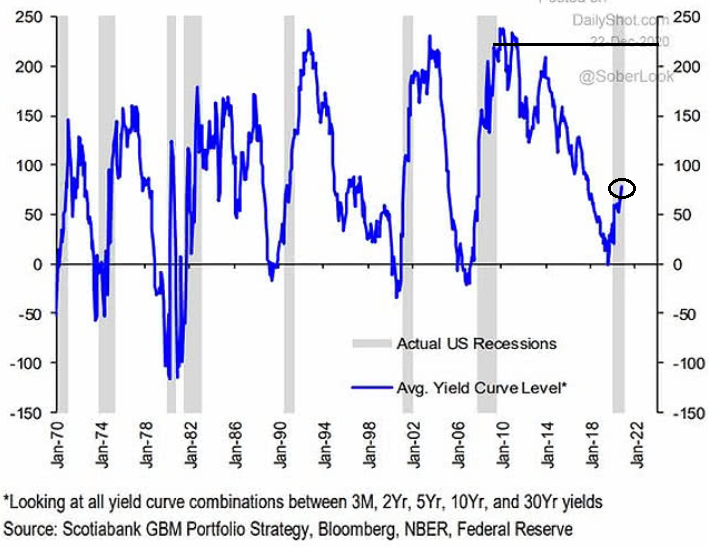
On Dec. 28, I warned that nominal interest rates could become a thorn in gold’s side. With the average U.S. Treasury yield peaking at more than 200 basis points (2.00%) during the 2008 financial crisis, 75 basis points (0.75%) was unlikely to be the COVID-19 top.
I wrote:
Despite real interest rates inching lower, nominal interest rates (the yields listed on various government bonds) could be a sleeping giant.
Please see the chart below:
Figure 9 - U.S. recessions and U.S. Treasury yield
If the average U.S. Treasury yield repeats its historical pattern, then nominal interest rates have plenty of room to move higher. And following right along, they will lift real yields in the process (unless the expected inflation rate swells, which is unlikely). The potential development is extremely bearish for gold, because it decreases gold’s attractiveness relative to government bonds.
And what happened yesterday?
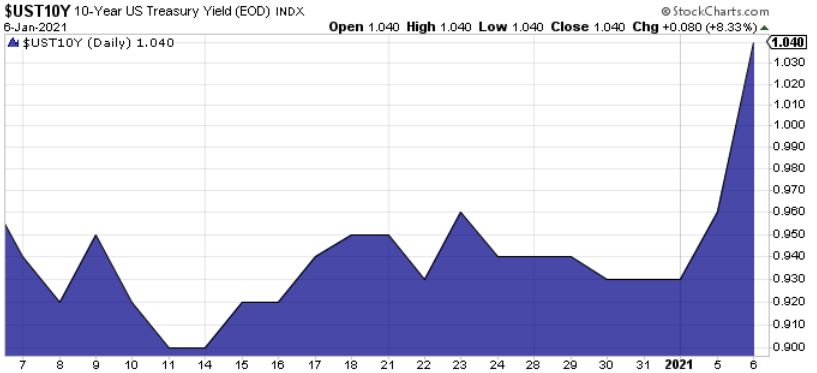
Well, the U.S. 10-Year yield surged by more than 8 basis points to its highest level (1.04%) since Mar. 5.
Please see the chart below:
Figure 10 - 10-year U.S. Treasury Yield Index
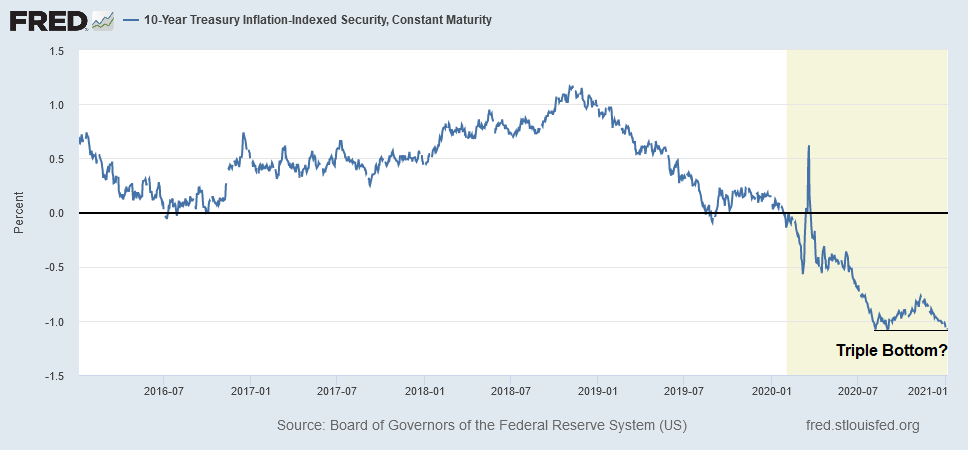
Not far behind, the U.S. 10-Year real yield rose by 1 basis point (0.01%) on Jan. 5 (FRED data is delayed by one day, so after yesterday’s spike in nominal yields, the 10-year real yield is likely even higher).
Figure 11 - U.S. 10-year Real Yield
Like I predicted, Wednesday’s rising rate rampage was met with jeers from gold investors. After plunging by more than 2% intraday, the yellow metal ended Wednesday’s session down by more than 1.60%. And if the bond market sell-off continues, gold’s recent strength will likely evaporate.
For context, the U.S. 10-Year real yield bottomed at – 1.08% on Aug. 6, Aug. 31 and Jan. 4. However, after awakening from its slumber on Jan. 5, another rally in real yields will reduce gold’s relative attractiveness.
I wrote on Dec. 28:
When real yields are negative (meaning the expected inflation rate is greater than the nominal interest rate), it’s bullish for gold, because the yellow metal offers a higher potential return than owning government bonds. Conversely, when real yields are positive (or become less negative), the opposite occurs.
Yesterday, Georgia’s runoff elections also provided a big boost to Democrats. With Jon Ossoff and Raphael Warnock projected to win their prospective Senate races, the victories would give Democrats control of the White House, Congress and the Senate.
Creating a political nirvana for gold, the trifecta would allow Joe Biden and his administration to fast-track COVID-19 relief and increase fiscal spending beyond the already bloated levels.
So then why is gold sputtering?
Well, essentially, it’s yielding to pressure: if nominal interest rates rise faster than inflation expectations, it’s a net-negative for gold. Thus, if the U.S. 10-Year yield continues its 2021 ascension, gold will likely find itself heading in the opposite direction. Of course, all the technical reasons discussed above and in the previous days as well as the situation in the USD Index remain very important as well.
The Growing Disconnect
Let’s put together an S&P 500 checklist:
- Record-high margin debt.
- The third-highest trailing P/E in the last ~100 years (exceeded only in 1921 and 1999).
- A trailing P/E (25x) that’s 67% higher than its historical average (15).
- Inflows into leveraged-long ETFs that are either near or exceed all-time highs.
- Option Gamma (21-day moving average) at the top 0.37% all-time and only equalled or exceeded nine other times in history.
Feel like investing yet?
Warren Buffett once said, “Nothing sedates rationality like large doses of effortless money.”
And in 2021, it could be easy come, easy go.
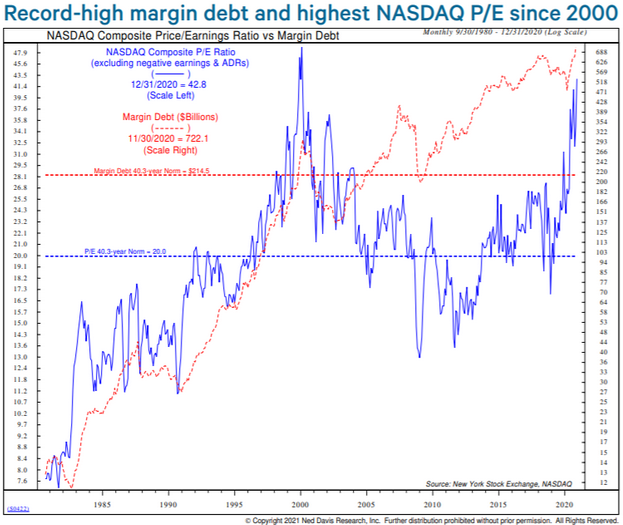
One-upping its S&P 500 counterpart, the NASDAQ ended 2020 with its highest P/E since the dot-com bubble.
Please see below:
Figure 12 - NASDAQ Price/Earnings Ratio vs Margin Debt Comparison (Source: Ned Davis Research)
To explain, the blue line depicts the NASDAQ’s historical P/E dating back to 1980. Over the last ~40 years, the ratio has averaged 20x. And today? Well, it’s at ~43x – a 114% premium to its historical average (For context, the red line depicts record-high monthly margin debt; but I’ve discussed the data point and its implications in previous publications.)
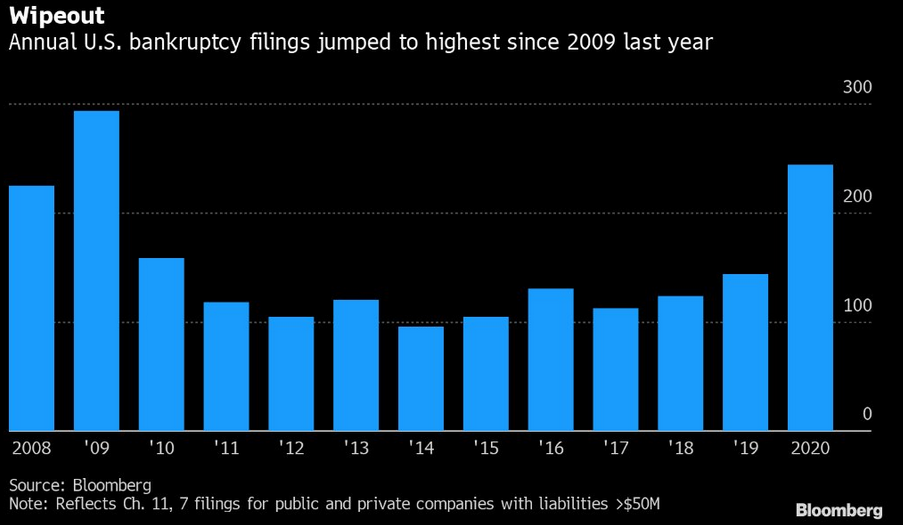
Amid the surging multiples and investor euphoria, 2020 also delivered the most corporate bankruptcies (with liabilities greater than $50 million) since 2009.
Please see below:
Figure 13 – U.S. corporate bankruptcies 2008-2020
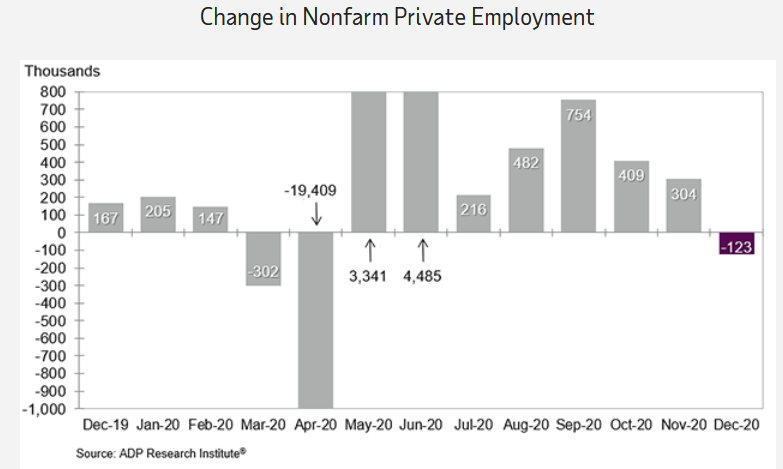
If that wasn’t enough, the Automatic Data Processing’s (ADP) National Employment Report (released yesterday), revealed that private-sector employment decreased by 123,000 jobs (from November to December) – the first monthly decline since lockdowns were instituted in March.
Please see below:
Figure 14 - Changes in non-farm private payroll employment rates
Furthermore, economists surveyed by Dow Jones predicted that the U.S. economy would add 60,000 jobs – a miss of 183,000.
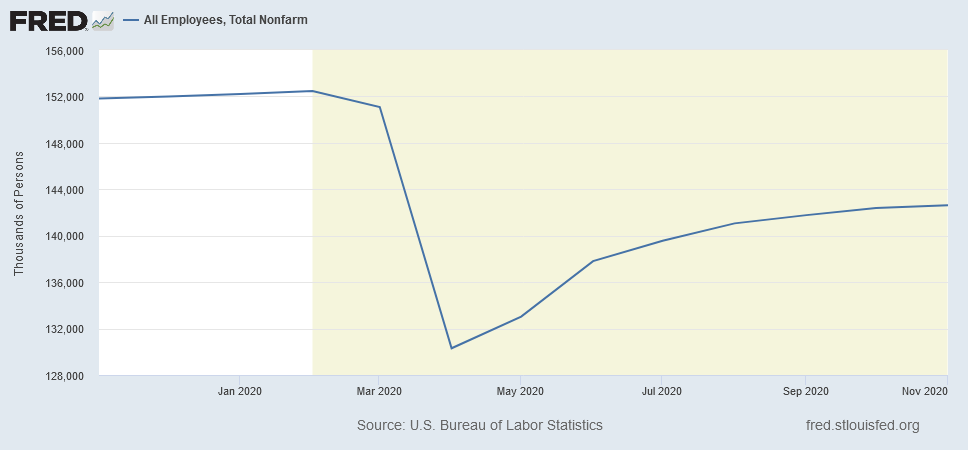
In addition, since coronavirus-induced layoffs peaked at ~22 million in April, the U.S. economy has recovered just over half of the jobs lost.
Please see below:
Figure 15 - Total non-farm employees in U.S.
In February, there were ~152 million people employed in the U.S. (under this tally). In April, that number fell to ~130 million (a decline of ~22 million). As of Dec. 4, total U.S. employees sits at ~142 million – roughly 12 million above the April bottom, but still 10 million below the February peak.
More importantly, the St. Louis Federal Reserve says these people are “approximately 80 percent of the workers who contribute to the Gross Domestic Product (GDP).”
Thus, with private payrolls turning negative, bankruptcies surging, and 10 million workers still unemployed, are record valuations warranted?
The bottom line is that things aren’t as rosy as they appear. And when reality finally engulfs equities, the precious metals will feel the burn – at least initially, just as we saw in 2008 and and in March 2020. Remember, the ‘buy everything’ mantra has also infected gold, silver and the gold miners. And once the match is lit, the metals will likely go up in smoke. They will rise back from the ashes like a Phoenix, but not until burning / declining first.
Overview of the Upcoming Decline
- As far as the current overview of the upcoming decline is concerned, I think it has already begun.
- During the final part of the slide (which could end within the next 1-10 weeks or so), I expect silver to decline more than miners. That would align with how the markets initially reacted to the COVID-19 threat.
- The impact of all the new rounds of money printing in the U.S. and Europe on the precious metals prices is incredibly positive in the long run, which does not make the short-term decline improbable. Markets can and will get ahead of themselves and decline afterward – sometimes very profoundly – before continuing with their upward climb.
- The plan is to exit the current short positions in miners after they decline far and fast, but at the same time, silver drops just “significantly” (we expect this to happen in 1 – 5 weeks ). In other words, the decline in silver should be severe, but the decline in the miners should look “ridiculous”. That’s what we did in March when we bought practically right at the bottom . It is a soft, but simultaneously broad instruction, so additional confirmations are necessary.
- I expect this confirmation to come from gold, reaching about $1,700 - $1,750 . If – at the same time – gold moves to about $1,700 - $1,750 and miners are already after a ridiculously big drop (say, to $31 - $32 in the GDX ETF – or lower), we will probably exit the short positions in the miners and at the same time enter short positions in silver. However, it could also be the case that we’ll wait for a rebound before re-entering short position in silver – it’s too early to say at this time. It’s also possible that we’ll enter very quick long positions between those short positions.
- The precious metals market's final bottom is likely to take shape when gold shows significant strength relative to the USD Index . It could take the form of a gold’s rally or a bullish reversal, despite the ongoing USD Index rally.
Summary
Summing up, the situation on the precious metals market is not as bullish as it might appear based on Monday’s (Jan. 4) session alone. The triangle-vertex-based reversals in gold and silver along with huge volume spike in the GDX ETF and other technical signs, were pointing to a top and it seems that it’s exactly what we saw.
The USD Index and cryptocurrencies suggest that we’re seeing the repeat of early 2018, when the USD Index bottomed. Given the current correlations between PMs and the USD Index, the rally in the USDX is likely to have very bearish implications for the precious metals market.
The USD Index’s reversal yesterday suggests that PMs and miners are about to get a bearish push, and we might get exactly the same thing from the general stock market.
Despite a recent decline, it seems that the USD Index is going to move higher in the following months and weeks, in turn causing gold to decline. At some point gold is likely to stop responding to dollar’s bearish indications, and based on the above analysis, it seems that this is already taking place.
Naturally, everyone's trading is their responsibility. But in our opinion, if there ever was a time to either enter a short position in the miners or increase its size if it was not already sizable, it's now. We made money on the March decline, and on the March rebound, with another massive slide already underway.
After the sell-off (that takes gold to about $1,700 or lower), we expect the precious metals to rally significantly. The final decline might take as little as 1-5 weeks, so it's important to stay alert to any changes.
Most importantly, please stay healthy and safe. We made a lot of money on the March decline and the subsequent rebound (its initial part) price moves (and we'll likely earn much more in the following weeks and months), but you have to be healthy to enjoy the results.
As always, we'll keep you - our subscribers - informed.
To summarize:
Trading capital (supplementary part of the portfolio; our opinion): Full speculative short positions (300% of the full position) in mining stocks is justified from the risk to reward point of view with the following binding exit profit-take price levels:
Senior mining stocks (price levels for the GDX ETF): binding profit-take exit price: $32.02; stop-loss: none (the volatility is too big to justify a SL order in case of this particular trade); binding profit-take level for the DUST ETF: $28.73; stop-loss for the DUST ETF: none (the volatility is too big to justify a SL order in case of this particular trade)
Junior mining stocks (price levels for the GDXJ ETF): binding profit-take exit price: $42.72; stop-loss: none (the volatility is too big to justify a SL order in case of this particular trade); binding profit-take level for the JDST ETF: $21.22; stop-loss for the JDST ETF: none (the volatility is too big to justify a SL order in case of this particular trade)
For-your-information targets (our opinion; we continue to think that mining stocks are the preferred way of taking advantage of the upcoming price move, but if for whatever reason one wants / has to use silver or gold for this trade, we are providing the details anyway. In our view, silver has greater potential than gold does):
Silver futures downside profit-take exit price: unclear at this time - initially, it might be a good idea to exit, when gold moves to $1,703.
Gold futures downside profit-take exit price: $1,703
Long-term capital (core part of the portfolio; our opinion): No positions (in other words: cash
Insurance capital (core part of the portfolio; our opinion): Full position
Whether you already subscribed or not, we encourage you to find out how to make the most of our alerts and read our replies to the most common alert-and-gold-trading-related-questions.
Please note that we describe the situation for the day that the alert is posted in the trading section. In other words, if we are writing about a speculative position, it means that it is up-to-date on the day it was posted. We are also featuring the initial target prices to decide whether keeping a position on a given day is in tune with your approach (some moves are too small for medium-term traders, and some might appear too big for day-traders).
Additionally, you might want to read why our stop-loss orders are usually relatively far from the current price.
Please note that a full position doesn't mean using all of the capital for a given trade. You will find details on our thoughts on gold portfolio structuring in the Key Insights section on our website.
As a reminder - "initial target price" means exactly that - an "initial" one. It's not a price level at which we suggest closing positions. If this becomes the case (like it did in the previous trade), we will refer to these levels as levels of exit orders (exactly as we've done previously). Stop-loss levels, however, are naturally not "initial", but something that, in our opinion, might be entered as an order.
Since it is impossible to synchronize target prices and stop-loss levels for all the ETFs and ETNs with the main markets that we provide these levels for (gold, silver and mining stocks - the GDX ETF), the stop-loss levels and target prices for other ETNs and ETF (among other: UGL, GLL, AGQ, ZSL, NUGT, DUST, JNUG, JDST) are provided as supplementary, and not as "final". This means that if a stop-loss or a target level is reached for any of the "additional instruments" (GLL for instance), but not for the "main instrument" (gold in this case), we will view positions in both gold and GLL as still open and the stop-loss for GLL would have to be moved lower. On the other hand, if gold moves to a stop-loss level but GLL doesn't, then we will view both positions (in gold and GLL) as closed. In other words, since it's not possible to be 100% certain that each related instrument moves to a given level when the underlying instrument does, we can't provide levels that would be binding. The levels that we do provide are our best estimate of the levels that will correspond to the levels in the underlying assets, but it will be the underlying assets that one will need to focus on regarding the signs pointing to closing a given position or keeping it open. We might adjust the levels in the "additional instruments" without adjusting the levels in the "main instruments", which will simply mean that we have improved our estimation of these levels, not that we changed our outlook on the markets. We are already working on a tool that would update these levels daily for the most popular ETFs, ETNs and individual mining stocks.
Our preferred ways to invest in and to trade gold along with the reasoning can be found in the how to buy gold section. Furthermore, our preferred ETFs and ETNs can be found in our Gold & Silver ETF Ranking.
As a reminder, Gold & Silver Trading Alerts are posted before or on each trading day (we usually post them before the opening bell, but we don't promise doing that each day). If there's anything urgent, we will send you an additional small alert before posting the main one.
Thank you.
Przemyslaw Radomski, CFA
Founder, Editor-in-chief


