

Briefly: In our opinion, small (50% of the regular size of the position) speculative short positions in gold, silver and mining stocks are justified from the risk/reward perspective at the moment of publishing this alert. In other words, we are substantially limiting the size of the short position. At the same time, we are increasing the stop-loss levels for the remaining part of the position.
The shocking scenario has become a reality – the USD Index broke below the 90 level. Moreover, in the final hours of yesterday’s session, mining stocks soared, outperforming gold and invalidating their earlier breakdown. These are all significantly bullish factors for the precious metals market. Changes in signals mean changes in outlook and thus a change in the trading position. How significant a change is justified given gold’s unstoppable rally?
First of all, gold’s rally may be unstoppable, but only for a while. Perhaps a very short while. Secondly, all changes that we’re seeing appear to be of short-term nature. The invalidation of the breakdown in the HUI Index and its outperformance are both very bullish factors, but only for the very short term.
The USD Index’s breakdown is significant, but… Extremely strong support levels are just around the corner and given the way the precious metals market has been reacting to the USD’s decline so far this year, it doesn’t seem that we should expect major fireworks from either gold or silver before they turn south.
Why? We’ll discuss details below respective charts, starting with the USD Index (chart courtesy of http://stockcharts.com).
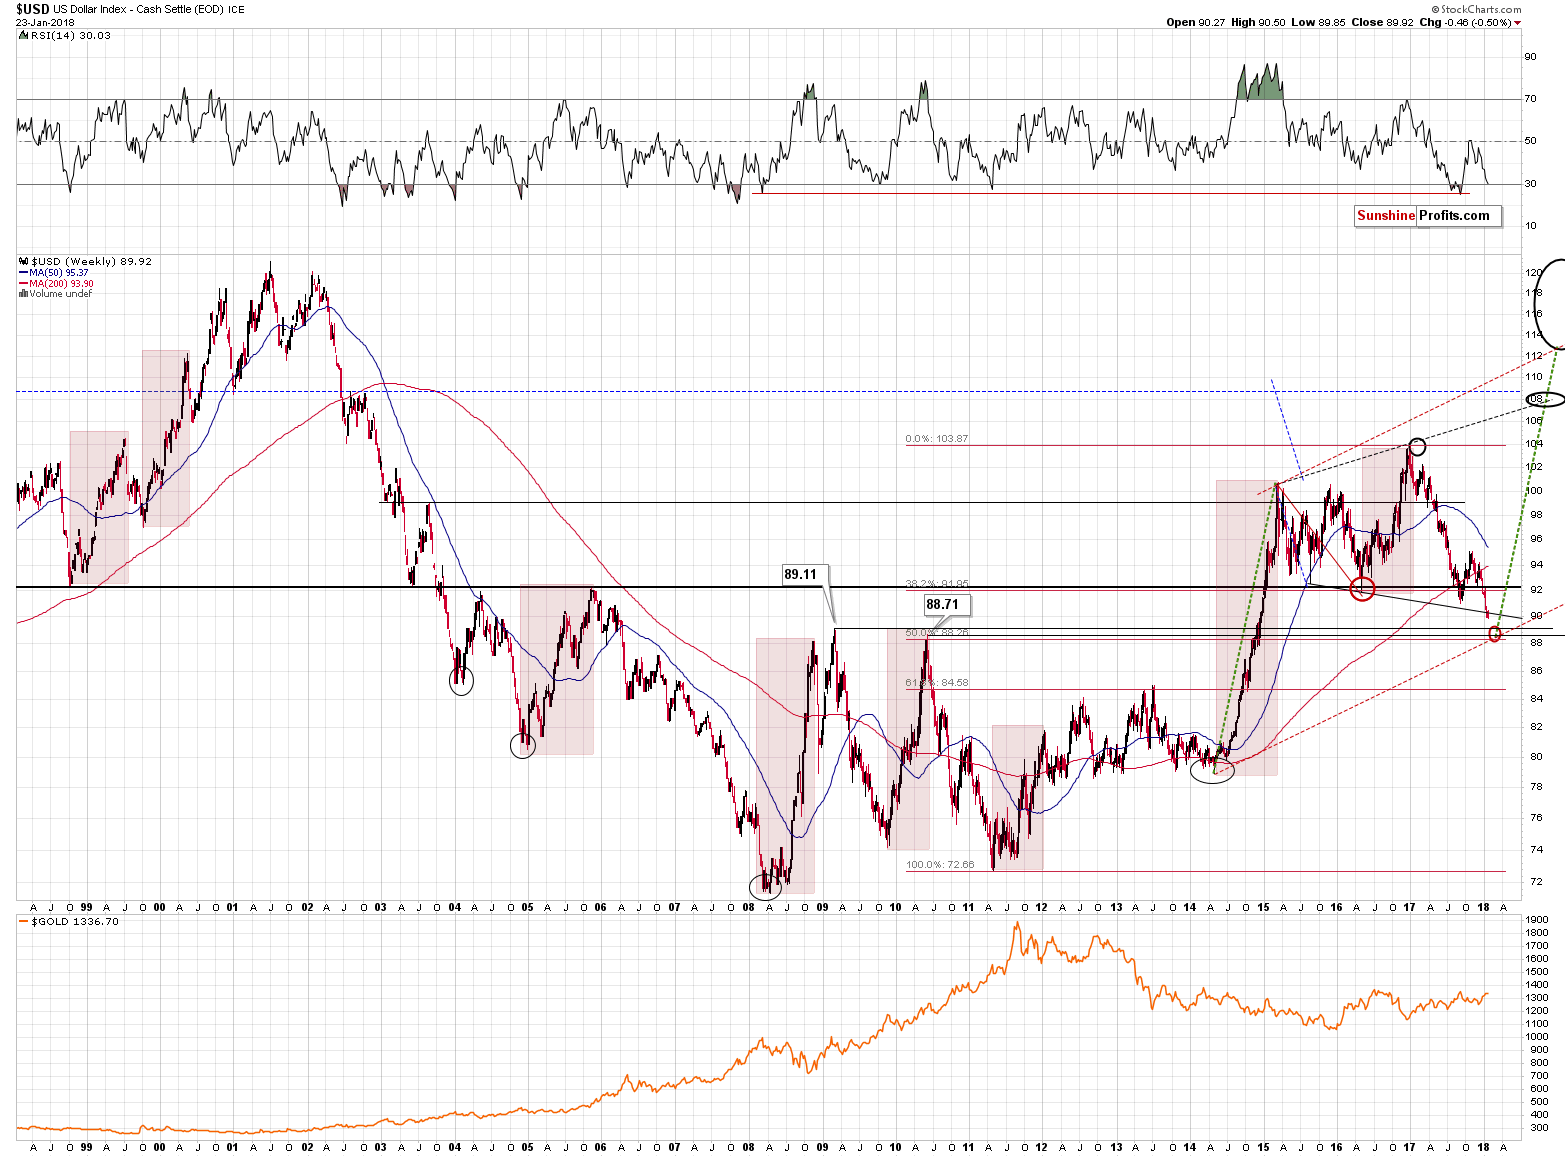
The USD Index moved to about 89.6 in today’s pre-market trading. The breakdown below the psychologically important 90 level and the declining black support line (currently at about 90.2) is a fact. It’s not confirmed, but it’s already quite substantial (0.4 below the lower of them), so it should already be taken into account as something important.
Assuming (it doesn’t have to be the case) that the breakdown will be confirmed and that the USD Index moves lower, the key question becomes: “How low is the USD likely to move?”
In the opening paragraphs of today’s analysis, we wrote that the USD Index was close to an extremely strong support. This is actually a combination of very important support levels. The first two are created based on the 2009 and 2010 tops and the final one is the 50% Fibonacci retracement level. The previous Fibonacci retracement worked very well, stopping USD declines in 2015 and 2016, so the 50% retracement is something very significant.
These support levels are at 89.11, 88.71 and 88.26. In other words, the highest thereof is just 0.49 below today’s pre-market low. Furthermore, it means that a major support will be reached if the USD only – approximately – repeats today’s decline. Reaching lower support levels would mean doubling or tripling today’s decline, respectively – again, approximately.
With gold up about $8 at the moment of writing these words, this means another $8 - $24 rally before the top is in. In other words, all the above makes likely is a move in gold to $1,357 - $1,373.
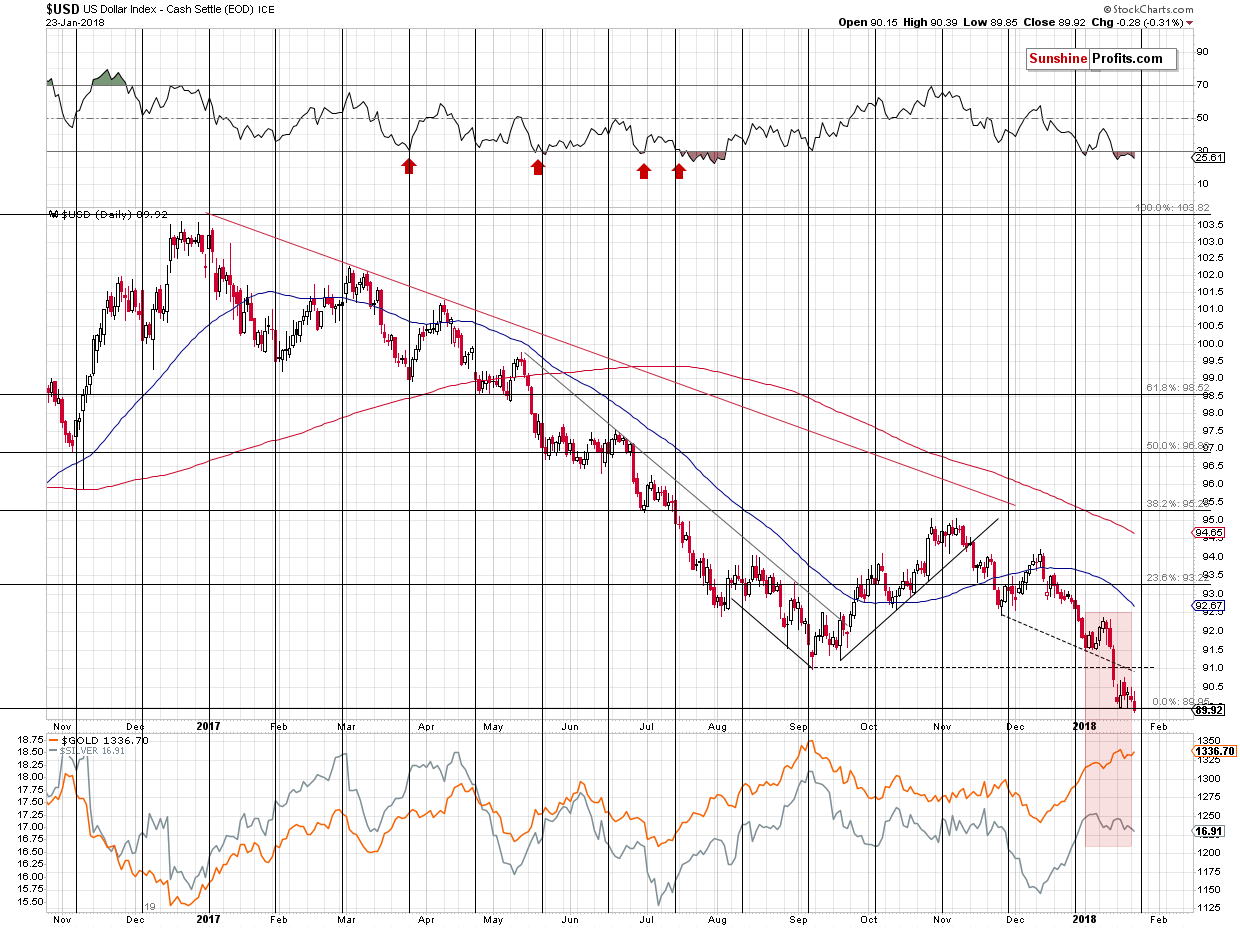
On the above short-term chart, you can see how gold and silver reacted to the USD’s 2-index-point decline that we’ve seen this year – gold rallied about $25. Keeping this way of reacting to the USD’s weakness, gold could simply move to $1,360 or so (the September high). Is this really a significant move higher?
Before translating the above (we’ll use the more bullish analogy of $1,357 - $1,373 as the target area) into an actionable suggestion, let’s consider a very important factor. It took a few hours of overnight trading for gold to move $8 higher and after the top gold could easily decline as fast or twice as fast. Consequently, by exiting the price now, we may not be able to get back on the short side of the market at better prices.
If gold already moves higher by $8 before this message reaches you and you are able to act on it and it’s at $1,357 at that time, then exiting the position means the possibility of “saving” on the additional $0 - $16 rally, but only if you assume that you’re able to get back into the short position right at the top. Realistically, if you wait for at least another $8 decline to be more certain that the reversal has taken place, you’d be re-entering the short position between $8 lower and $8 higher than the exit price. So, on average, you’d gain nothing from all the hassle of exiting and entering the position. Naturally, your broker will be very happy to charge you a commission for both trades, which makes it even worse on your end.
So, taking the above realistic scenario into account, is it prudent for one to close their position? The more short-term oriented you are and the more time you have to watch the market, the more sense it makes. Adjusting the position significantly makes sense for day-traders, but for those who want to catch the big fish, it’s not necessarily the case.
There is also an additional factor that’s worth considering that’s not visible on the charts. The ECB interest rate decision and the following press conference are scheduled for tomorrow morning. This means that during the next 24 hours or so, the tensions and uncertainty will be very high. Regardless of the decision and the announcement, the uncertainty will drop in the near future. This, in turn, means that any temporary or artificial move is likely to be reversed.
Yes, regardless of what’s going to happen, we simply could see the “buy the rumor, sell the fact” kind of reaction. We saw it many times in the past, for instance in the form of a declining USD right after the interest rate hike or a plunge in the price of silver after the introduction of the SLV ETF, which was supposed to be positive news for the silver market.
So, all that happened yesterday and what is happening today, and what might happen in the next 24 hours could be reversed in a flash after tomorrow’s European news.
Consequently, in light of the above, we are not closing the position entirely, we are simply limiting it.
Of course, all the above makes sense only if we keep the assumption that the next big move in the precious metals market is going to be down. And we are definitely keeping it. This week’s first two Gold & Silver Trading Alerts provided multiple reasons backing the above and nothing changed regarding them, so we only discuss several of them below (we don’t want to write an extremely long alert today as it seems to us that you’d prefer to get it sooner and there is a natural trade-off between the length of the analysis and the time in which we can prepare it).
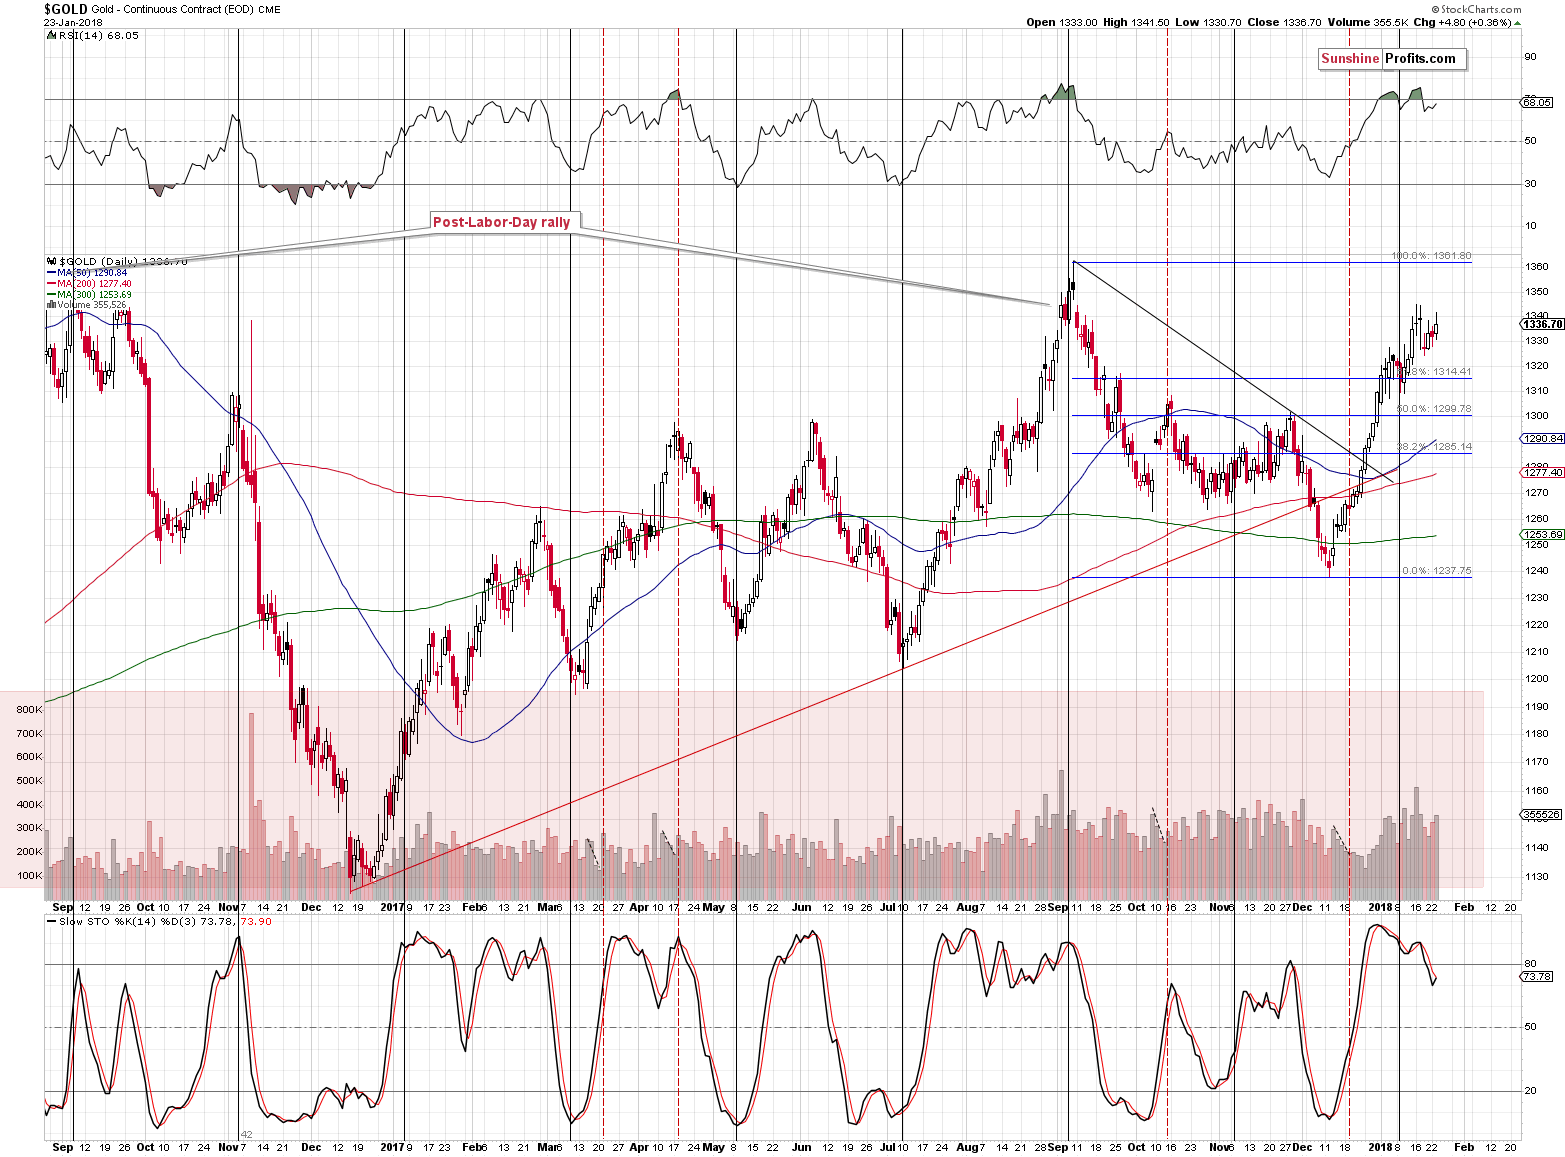
On the above chart, you can see that gold’s September high does indeed correspond very well with the target for the USD Index. If the USD keeps declining after reaching the highest of the support levels, we could see a temporary move above the September high in gold – a breakout that would very likely be invalidated shortly.
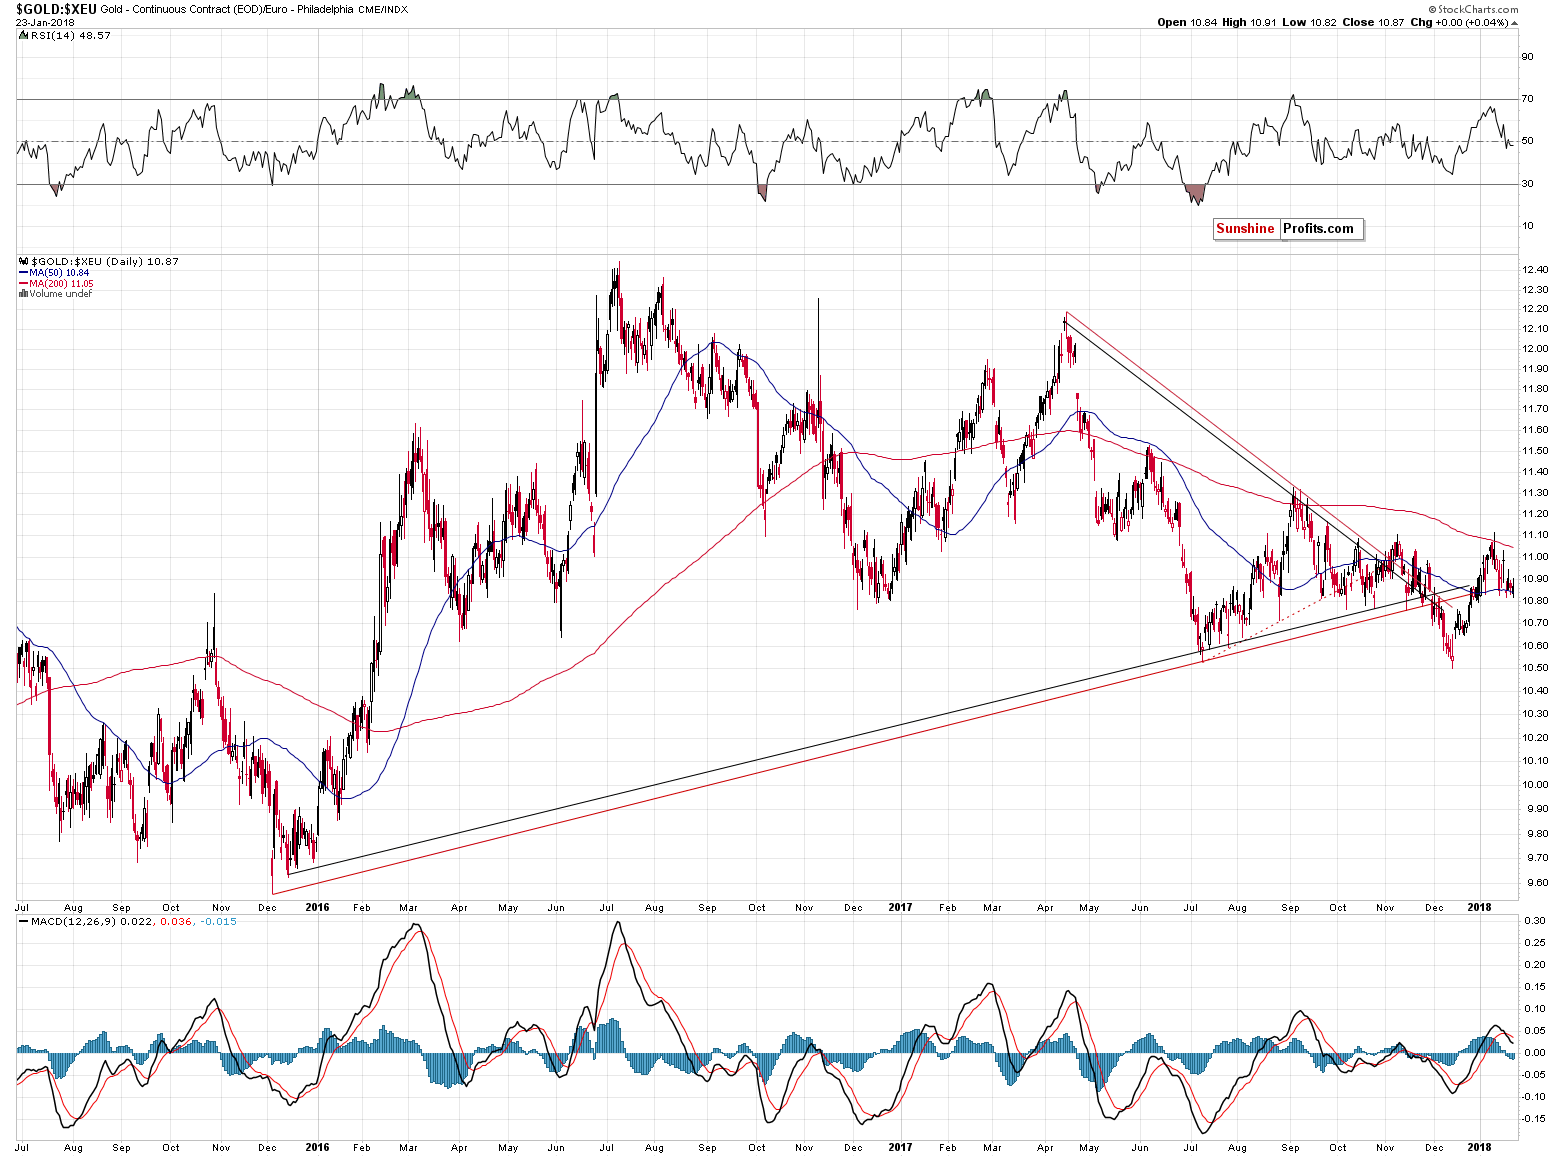
The above chart shows that this year’s strength in gold is only a USD phenomenon – gold actually declined in terms of the euro in 2018. That’s one of the signs strongly suggesting that the current upswing in gold from the USD perspective is something temporary and that the real move – lower – is just around the corner.
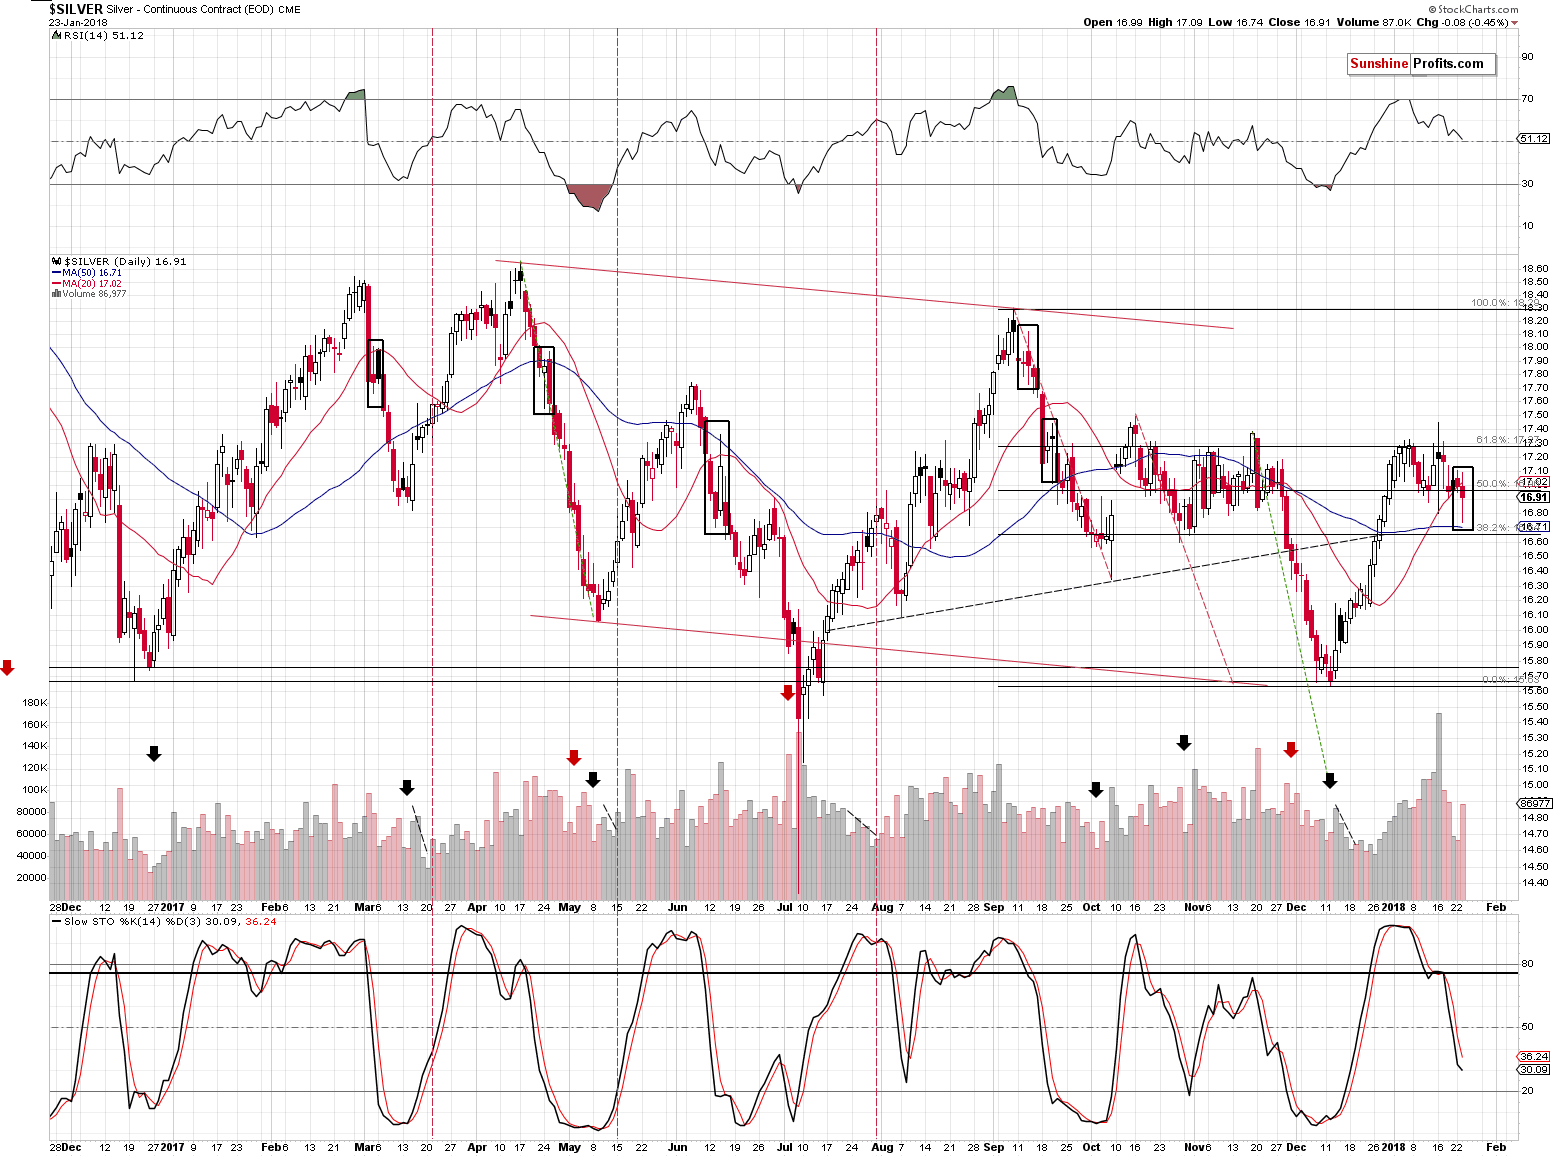
Silver is higher in today’s pre-market trading, but if we consider the sessions that already ended, we can spot an interesting analogy that plants a seed of doubt in the bullish outlook for gold in the short term.
You see, silver’s back and forth movement that looks like a reversal, but really isn’t one, is something that is normal in the early stages of silver’s declines. We marked similar sessions with black rectangles. Today’s rally is just a pre-market phenomenon so far and it could be easily invalidated. Two days of back and forth volatile movement are also something normal in the case of the white metal’s declines.
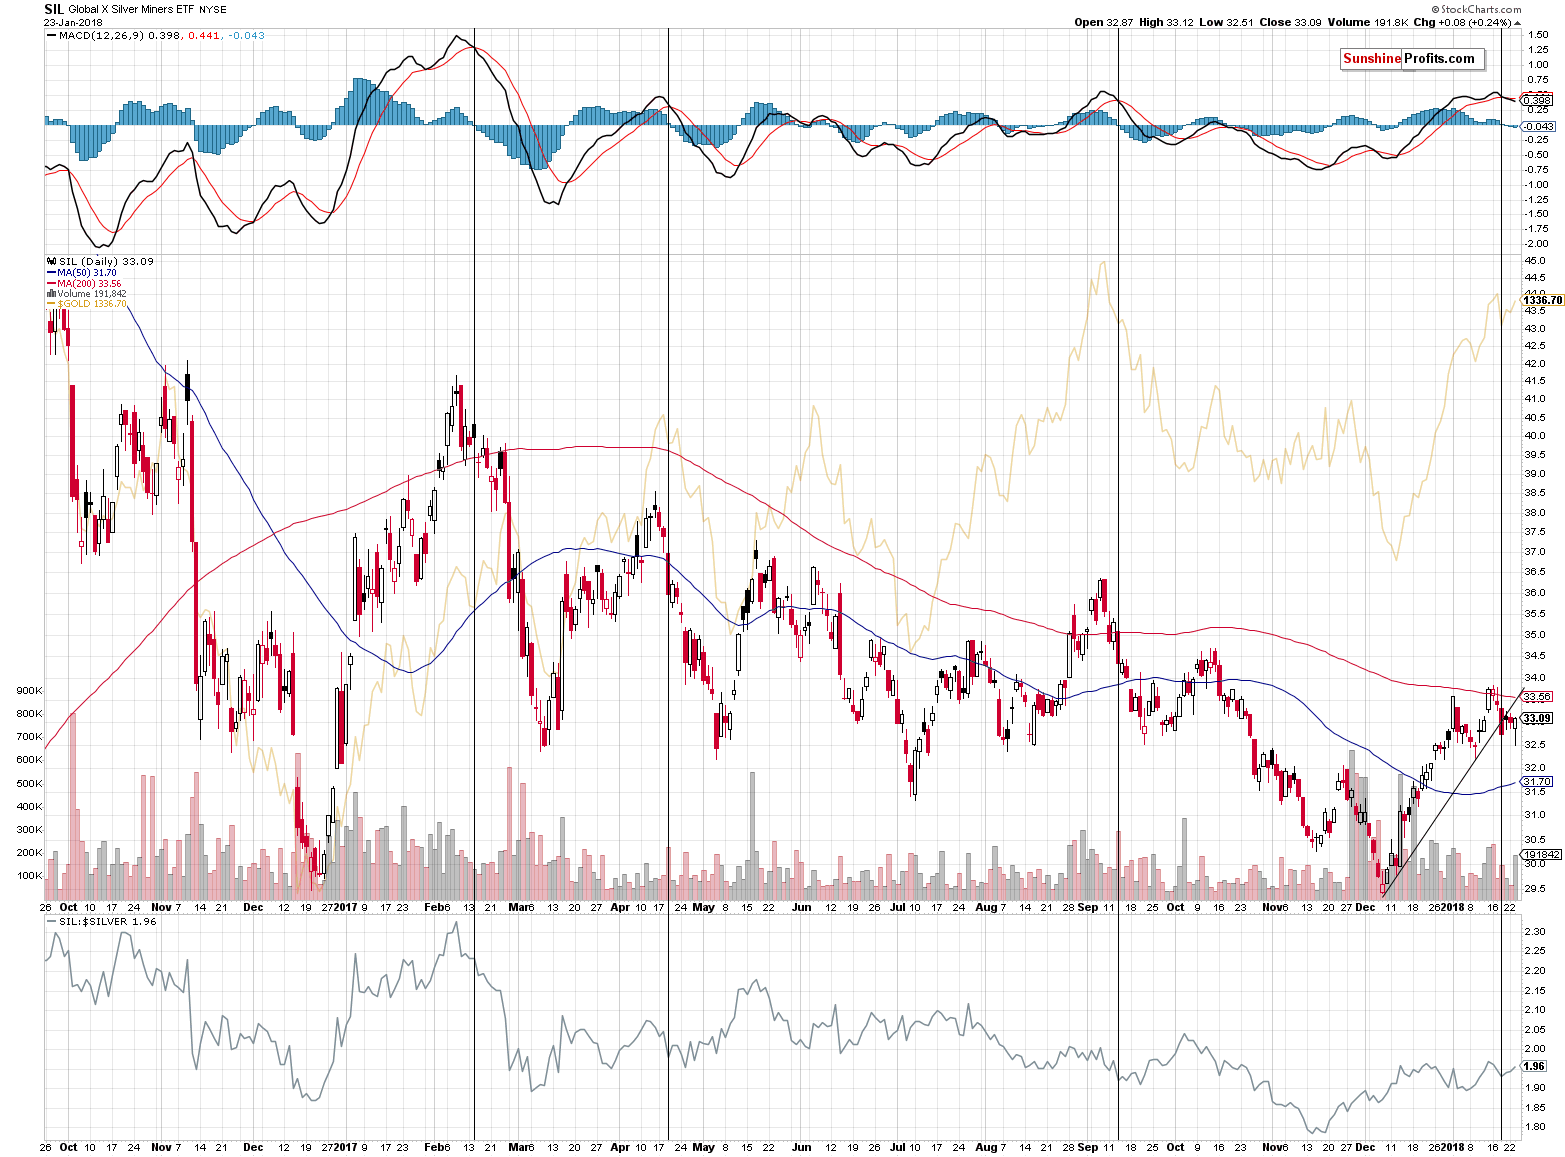
Interestingly, silver stocks were barely higher yesterday and they remain visibly below their rising resistance line. The breakdown below it was confirmed and its implications are bearish.
Moreover, we recently saw a sell signal from the MACD indicator, while both silver stocks and the indicator were after a visible rally. That’s something that took place only 3 times in the past 15 months. In each previous case, it was seen close to the top.
Precisely, in all 3 cases it was after the top in silver miners, and in 2 out of 3 cases it also confirmed that the top was already in in the case of gold. The remaining case took place in February 2017, when the signal was seen about 2 weeks before gold’s top.
While the above is not a precise sell signal for the very short term, it does indicate that the next big move is about to start relatively soon. It might already be underway in the case of silver stocks.
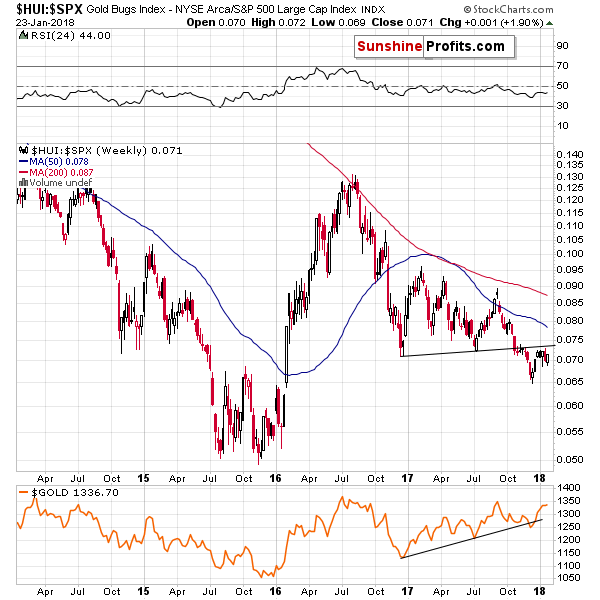
Let’s keep in mind that even though the mining stocks’ strength was visible yesterday, it’s only a small blip on the radar screen from the long-term point of view. Comparing it to the performance of other stocks provides us with bearish implications as the HUI to S&P 500 ratio remains well below the rising resistance line that’s based on the late-2016 and 2017 lows. The breakdown below it was verified and its bearish medium-term implications remain in place.
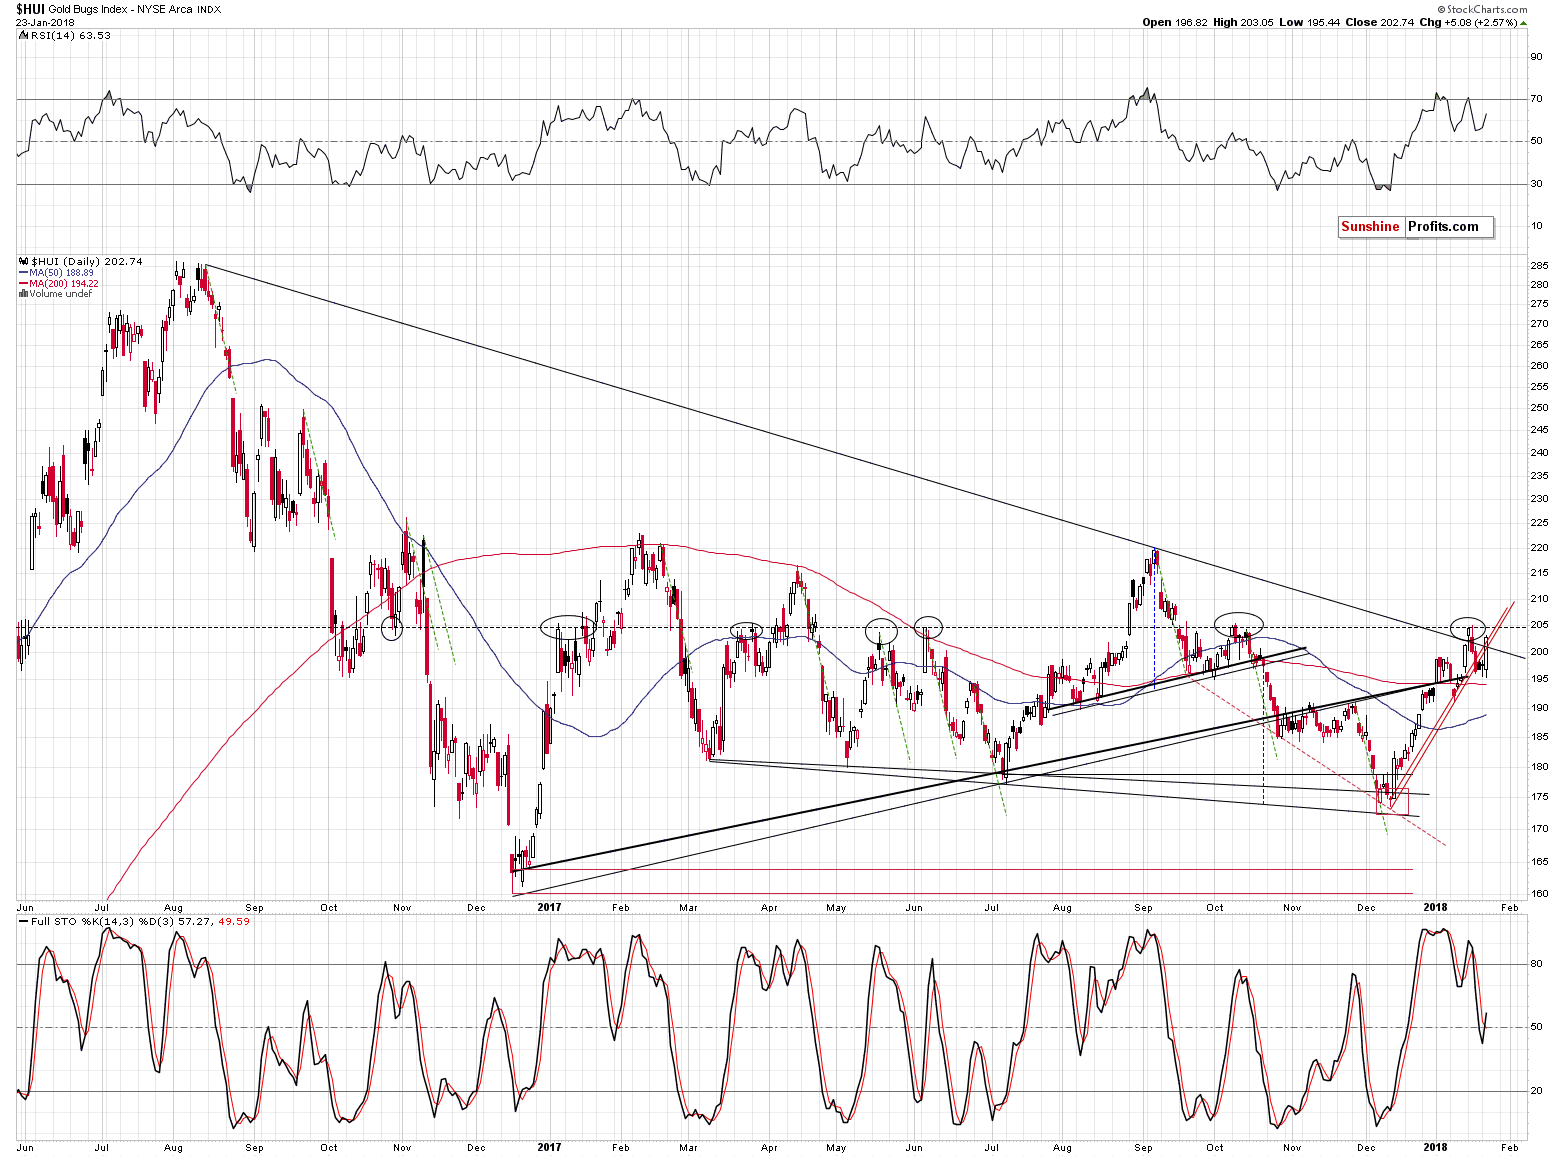
Again, on the short-term chart, the situation improved, but the bullish implications of the HUI’s strength relative to gold and its ability to invalidate the breakdown below the rising red support lines do not extent above the very short term.
Another observation that’s worth noting is that the previous moves to the 205 level that we marked with black ellipses were quite often followed by a second – smaller – attempt to move higher. We can see the same thing in March, May, June and October. Lower prices followed, but not until we saw another small upswing toward the 205 level.
Did we just see something like that? It’s possible, but knowing that gold is already $8 up today, we can expect gold stocks to move higher today and thus to break above the 205 level. So, the bearish implications of the above can be invalidated shortly. Still, we wanted to let you know that this is also a pattern that’s currently in play. If, perhaps, metals reverse their course today and miners actually decline, then the above will serve as a great bearish confirmation.
Summing up, based on the USD’s visible breakdown below 90, we could temporarily see lower USD values and higher precious metals values. However, based on the strength of the metals’ reaction to the USD’s movement, it’s probable that gold will not rally very far and – being realistic about the possibility of making the trades – it’s not clear if adjusting the current position is a good way to go. This might be the case for day-traders but not for long-term-oriented people. We are taking something of an average of the above approaches and we are limiting the size of the current position, but we are not closing it entirely. We are also increasing the stop-loss levels for gold and silver.
By the way, we would like to thank you for being very understanding regarding the characteristic of our profession. Many investors and traders would demand certain outcomes of the trades immediately, but based on the messages that we continue to receive, we know that you understand how the market works.
It’s very encouraging to be certain that you know that while we can’t control the prices, we’re doing all that we can in the area that depends on us. It keeps us motivated to get up very early each day, research 100+ charts and out-of-the-box factors, write the analysis that’s as good as possible as fast as possible while keeping all emotions at bay and then to stay focused while monitoring the market during the session for any changes and black swans. It’s not easy, but thanks to your support and understanding, we know it’s all worth it.
Thank you.
As always, we will keep you – our subscribers – informed.
To summarize:
Trading capital (supplementary part of the portfolio; our opinion): Small short positions (50% of the full position) in gold, silver and mining stocks are justified from the risk/reward perspective with the following stop-loss orders and initial target price levels:
- Gold: initial target price: $1,218; stop-loss: $1,382; initial target price for the DGLD ETN: $53.98; stop-loss for the DGLD ETN $37.68
- Silver: initial target price: $14.63; stop-loss: $17.82; initial target price for the DSLV ETN: $33.88; stop-loss for the DSLV ETN $20.88
- Mining stocks (price levels for the GDX ETF): initial target price: $19.22; stop-loss: $26.14; initial target price for the DUST ETF: $39.88; stop-loss for the DUST ETF $19.78
In case one wants to bet on junior mining stocks' prices (we do not suggest doing so – we think senior mining stocks are more predictable in the case of short-term trades – if one wants to do it anyway, we provide the details), here are the stop-loss details and initial target prices:
- GDXJ ETF: initial target price: $27.82; stop-loss: $38.22
- JDST ETF: initial target price: $94.88 stop-loss: $37.78
Long-term capital (core part of the portfolio; our opinion): No positions (in other words: cash)
Insurance capital (core part of the portfolio; our opinion): Full position
Important Details for New Subscribers
Whether you already subscribed or not, we encourage you to find out how to make the most of our alerts and read our replies to the most common alert-and-gold-trading-related-questions.
Please note that the in the trading section we describe the situation for the day that the alert is posted. In other words, it we are writing about a speculative position, it means that it is up-to-date on the day it was posted. We are also featuring the initial target prices, so that you can decide whether keeping a position on a given day is something that is in tune with your approach (some moves are too small for medium-term traders and some might appear too big for day-traders).
Plus, you might want to read why our stop-loss orders are usually relatively far from the current price.
Please note that a full position doesn’t mean using all of the capital for a given trade. You will find details on our thoughts on gold portfolio structuring in the Key Insights section on our website.
As a reminder – “initial target price” means exactly that – an “initial” one, it’s not a price level at which we suggest closing positions. If this becomes the case (like it did in the previous trade) we will refer to these levels as levels of exit orders (exactly as we’ve done previously). Stop-loss levels, however, are naturally not “initial”, but something that, in our opinion, might be entered as an order.
Since it is impossible to synchronize target prices and stop-loss levels for all the ETFs and ETNs with the main markets that we provide these levels for (gold, silver and mining stocks – the GDX ETF), the stop-loss levels and target prices for other ETNs and ETF (among other: UGLD, DGLD, USLV, DSLV, NUGT, DUST, JNUG, JDST) are provided as supplementary, and not as “final”. This means that if a stop-loss or a target level is reached for any of the “additional instruments” (DGLD for instance), but not for the “main instrument” (gold in this case), we will view positions in both gold and DGLD as still open and the stop-loss for DGLD would have to be moved lower. On the other hand, if gold moves to a stop-loss level but DGLD doesn’t, then we will view both positions (in gold and DGLD) as closed. In other words, since it’s not possible to be 100% certain that each related instrument moves to a given level when the underlying instrument does, we can’t provide levels that would be binding. The levels that we do provide are our best estimate of the levels that will correspond to the levels in the underlying assets, but it will be the underlying assets that one will need to focus on regarding the signs pointing to closing a given position or keeping it open. We might adjust the levels in the “additional instruments” without adjusting the levels in the “main instruments”, which will simply mean that we have improved our estimation of these levels, not that we changed our outlook on the markets. We are already working on a tool that would update these levels on a daily basis for the most popular ETFs, ETNs and individual mining stocks.
Our preferred ways to invest in and to trade gold along with the reasoning can be found in the how to buy gold section. Additionally, our preferred ETFs and ETNs can be found in our Gold & Silver ETF Ranking.
As a reminder, Gold & Silver Trading Alerts are posted before or on each trading day (we usually post them before the opening bell, but we don't promise doing that each day). If there's anything urgent, we will send you an additional small alert before posting the main one.
=====
Latest Free Trading Alerts:
Earlier today, the greenback declined to the lowest level against the Swiss franc since mid-September 2017, which resulted in a small drop under the long-term support line. Is this a sign of bigger move to the downside or just a trap?
USD/CHF Under Long-term Support!
=====
Hand-picked precious-metals-related links:
PRECIOUS-Gold hits 4-month peak after U.S. welcomes weaker dollar
Gold price: ETF holdings jump to near 5-year high
Perth Mint plans gold-backed ETF listing on NYSE
Ethiopia could be sitting on one of world’s great untapped gold deposits
=====
In other news:
Dollar Woes Deepen as Stocks Edge Up; Gold Rises: Markets Wrap
Dollar slides on U.S. Mnuchin remarks, booming Europe
Trump Team at Davos Backs Weaker Dollar, Sharpens Trade War Talk
Exclusive: China's state-owned firms to face more mergers, bankruptcies
Brent crude eases after surprise rise in U.S. inventories
Powell taking over as Fed chairman at time of economic calm
=====
Thank you.
Sincerely,
Przemyslaw Radomski, CFA
Founder, Editor-in-chief, Gold & Silver Fund Manager
Gold & Silver Trading Alerts
Forex Trading Alerts
Oil Investment Updates
Oil Trading Alerts

