

Briefly: in our opinion, full (300% of the regular position size) speculative short positions in junior mining stocks are justified from the risk/reward point of view at the moment of publishing this Alert.
The USD Index has declined in recent days, but it doesn’t mean it lost its crown. With the EUR/USD rallying hard, the USDX suffered in the process – but in reality, the ECB hasn’t really done anything to support the euro.
Wall Street woke up to excessive pessimism on Feb. 3, with the NASDAQ Composite sinking by 3.74%. Moreover, with gold and silver also declining by 0.34% and 1.46% respectively, the volatility was unkind to the PMs.
More importantly, though, the GDXJ ETF declined by 2.43% and was easily the worst performer of the bunch. Actually, when you consider what I warned about previously, the price action was far from a surprise:
Once one realizes that the GDXJ is more correlated with the general stock market than the GDX is, the GDXJ should be showing strength here. If stocks don’t decline, the GDXJ is likely to underperform by just a bit, but when (not if) stocks slide, the GDXJ is likely to plunge visibly more than the GDX.
To that point, with the GDX ETF only declining by 1.24%, it’s another example of why shorting the GDXJ ETF offers the best risk-reward ratio. Moreover, while the USD Index remains under short-term pressure, a greenback comeback should add to the PMs’ troubles over the medium term.
Having said that, let's take a look at the situation from a fundamental point of view.
Hear What They Want to Hear: Part 2
With another ECB monetary policy meeting resulting in another bullish reaction from the EUR/USD, investors followed the same misguided script that I outlined on Oct. 29. To explain, I wrote:
With the EUR/USD rallying sharply on Oct. 28, the ECB must have accelerated the hawkish rhetoric, right? Well, in reality, the ECB maintained its dovish stance and the fundamental outlook for the EUR/USD remains unchanged.
However, because investors ‘hear what they want to hear,’ and speculators do what speculators do, the EUR/USD rallied on the news. I mean, why not speculate on a euro that’s been one of the worst-performing developed market currencies versus the U.S. dollar YTD? Couldn’t it catch fire and revert to the mean?
Well, with the same merry-go-round spinning for months, I warned on May 4 that euro celebrations often end in disappointment. I wrote:
With the EUR/USD rising on hope and falling on reality, history has shown that the latter is likely to reign supreme over the medium term.
To that point, with the medium-term extremely unkind to the EUR/USD, short-term bursts of optimism faded when reality re-emerged. As a result, is this time really different?
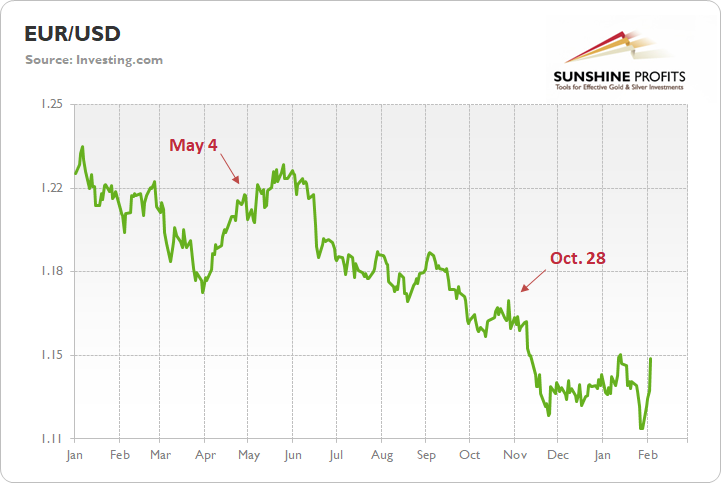
To explain, the green line above tracks the EUR/USD. If you analyze the misguided optimism present on May 4 and Oct. 28, you can see that we’ve been down this road before. Moreover, with the EUR/USD rallying six times following the last eight ECB monetary policy meetings, the price action is par for the course. However, the short-term surges haven’t stopped the EUR/USD from making lower lows in the following months.
To that point, what happened that got euro bulls so fired up? Well, as we witnessed throughout 2021, nothing. In reality, the ECB maintained its dovish stance, and monetary policy was left unchanged. The committee’s statement read:
“Monthly net purchases under the APP will amount to €40 billion in the second quarter of 2022 and €30 billion in the third quarter. From October onwards, the Governing Council will maintain net asset purchases under the APP at a monthly pace of €20 billion for as long as necessary to reinforce the accommodative impact of its policy rates. The Governing Council expects net purchases to end shortly before it starts raising the key ECB interest rates.”
As a result, while the Fed will end its bond-buying program and should raise interest rates at its March monetary policy meeting, the ECB still plans to continue QE from "October [2022] onwards." Thus, while currency traders attempt to time the bottom again, the fundamentals that led to a weaker euro in 2021 remain unchanged.
Moreover, during ECB President Christine Lagarde's press conference on Feb. 3, she said the following about inflation:
“Inflation increased to 5.1 per cent in January, from 5.0 per cent in December 2021. It is likely to remain high in the near term. Energy prices continue to be the main reason for the elevated rate of inflation. Their direct impact accounted for over half of headline inflation in January and energy costs are also pushing up prices across many sectors.”
To that point, I noted on Feb. 1 that while energy remains an issue, the majority of goods and services in the Eurozone are far from the danger zone. I wrote:
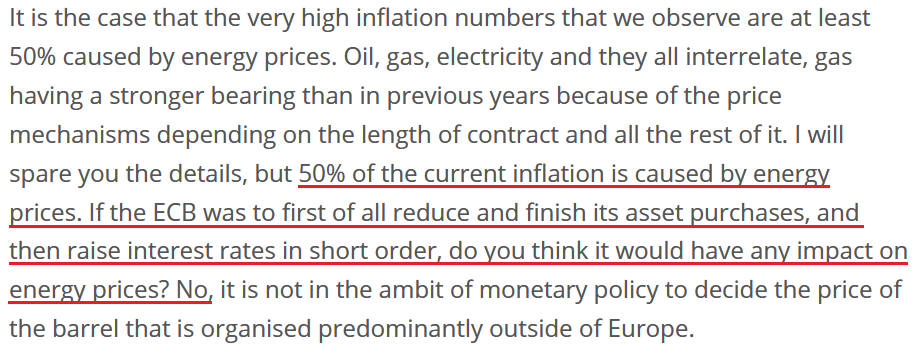
While I’ve highlighted the discrepancy on several occasions, the pricing pressures confronting Europe are mainly a function of oil & gas irregularities. Outside of that, most goods and services are within the ECB’s expected inflation range.
Think about it: why would the ECB raise interest rates when core inflation is at 2.7% YoY and wage inflation is at 2.3% YoY? In stark contrast, U.S. core inflation increased by 5.5% YoY on Jan. 12, and U.S. average hourly earnings increased by 4.7% YoY on Jan. 7. As such, while I’ve stated it on numerous occasions, the Fed and the ECB are worlds apart.
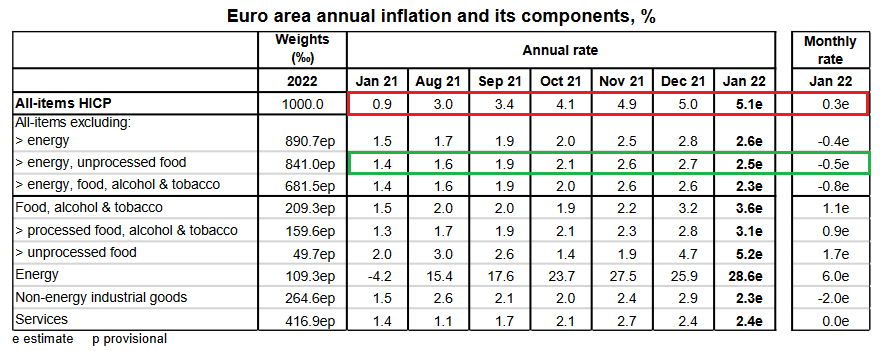
Furthermore, Eurostat – the statistical office of the European Union – released its latest inflation report on Feb. 2. And while headline inflation increased by 0.30% month-over-month (MoM), core inflation decreased by 0.5% MoM.
Please See below:
 Source: Eurostat
To explain, follow the trajectory of the red rectangle above. As you can see, headline inflation (which includes food and energy) went from a 0.9% year-over-year (YoY) increase in January 2021 to a 5.1% YoY increase in January 2022. Pretty troublesome, huh?
However, if you focus your attention on the green rectangle, you can see that Eurozone core inflation (which excludes food and energy) declined from 2.7% YoY in December 2021 to 2.5% YoY in January 2022. As a result, while investors assume that abnormally high headline inflation will elicit a hawkish response from the ECB, the reality is that oil & gas remain the region’s only problem.
Conversely, with core inflation falling MoM and moving closer to the ECB’s 2% annual target, the data supports the central bank’s dovish stance. Moreover, Lagarde made my point during her press conference.
Please see below:
 Source: ECB
On top of that, when asked about potential interest rate hikes, Lagarde responded:
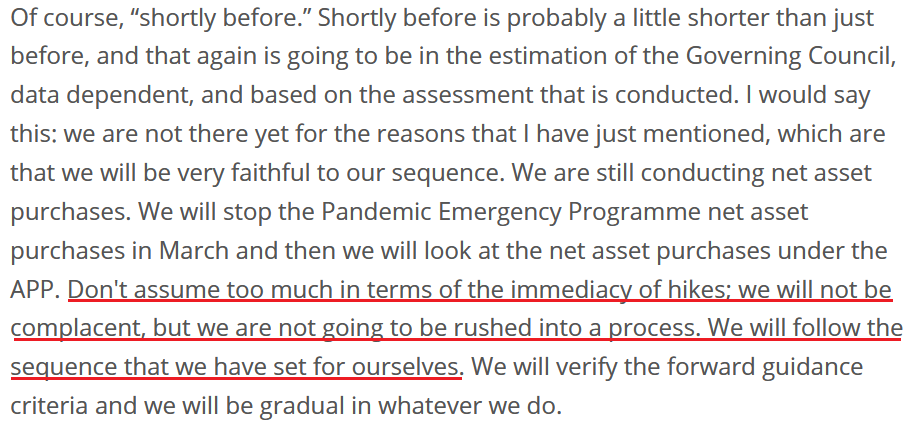
“How do you hike interest rates? By hiking interest rates. And clearly, we will have a very sophisticated determined approach and analysis to doing that. We will only do that in the sequence that we have fixed for ourselves, and which has been agreed, which is that we will look at net asset purchases first, gradually, on a data-dependent basis. Then we will look at interest rates.”
Thus, with the ECB’s monetary policy statement reading that “from October onwards, the Governing Council will maintain net asset purchases under the APP at a monthly pace of €20 billion for as long as necessary to reinforce the accommodative impact of its policy rates,” how can the ECB raise interest rates if it still plans to purchase bonds past October 2022? Think about it: Lagarde said that “we will look at net asset purchases first.” And if ending QE is the first step in the process, then the ECB is nowhere near the second step.
To that point, Lagarde reminded everyone:
 Source: ECB
And finally:
 Source: ECB
The bottom line? While it’s no surprise that investors ‘hear what they want to hear,’ the reality is that the ECB didn’t do anything hawkish on Feb. 3. And with the EUR/USD rallying hard, the USD Index suffered in the process. However, since the price action on Feb. 3 was likely another example of short-term hope overpowering medium-term reality, the EUR/USD should resume its downtrend in the coming months. And with the Fed well ahead of the ECB, euro bulls should learn the same hard lessons they learned in 2021.
In conclusion, the PMs declined on Feb. 3, as Meta Platforms’ (Facebook’s) weak Q4 earnings print ignited another NASDAQ Composite sell-off. And with the GDXJ ETF falling hard, the junior miners continued their underperformance. Moreover, while the USD Index also declined, the dollar basket should recover those losses and over the medium term. As a result, the fundamental outlook for the PMs remains profoundly bearish.
Overview of the Upcoming Part of the Decline
- It seems to me that the corrective upswing is over or close to being over, and that gold, silver, and mining stocks are now likely to continue their medium-term decline.
- It seems that the first (bigger) stop for gold will be close to its previous 2021 lows, slightly below $1,700. Then it will likely correct a bit, but it’s unclear if I want to exit or reverse the current short position based on that – it depends on the number and the nature of the bullish indications that we get at that time.
- After the above-mentioned correction, we’re likely to see a powerful slide, perhaps close to the 2020 low ($1,450 - $1,500).
- If we see a situation where miners slide in a meaningful and volatile way while silver doesn’t (it just declines moderately), I plan to – once again – switch from short positions in miners to short positions in silver. At this time, it’s too early to say at what price levels this could take place, and if we get this kind of opportunity at all – perhaps with gold close to $1,600.
- I plan to exit all remaining short positions once gold shows substantial strength relative to the USD Index while the latter is still rallying. This may be the case with gold close to $1,350 - $1,400. I expect silver to fall the hardest in the final part of the move. This moment (when gold performs very strongly against the rallying USD and miners are strong relative to gold after its substantial decline) is likely to be the best entry point for long-term investments, in my view. This can also happen with gold close to $1,375, but at the moment it’s too early to say with certainty.
- As a confirmation for the above, I will use the (upcoming or perhaps we have already seen it?) top in the general stock market as the starting point for the three-month countdown. The reason is that after the 1929 top, gold miners declined for about three months after the general stock market started to slide. We also saw some confirmations of this theory based on the analogy to 2008. All in all, the precious metals sector is likely to bottom about three months after the general stock market tops.
- The above is based on the information available today, and it might change in the following days/weeks.
You will find my general overview of the outlook for gold on the chart below:
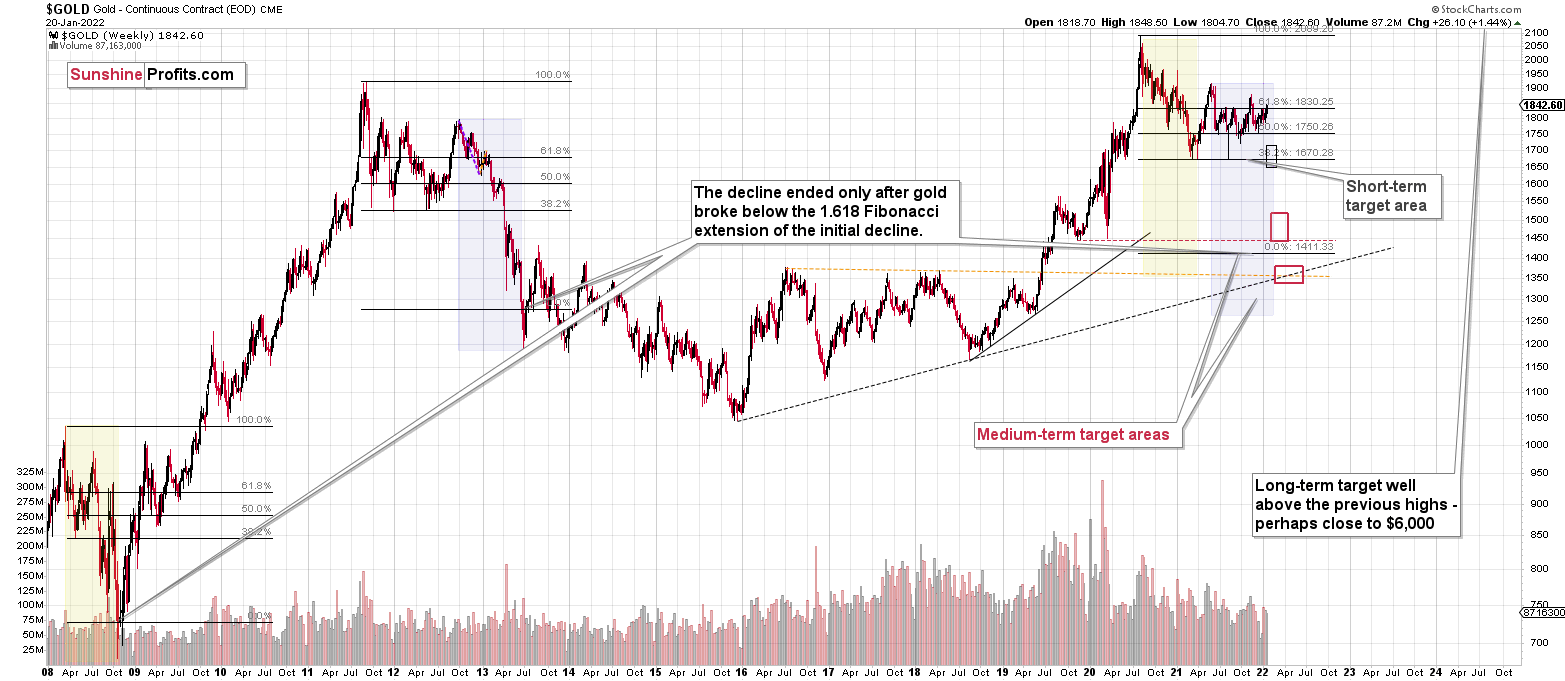
Please note that the above timing details are relatively broad and “for general overview only” – so that you know more or less what I think and how volatile I think the moves are likely to be – on an approximate basis. These time targets are not binding or clear enough for me to think that they should be used for purchasing options, warrants or similar instruments.
IMPORTANT REMINDER:
Administrative Info for This Week
I – PR – will be traveling this week, which means that the analyses will take a slightly different shape.
Regular analyses will include only the fundamental parts of the analyses, and while the technical details will not be posted regularly, I’ll still be monitoring the markets for most days, and I’ll send you intraday Alerts, if the situation requires it (in particular, if some extra changes are required in the trading or investment positions).
To be precise, the target levels presented in the “Trading capital” part below summary are “binding”, which means that if the price touches a given level, the trade should be executed (in my opinion, that is; it’s your capital, and you can do whatever you want with it) without waiting for my confirmation. I’m usually sending them for additional clarification, anyway, but this likely won’t be the case next week. In other words, if you haven’t placed an exit order on your trades, yet you’d like to apply the above suggestion, it might be a good idea to place those exit orders right away.
By “most days”, I mean that I know that there will be two days when I’ll have no access to any internet / electronics whatsoever, but I don’t know which days those will be. So, conservatively, I’ll provide you with a game-plan for the next week below. This way, my intraday comments are not that important as you’re up-to-date in advance, and if it’s necessary for me to provide you with an intraday update and I have the ability to do so, let’s treat it as an “extra value” that is not necessary (you’ll already be up-to-date because of the below details), but welcome. The gameplan is really an answer to the following question:
What to do next, if the exit levels are reached and the market then moves significantly?
Basically, there could be three scenarios in this case:
- If – after reaching the exit levels – the price moves back up significantly, then it would be a good idea to re-enter the short position in the GDXJ at $35.94 (at 300% of the size of the regular position, so the same size of the position that we have right now).
- If – after reaching the exit levels – the price moves lower significantly (in other words, it doesn’t bottom, but keeps falling), then I think it would be a good idea to re-enter the short position in the GDXJ at $31.47.
- If – after reaching the exit levels – the GDXJ price moves back-and-forth and/or doesn’t move to any of the prices in the previous points, then I think no additional action would be necessary.
The first scenario is positive (we gain more by re-entering short positions at higher prices), and the second scenario is negative (we gain less by re-entering short positions at lower prices). The third scenario is neutral.
The most likely outcome, in my view, is that the GDXJ ETF price will either not manage to get to the $34.63 target next week, or that it will manage to do so, and then it will rebound just a little or trade sideways (third scenario).
After all, let’s keep in mind that mining stocks tend to show strength before gold does, and things are not as volatile as they were in early 2020. This means that the short-term bottom is likely to be rather normal, meaning a situation where miners first show strength by declining just a little while gold declines more, then perhaps rally somewhat while gold doesn’t decline or declines just a little. It takes time for the above to take place.
Consequently, the most likely outcome, in my view, is that next week, the profits on the short position in the junior mining stocks will simply grow while we keep the positions intact.
All in all, you’re already equipped with the strategy for the next week, and the odds are that it won’t be necessary to take action, anyway.
Summary
Summing up, it seems to me that the corrective upswing is over, and that gold, silver, and mining stocks are now likely to continue their medium-term decline.
Please note that if mid-January rally was indeed based on supposedly increased tensions regarding Ukraine, then it’s likely that this rally is not going to be significant, and it might already be over. The “supposedly shocking” news already hit the market, and without any real follow-up (material) action, like Russian troops marching across the border with Ukraine, it seems that there’s nothing additional that markets could rally on. The market already “knows” that the tensions are very high and the chance for military conflict is high, regardless of whether that’s true or not. There’s not much more that can be said to increase that even further – only real action is likely to do it – and seeing such action is very unlikely in my view.
I continue to think that junior mining stocks are currently likely to decline the most out of all parts of the precious metals sector.
From the medium-term point of view, the key two long-term factors remain the analogy to 2013 in gold and the broad head and shoulders pattern in the HUI Index. They both suggest much lower prices ahead.
It seems that our profits from the short positions are going to become truly epic in the following months.
After the sell-off (that takes gold to about $1,350 - $1,500), I expect the precious metals to rally significantly. The final part of the decline might take as little as 1-5 weeks, so it's important to stay alert to any changes.
Most importantly, please stay healthy and safe. We made a lot of money last March and this March, and it seems that we’re about to make much more on the upcoming decline, but you have to be healthy to enjoy the results.
As always, we'll keep you - our subscribers - informed.
To summarize:
Trading capital (supplementary part of the portfolio; our opinion): Full speculative short positions (300% of the full position) in junior mining stocks are justified from the risk to reward point of view with the following binding exit profit-take price levels:
Mining stocks (price levels for the GDXJ ETF): binding profit-take exit price: $34.63; stop-loss: none (the volatility is too big to justify a stop-loss order in case of this particular trade)
Alternatively, if one seeks leverage, we’re providing the binding profit-take levels for the JDST (2x leveraged) and GDXD (3x leveraged – which is not suggested for most traders/investors due to the significant leverage). The binding profit-take level for the JDST: $14.98; stop-loss for the JDST: none (the volatility is too big to justify a SL order in case of this particular trade); binding profit-take level for the GDXD: $25.48; stop-loss for the GDXD: none (the volatility is too big to justify a SL order in case of this particular trade).
For-your-information targets (our opinion; we continue to think that mining stocks are the preferred way of taking advantage of the upcoming price move, but if for whatever reason one wants / has to use silver or gold for this trade, we are providing the details anyway.):
Silver futures downside profit-take exit price: $19.12
SLV profit-take exit price: $17.72
ZSL profit-take exit price: $38.28
Gold futures downside profit-take exit price: $1,683
HGD.TO – alternative (Canadian) inverse 2x leveraged gold stocks ETF – the upside profit-take exit price: $11.79
HZD.TO – alternative (Canadian) inverse 2x leveraged silver ETF – the upside profit-take exit price: $29.48
Long-term capital (core part of the portfolio; our opinion): No positions (in other words: cash
Insurance capital (core part of the portfolio; our opinion): Full position
Whether you already subscribed or not, we encourage you to find out how to make the most of our alerts and read our replies to the most common alert-and-gold-trading-related-questions.
Please note that we describe the situation for the day that the alert is posted in the trading section. In other words, if we are writing about a speculative position, it means that it is up-to-date on the day it was posted. We are also featuring the initial target prices to decide whether keeping a position on a given day is in tune with your approach (some moves are too small for medium-term traders, and some might appear too big for day-traders).
Additionally, you might want to read why our stop-loss orders are usually relatively far from the current price.
Please note that a full position doesn't mean using all of the capital for a given trade. You will find details on our thoughts on gold portfolio structuring in the Key Insights section on our website.
As a reminder - "initial target price" means exactly that - an "initial" one. It's not a price level at which we suggest closing positions. If this becomes the case (like it did in the previous trade), we will refer to these levels as levels of exit orders (exactly as we've done previously). Stop-loss levels, however, are naturally not "initial", but something that, in our opinion, might be entered as an order.
Since it is impossible to synchronize target prices and stop-loss levels for all the ETFs and ETNs with the main markets that we provide these levels for (gold, silver and mining stocks - the GDX ETF), the stop-loss levels and target prices for other ETNs and ETF (among other: UGL, GLL, AGQ, ZSL, NUGT, DUST, JNUG, JDST) are provided as supplementary, and not as "final". This means that if a stop-loss or a target level is reached for any of the "additional instruments" (GLL for instance), but not for the "main instrument" (gold in this case), we will view positions in both gold and GLL as still open and the stop-loss for GLL would have to be moved lower. On the other hand, if gold moves to a stop-loss level but GLL doesn't, then we will view both positions (in gold and GLL) as closed. In other words, since it's not possible to be 100% certain that each related instrument moves to a given level when the underlying instrument does, we can't provide levels that would be binding. The levels that we do provide are our best estimate of the levels that will correspond to the levels in the underlying assets, but it will be the underlying assets that one will need to focus on regarding the signs pointing to closing a given position or keeping it open. We might adjust the levels in the "additional instruments" without adjusting the levels in the "main instruments", which will simply mean that we have improved our estimation of these levels, not that we changed our outlook on the markets. We are already working on a tool that would update these levels daily for the most popular ETFs, ETNs and individual mining stocks.
Our preferred ways to invest in and to trade gold along with the reasoning can be found in the how to buy gold section. Furthermore, our preferred ETFs and ETNs can be found in our Gold & Silver ETF Ranking.
As a reminder, Gold & Silver Trading Alerts are posted before or on each trading day (we usually post them before the opening bell, but we don't promise doing that each day). If there's anything urgent, we will send you an additional small alert before posting the main one.
Thank you.
Przemyslaw Radomski, CFA
Founder, Editor-in-chief

