

Briefly: in our opinion, full (250% of the regular position size) speculative short positions in mining stocks are justified from the risk/reward point of view at the moment of publishing this Alert.
As in yesterday's Gold & Silver Trading Alert, we'll start with a brief note regarding the fundamentals and then we'll provide more details in the technical part of today's commentary.
The last two pieces of information was the Donald Trump provided a plan for getting back to business, and that one drug showed promising results. At least that's what finance.yahoo.com suggests as the main news right now.
To be clear, there were no definitive timelines in the back-to-business plan, just reassurance that the states will have the authority to decide when to do that. And New York quarantine was just extended until at least mid-May. So, overall, this is not a bullish indication.
Maybe the promising drug is a good reason for the stock market to keep on rallying? Sadly, that seems unlikely. The results of the study are indeed promising, the study was even conducted with a control group, but the forecast based on it is of relatively low quality. Think about it - there are hundreds of studies conducted right now. Wouldn't it seem reasonable to expect some of them to - entirely randomly - show better results than the other? Some groups of people will get better faster and some will get worse faster - without any particular reason.
Nicholas Nassim Taleb, in his book "Fooled by Randomness" (one of your Editor's favorite books) shows an example of infinite number of monkeys spread across the universe bashing randomly on the typewriters they have in front of them. After some (long) time, one of these bazillions of monkeys will end up with Illiad, just like the one Homer wrote. Taleb then asks, would you (reader) then bet your life's savings that this "hero among monkey" would write "Oddysey" next?
The point of conducting high-quality tests and the need to get more trials done is to prevent making such false assumptions that could have been just random. The results may be "promising", but that doesn't change anything right now.
Also, please note that yesterday, the world noted the second biggest daily increase in the new Covid-19 cases. It was relatively big in the US as well (6th biggest daily increase). It doesn't look like business will be back to normal anytime soon...
Having said that, let's move to charts.
Just like we did yesterday, we'll start with the USD Index.
The USDX Moves
We'll open up with a quote from yesterday's Alert (by the way, please remember that all charts are expandable/clickable):
Looking at the 4-hour candlestick chart, we see that the USD Index just formed a reversal and is now testing the previous lows. There were very few 4-hour reversals in the recent days, but when we saw them, big and fast rallies followed. The early-March bottom is particularly similar to the current situation as the USD Index is - just like back then - after a visible decline, and the 4h reversal was followed by a re-test of the intraday low.
What happened next?
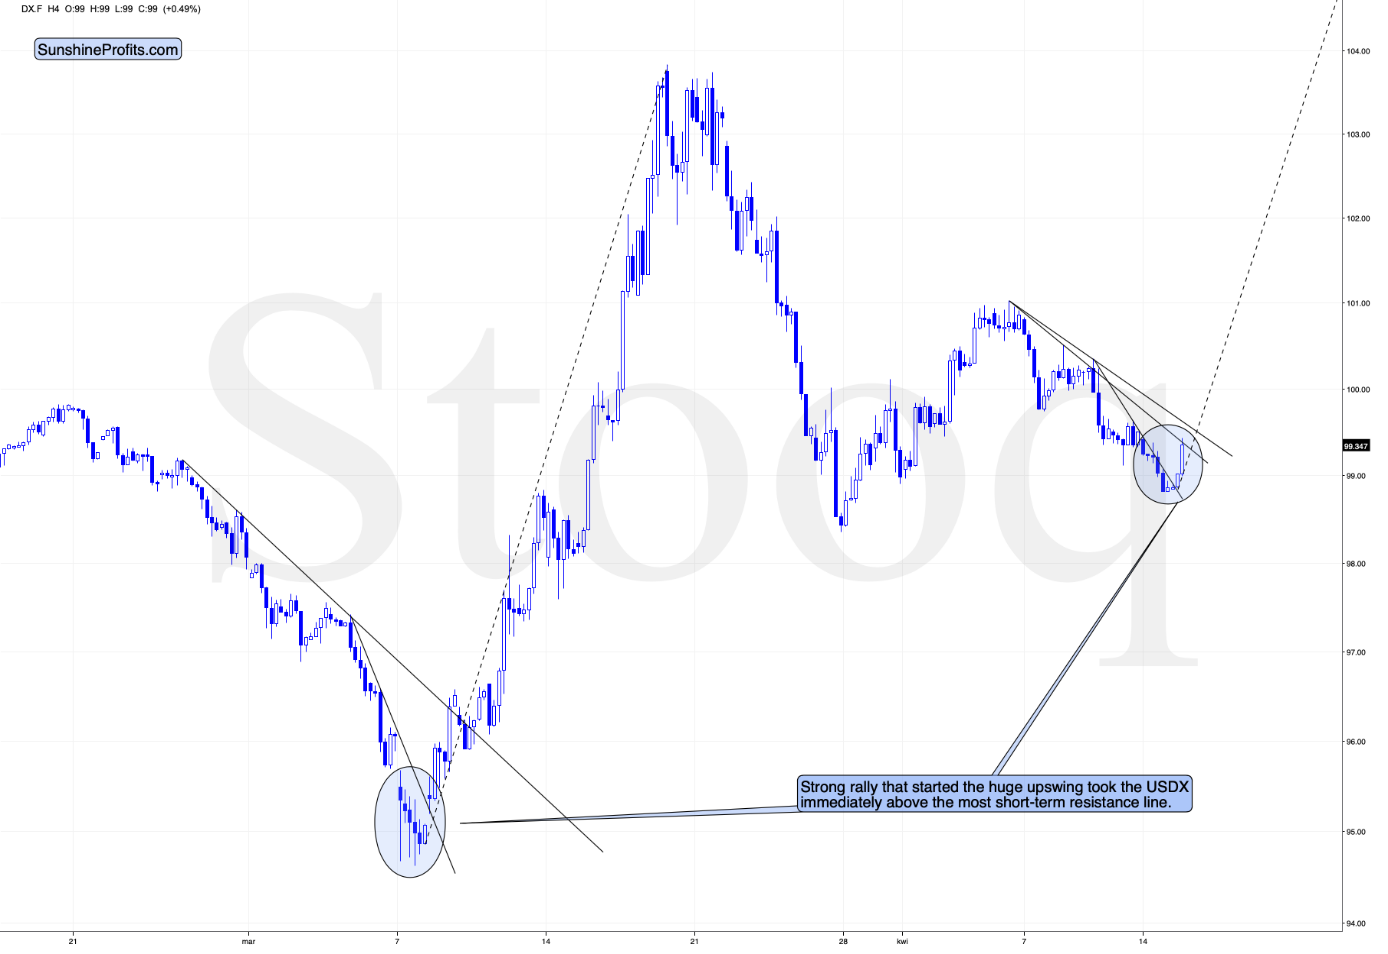
The USD Index moved below the intraday low of the reversal and then soared back up - exactly as it did in early March. And just like what it did back then, the USDX rallied immediately after the bottom and it did so in a sharp manner, especially right after breaking above the most short-term declining resistance line.
At the same time, the USD Index invalidated the small breakdown below the April 1st low.
Once the USD Index soars above the upper declining resistance line (currently at about 99.6) it will be relatively clear that the short-term bottom is already in and another big upswing has just begun.
That line will be the final short-term confirmation, though. The most important line is the one that the USX is testing right now. It's the one based on the April 6th and April 8th tops. Once the USDX breaks above it, the short-term odds will be on the bulls' side and it will be clearly visible for many traders, not only for those who pay attention to the price pattern analogies and are able to detect the bottoms earlier (such as us). It could be the case that when you read this, the breakout above this line is already confirmed.
And what happened in the following hours?
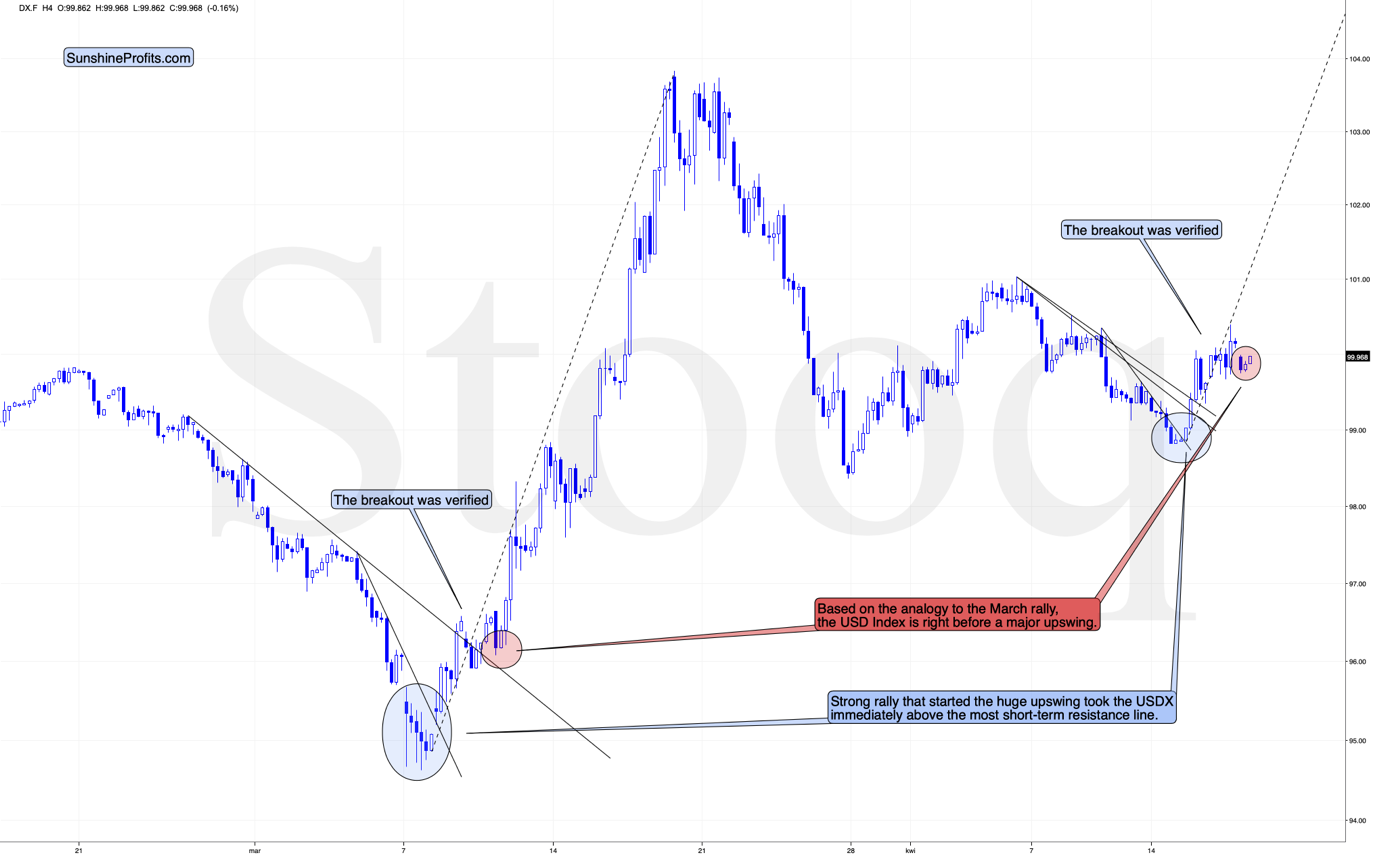
The USD Index has indeed broken above all declining resistance lines. And it gets better - the USDX didn't just break below those lines. It then pulled back, verified the previous resistance lines as support and then moved higher once again. That's the perfect breakout, which makes the outlook clearly bullish, and very similar to what happened around March 10.
The back and forth movement that we've seen in the last several hours - below the previous highs, but also above the recent lows - makes today similar to what we saw on March 12th - right before the powerful run-up. After we created the above chart, the USDX moved above 100 once again, which seems to be confirming the similarity. Still, we wouldn't rule out another final short-term pullback before the true rally is seen. In practice, it means that we might see the big run-up today - but even if we won't see it today, we'll very likely see it (probably early) next week.
The implications for the precious metals market are very bearish.
Silver Breaks Down
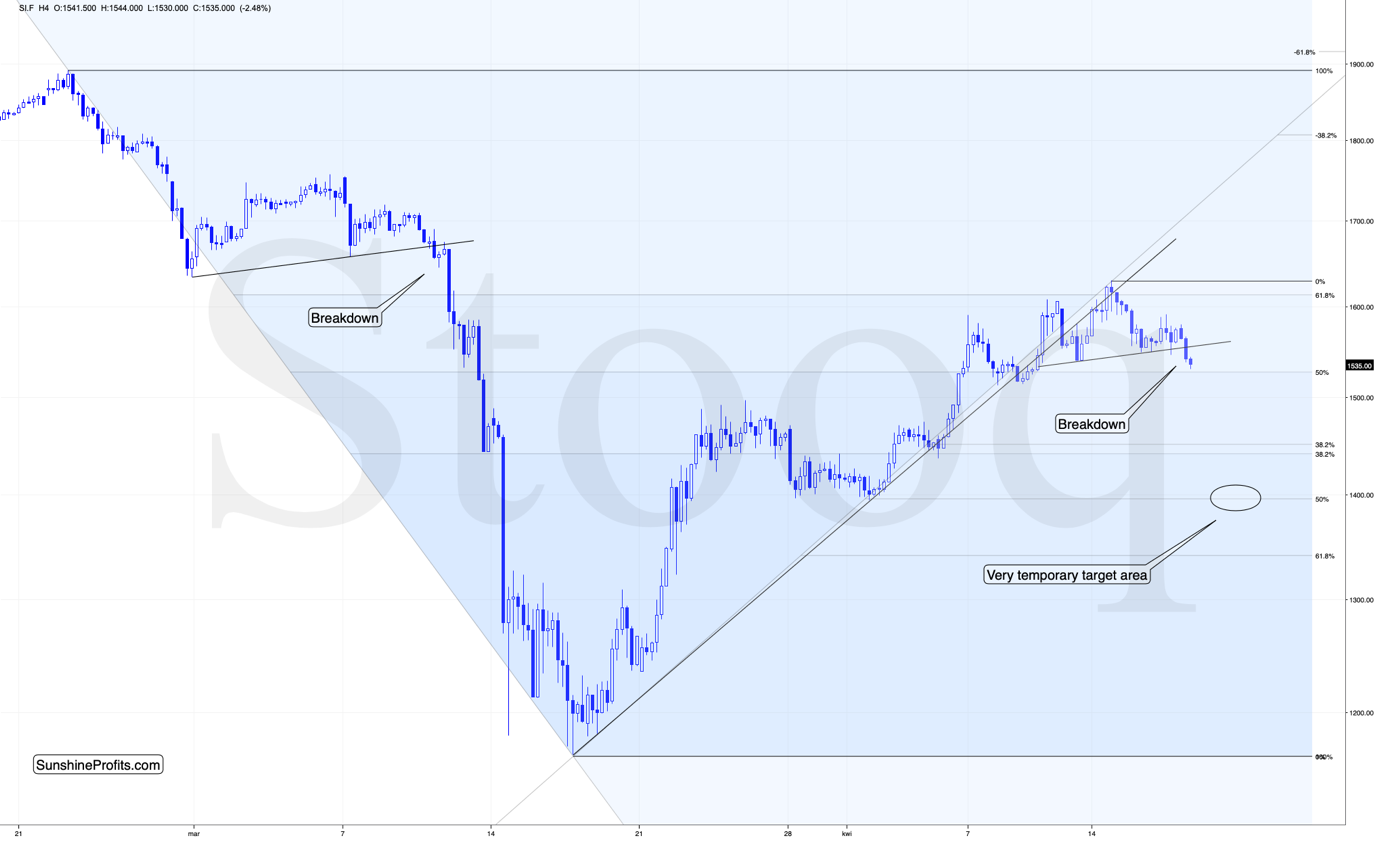
Silver just broke below the rising support line, and has been verifying this breakdown for the past few hours. That's perfectly normal and it doesn't make the situation bullish. Conversely, each passing hour without invalidation of the breakdown is another point for the bears. Back in March, similar consolidation after the breakdown was the final pause before the big declines.
Is the history repeating itself here? This seems quite likely, especially given that the similarity that we're describing, took place on March 12 - exactly the same day when the USD Index was performing similarly to its today's performance. History repeating itself to a considerable degree is one of the foundations of the technical analysis, and the key factor behind key precious metals trading tips.
Moreover, let's keep in mind that silver is already after a confirmed breakdown below the rising support line. The implications are strongly bearish.
Miners' Hidden Breakdown
As far as mining stocks are concerned, we previously wrote the following:
The sell signal comes from the Stochastic indicator. Do you know when we saw the previous sell signal from the Stochastic indicator while it was above 80? It was in late February right after the top, at a very similar price level.
Please note that back in February, there was a pause right after the first daily decline, and it took place on very low volume. We saw exactly the same thing yesterday.
The history seems to be rhyming.
Our yesterday's comments on the above chart remain up-to-date:
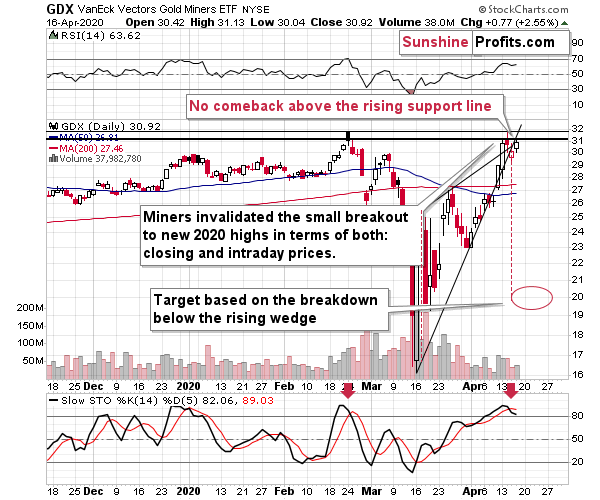
On a short-term basis, we see that the GDX ETF just tried to break to new 2020 highs. And it failed to do so. This attempt was made after GDX moved higher on relatively low volume, so it's no wonder that it failed - there was not enough buying power to keep prices at a new yearly high.
The invalidation of the small breakout is a bearish sign. Given the above, along with the pre-market move lower in gold and the general stock market, it seems that miners will move lower today. This move lower is likely to be the breakdown below the rising wedge and the thing about this formation is that once it's broken, it quite often triggers waterfall selling that leads to very volatile price drops.
This would be in perfect tune with the mining stocks responding to a decline in gold and stocks, and to the rally in the USD Index.
The miners didn't move lower yesterday, but they didn't rally back above the rising support / resistance line either. This doesn't look bearish at first sight, but please note that it was the first time, when the miners failed to get back above this line on the day that followed the breakdown. This is a subtle, but important confirmation that the short-term upswing has just ended and that lower mining stock values are to be expected.
The sell signal from the Stochastic indicator is now clearly visible, which adds more weight to the bearish case.
Also, please note that gold miners showed relative strength only when compared to gold futures. Spot gold was relatively unchanged yesterday, which explains why miners didn't move much. Still, the spot price is likely to follow futures, and that's already taking place today. Miners are likely to respond during today's session.
Having said that, let's move to gold.
In yesterday's analysis, we wrote about the potential bearish head and shoulders formation in gold and about its breakdown below the rising support line. The situation developed in tune with our expectations, and the below yesterday's comments remain up-to-date:
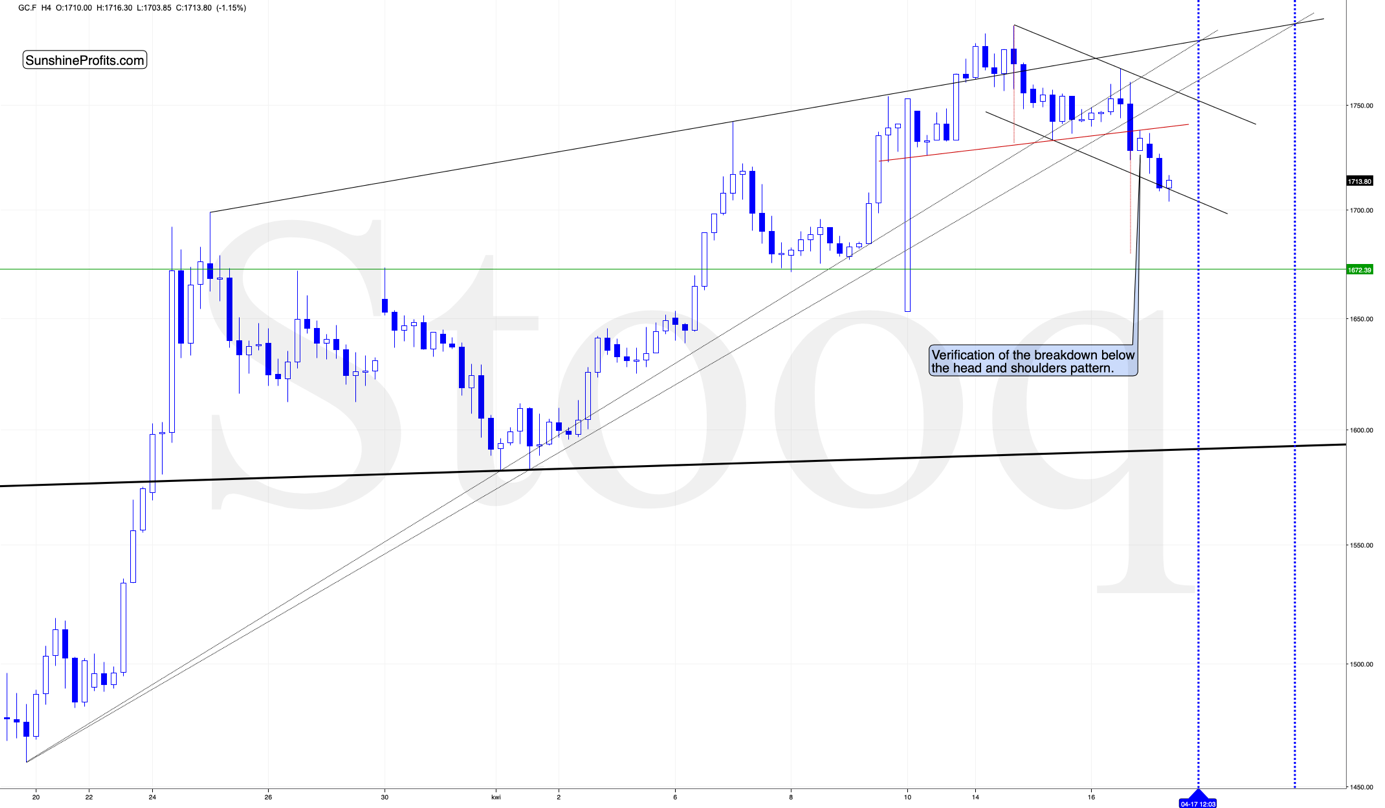
As we indicated earlier today, there are quite a few things visible on the above (4-hour) chart. We'll start by saying that the big white candlestick that we see on April 10th is a data error, so please don't pay attention to it. We'll address the features that we see on the gold chart, starting from the relatively small patterns and then we'll zoom out.
The most short-term pattern is the triangle based on just the last few days. It was broken to the upside since we created the chart, but it's not a big deal because of two things. The first thing is that the vertex of the triangle is just several hours away, so gold would be quite likely to top there. The second thing is that another move lower would be in tune with a bigger pattern - the head-and-shoulders top pattern.
The price action around April 10 would be the left shoulder, the recent top would be the head, and the current consolidation would be the right shoulder. This means that another move to the very recent highs - at about $1,755- $1,760 is relatively normal.
Besides, when gold topped in early March at about $1,700, it declined at a moderate pace at first, and right before the decline accelerated, gold corrected almost 50% of the preceding downswing. The analogous move would take gold to about $1,760 right now.
The head-and-shoulders formation - if completed - will point to the mid-April lows as the next downside target (marked with the dashed line). However, this might not be when the decline stops. In fact, the decline could pause in a more visible way only after gold moves a bit below $1,600. These are the price levels that stopped the declines in late February and in early April.
The decline below $1,600 would also be in tune with where gold declined in 2008 before pausing for a few days.
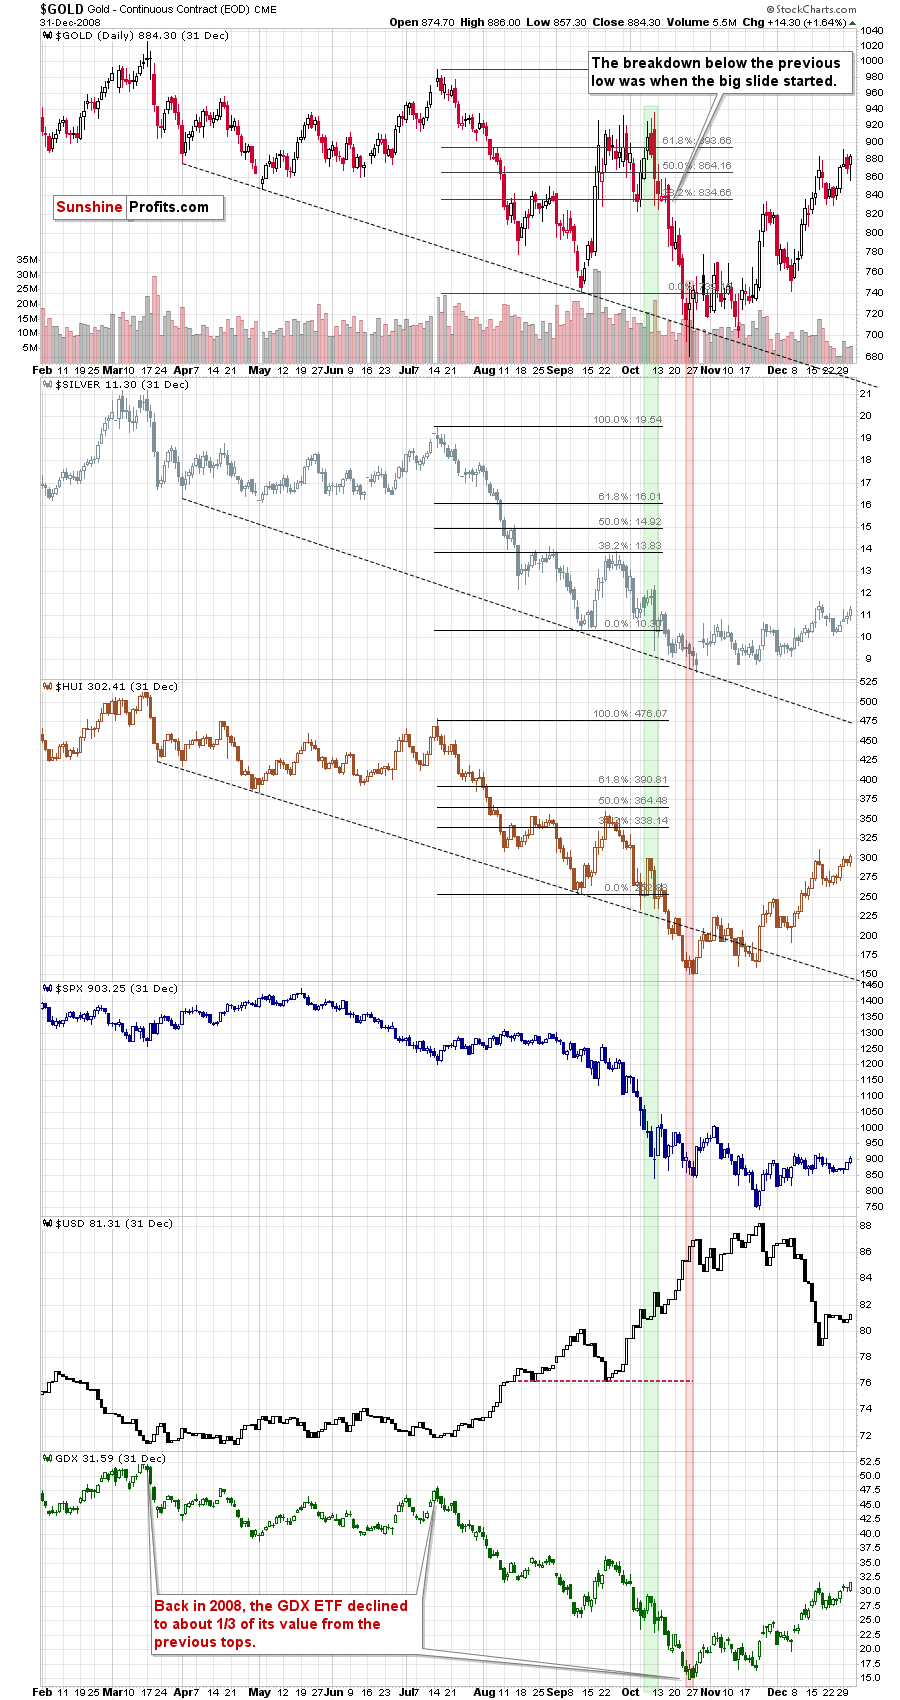
Back then, gold declined over 11% before pausing. A 11% decline from the recent high would imply gold at $1,592, which perfectly fits the above-mentioned support level.
Please note that gold is also trading very close to its rising support line (based on the March and April lows), which already worked once (on April 8th). Gold has been moving back and forth around it for the last several hours, but once the breakdown is complete and obvious, gold would be likely to slide based on it.
This support line, together with a rising resistance line based on the late-March and early April highs, creates a rising wedge pattern. This means that once gold breaks below it, it would be likely to decline as much as the height of the wedge. The wedge's height is almost $200, and gold would likely break below it at about $1,750, so the above suggests a move to about $1,550.
We also wrote the following about the possible interim bottom:
The time when these lines cross might also be important. They cross... Tomorrow. It could be the case that we'll see some major volatility today and tomorrow and a temporary low before the weekend. Of course, it could also be the case that gold moves higher once again and tops at that time, but based on what we already wrote today, the former scenario seems more likely.
We created two specific time projections based on the triangle-vertex-based reversal, and we marked them with blue. Actually, it would be a rising-wedge-vertex-based reversal in this case, but it doesn't change anything.
The first vertex suggests that we should see some kind of turnaround today, and the second suggests that we might see it in on Tuesday. What if we re-created the same pattern using the daily candlesticks?
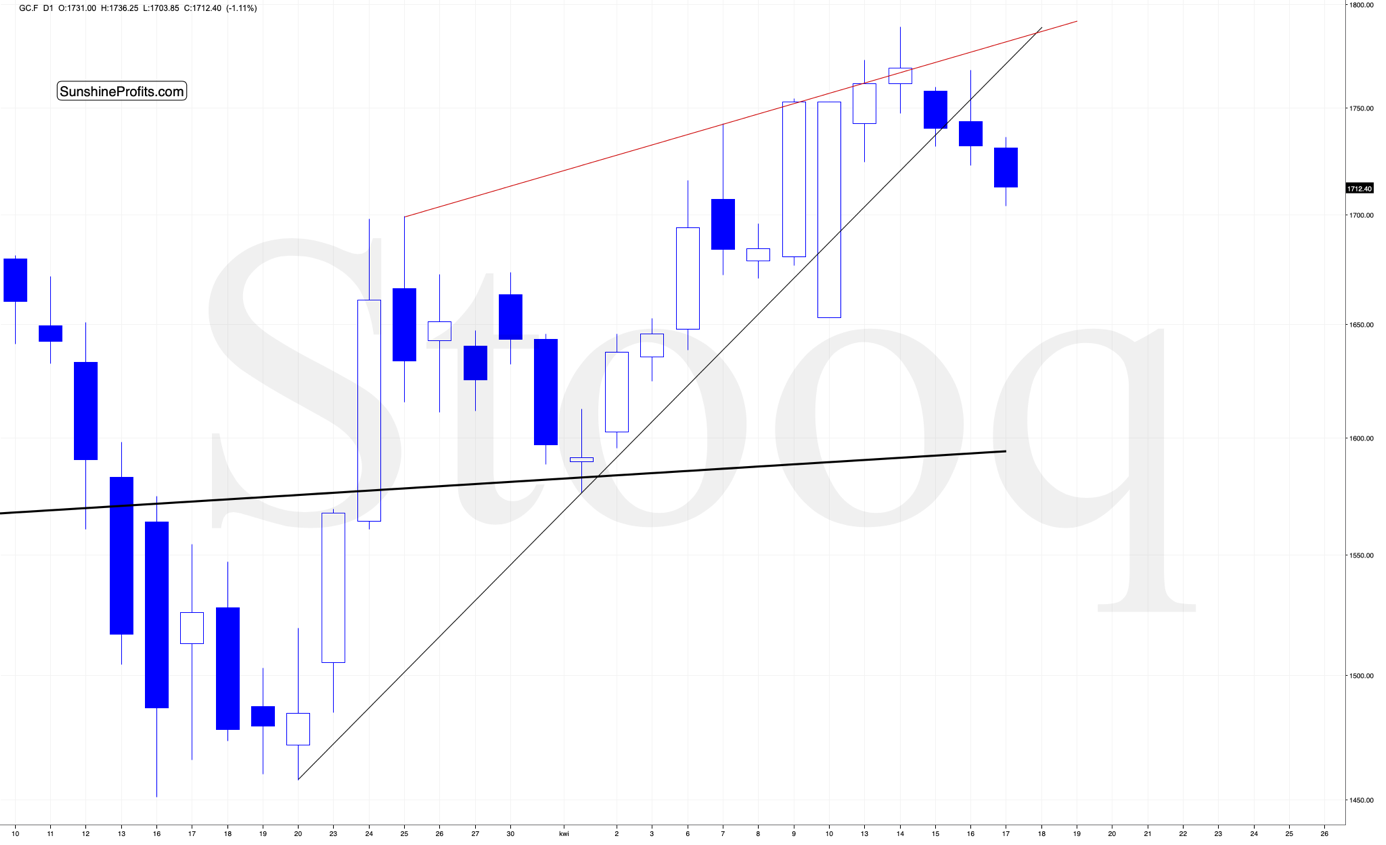
In this case, we get a projection that suggests seeing some kind of a price extreme on Monday. It could be the case that we'll see sort of an interim bottom today, but a more important one on Monday, but it's relatively unclear.
What is clear, however, is that the USD Index seems to be ready to rally much higher, and the precious metals market is already reacting to it. This means that as the USDX climbs, the PMs and miners are likely to fall. Based on USDX's upside potential and the analogy to 2008, the precious metals sector can fall very low, very fast.
Finally, before summarizing, we would like to reply to questions that we received recently.
From the Readers' Mailbag
Q: How long do you see GDX bouncing around its final bottom? Minutes, hours ,days?
A: If GDX declines as low as we think it will decline, we expect the bottom to be shaped similarly to what we saw in mid-March or to what we saw in 2008. This means that the bottom could take place between a few minutes and 2-3 days. We expect the volatility to be bigger and more in line with what we saw in March, than what we saw in 2008, so it could be the case that the bottom in prices is over within minutes.
If we're lucky and we see a reversal in gold while the USD Index keeps on rallying, this could give us up to few days of the bottoming process, but waiting more than that would be pushing the luck too far.
If we don't see the above confirmation, we'll expect the bottom to be very brief.
Summary
Summing up, the outlook for the precious metals market remains bearish for the next few weeks, despite the upswing that we saw recently. In fact, based on the way the USD Index moved yesterday and today, it seems that the top in the PMs and miners is already in and the final part of the decline has already started.
The outlook might become bullish if the strength in the PMs and miners persists and they prove to be able to rally despite falling stock prices and rallying USD Index, but it's much too early to say that this is already the case. Conversely, it seems that another big move higher in the USD Index has already begun, which would be likely to trigger a sell-off in the precious metals sector.
After the sell-off, we expect the precious metals to rally significantly. The decline might take as little as 1-3 weeks, so it's important to stay alert to any changes.
Most importantly - stay healthy and safe. We're making a lot of money on these price moves (and we'll likely make much more in the following weeks and months), but you have to be healthy to really enjoy the results.
By the way, we recently opened a possibility to extend one's subscription for a year with a 10% discount in the yearly subscription fee (the profits that you took have probably covered decades of subscription fees...). It also applies to our All-Inclusive Package (if you didn't know - we just made huge gains shorting crude oil and are also making money on both the decline and temporary rebound in stocks). The boring time in the PMs is over and the time to pay close attention to the market is here - it might be a good idea to secure more access while saving 10% at the same time.
Important: If your subscription got renewed recently, but you'd like to secure more access at a discount - please let us know, we'll make sure that the discount applies right away, while it's still active. Moreover, please note that you can secure more access than a year - if you secured a yearly access, and add more years to your subscription, each following year will be rewarded with an additional 10% discount (20% discount total). We would apply this discount manually - please contact us for details.
Secure more access at a discount.
As always, we'll keep you - our subscribers - informed.
To summarize:
Trading capital (supplementary part of the portfolio; our opinion): Full speculative short positions (250% of the full position) in mining stocks is justified from the risk to reward point of view with the following binding exit profit-take price levels:
Senior mining stocks (price levels for the GDX ETF): binding profit-take exit price: $10.32; stop-loss: none (the volatility is too big to justify a SL order in case of this particular trade); binding profit-take level for the DUST ETF: $9.82; stop-loss for the DUST ETF: none (the volatility is too big to justify a SL order in case of this particular trade)
Junior mining stocks (price levels for the GDXJ ETF): binding profit-take exit price: $9.57; stop-loss: none (the volatility is too big to justify a SL order in case of this particular trade); binding profit-take level for the JDST ETF: $14.52; stop-loss for the JDST ETF: none (the volatility is too big to justify a SL order in case of this particular trade)
For-your-information targets (our opinion; we continue to think that mining stocks are the preferred way of taking advantage of the upcoming price move, but if for whatever reason one wants / has to use silver or gold for this trade, we are providing the details anyway. In our view, silver has greater potential than gold does):
Silver futures downside profit-take exit price: $8.58
Gold futures downside profit-take exit price: $1,312 (the target for gold is least clear; it might drop to even $1,170 or so)
Long-term capital (core part of the portfolio; our opinion): No positions (in other words: cash)
Insurance capital (core part of the portfolio; our opinion): Full position
Whether you already subscribed or not, we encourage you to find out how to make the most of our alerts and read our replies to the most common alert-and-gold-trading-related-questions.
Please note that the in the trading section we describe the situation for the day that the alert is posted. In other words, it we are writing about a speculative position, it means that it is up-to-date on the day it was posted. We are also featuring the initial target prices, so that you can decide whether keeping a position on a given day is something that is in tune with your approach (some moves are too small for medium-term traders and some might appear too big for day-traders).
Plus, you might want to read why our stop-loss orders are usually relatively far from the current price.
Please note that a full position doesn't mean using all of the capital for a given trade. You will find details on our thoughts on gold portfolio structuring in the Key Insights section on our website.
As a reminder - "initial target price" means exactly that - an "initial" one, it's not a price level at which we suggest closing positions. If this becomes the case (like it did in the previous trade) we will refer to these levels as levels of exit orders (exactly as we've done previously). Stop-loss levels, however, are naturally not "initial", but something that, in our opinion, might be entered as an order.
Since it is impossible to synchronize target prices and stop-loss levels for all the ETFs and ETNs with the main markets that we provide these levels for (gold, silver and mining stocks - the GDX ETF), the stop-loss levels and target prices for other ETNs and ETF (among other: UGLD, DGLD, USLV, DSLV, NUGT, DUST, JNUG, JDST) are provided as supplementary, and not as "final". This means that if a stop-loss or a target level is reached for any of the "additional instruments" (DGLD for instance), but not for the "main instrument" (gold in this case), we will view positions in both gold and DGLD as still open and the stop-loss for DGLD would have to be moved lower. On the other hand, if gold moves to a stop-loss level but DGLD doesn't, then we will view both positions (in gold and DGLD) as closed. In other words, since it's not possible to be 100% certain that each related instrument moves to a given level when the underlying instrument does, we can't provide levels that would be binding. The levels that we do provide are our best estimate of the levels that will correspond to the levels in the underlying assets, but it will be the underlying assets that one will need to focus on regarding the signs pointing to closing a given position or keeping it open. We might adjust the levels in the "additional instruments" without adjusting the levels in the "main instruments", which will simply mean that we have improved our estimation of these levels, not that we changed our outlook on the markets. We are already working on a tool that would update these levels on a daily basis for the most popular ETFs, ETNs and individual mining stocks.
Our preferred ways to invest in and to trade gold along with the reasoning can be found in the how to buy gold section. Additionally, our preferred ETFs and ETNs can be found in our Gold & Silver ETF Ranking.
As a reminder, Gold & Silver Trading Alerts are posted before or on each trading day (we usually post them before the opening bell, but we don't promise doing that each day). If there's anything urgent, we will send you an additional small alert before posting the main one.
Thank you.
Sincerely,
Przemyslaw Radomski, CFA
Editor-in-chief, Gold & Silver Fund Manager

