

Briefly: in our opinion, full (300% of the regular position size) speculative short positions in mining stocks are justified from the risk/reward point of view at the moment of publishing this Alert.
Yesterday's session was indeed volatile around the FOMC, just like we warned, and gold even moved to its previous high, likely forming a double-top pattern. Even though gold moved higher on an intraday basis, it didn't invalidate its previous breakdown, which was a bearish sign. Gold was likely to decline, and it is declining so far in today's pre-market trading.
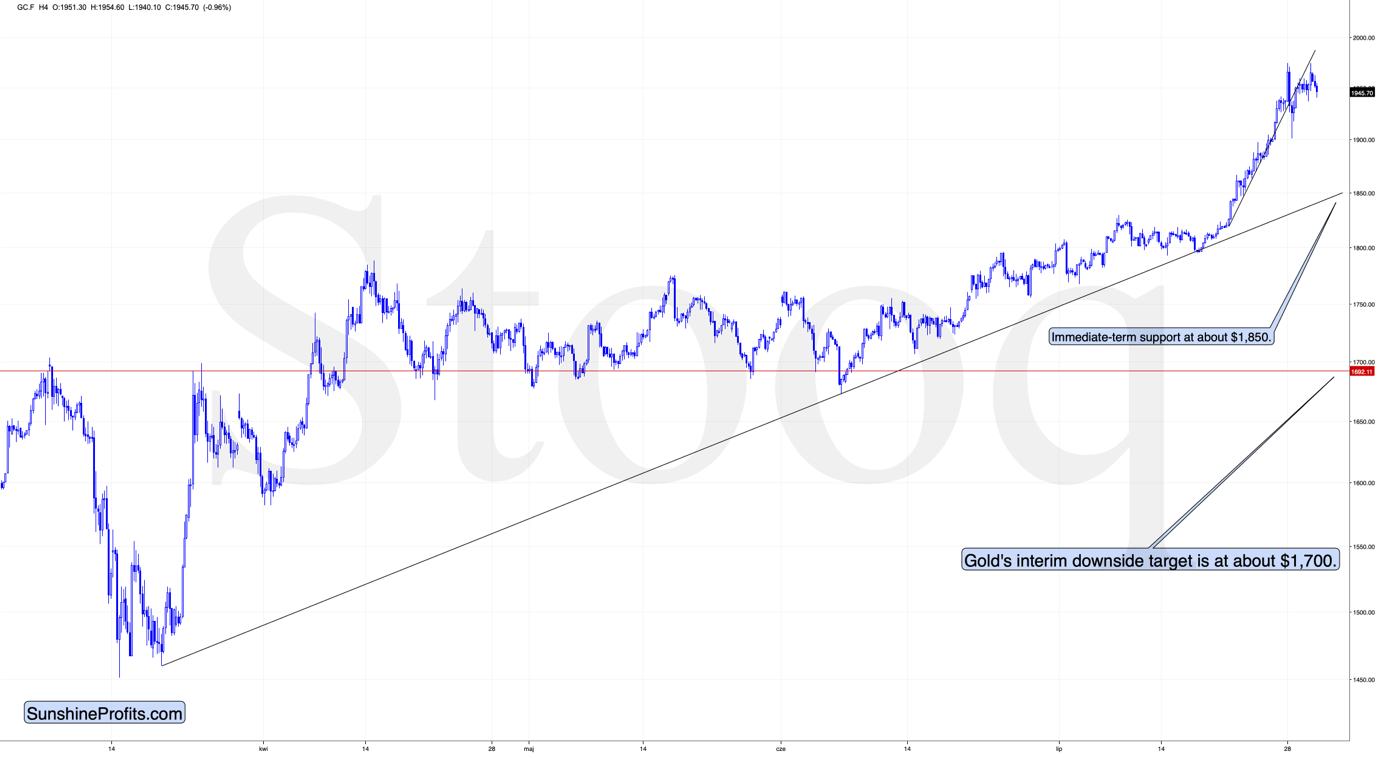
The above chart shows just how precisely yesterday's upswing ended at the previous support line, verifying it (most likely finally) as resistance. The implications are bearish.
The next short-term support is at about $1,850, but we don't think that the decline will completely stop there. Instead, after a pause or corrective upswing, a move to about $1,700 - or even lower is likely in the cards. Naturally, this is based on the information that we have available at the moment of writing these words, and the outlook could change in the future.
Why? Because of the confirmations from other markets, including silver and - perhaps most importantly at this time - the USD Index.
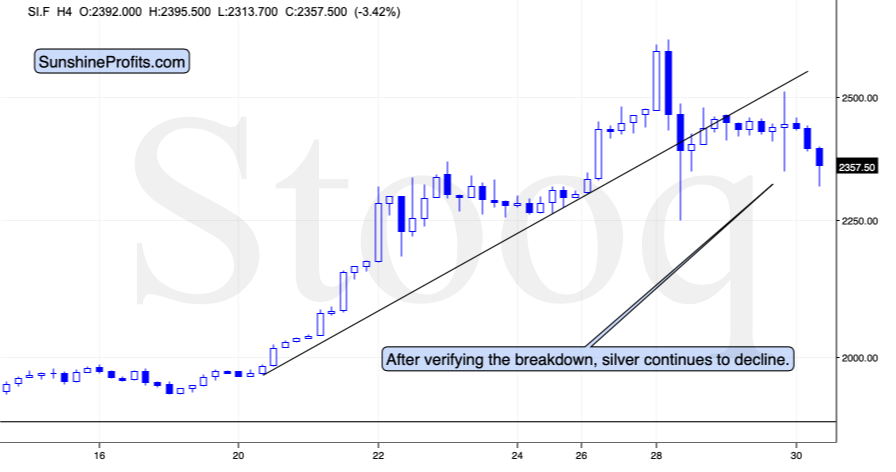
Just like gold, silver moved back to its previous support line and verified it as resistance. It seems that both markets are waiting for USD's rally (which is likely to arrive shortly) to plunge.
And what did the USD Index do recently?
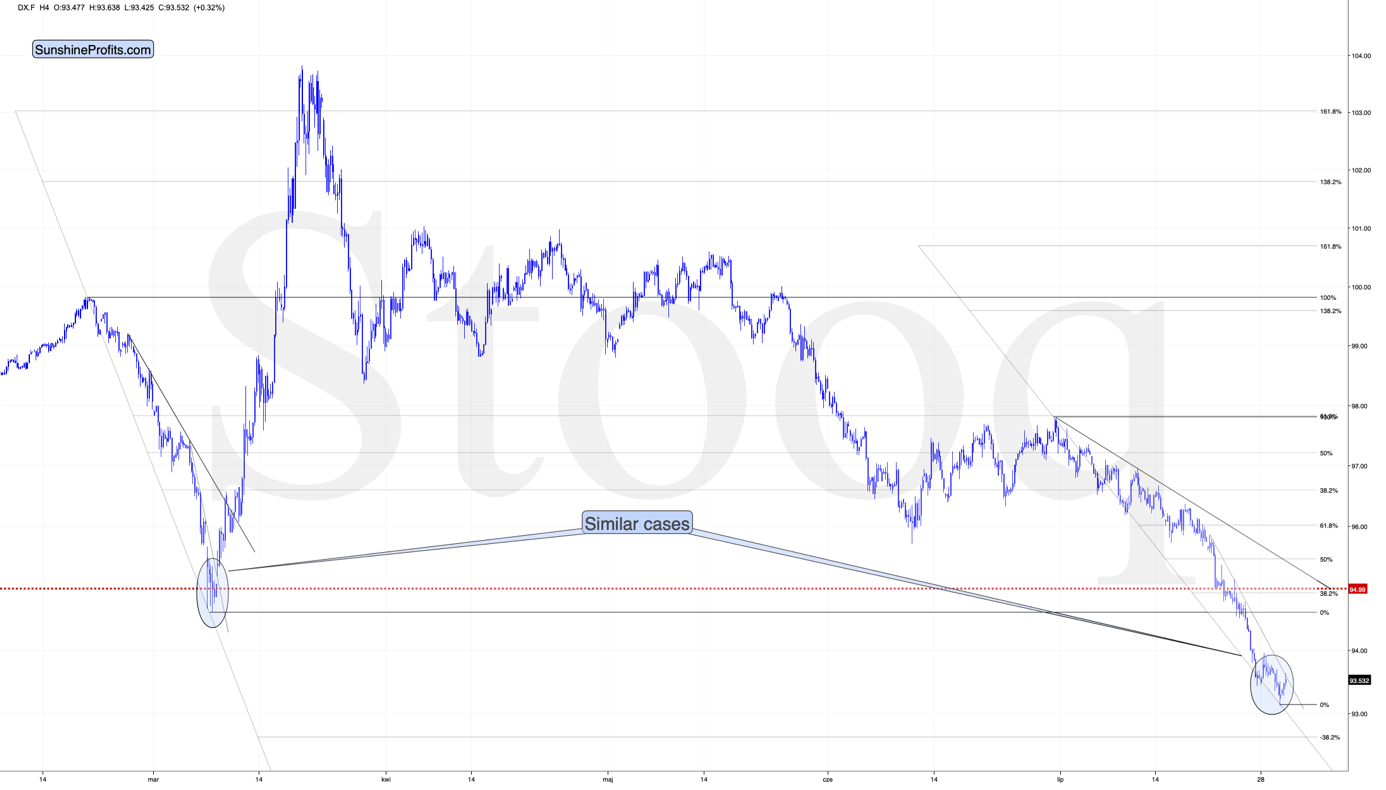
While gold didn't move back above its rising support / resistance line, let alone the previous high, the USD Index did move below its previous low.
This means that after a powerful short-term rally, gold is refusing to react to additional bullish indications. This is a strongly bearish sign. Naturally, gold's verification of its breakdown is bearish as well.
The USD Index itself is also very important, because while the move to new lows is not encouraging, it's worth keeping in mind that the early March bottom was actually a series of tiny bottoms, when the initial bottom was broken by just a little right before the USD soared.
Consequently, the loss of USD's bearish momentum might be the thing that one should focus on at the current juncture, and view the breakdown as bearish only if it is confirmed. At the moment of writing these words, the USD Index is already back above its Monday's intraday low.
At the same time, the USD Index is attempting to move back above its declining short-term resistance line. It seems that this attempt might finally succeed. Let's keep in mind that breaking above the analogous line in early March was the start of USD's powerful upswing.
Zooming out shows that there's a very good reason for the USD Index to rally here.
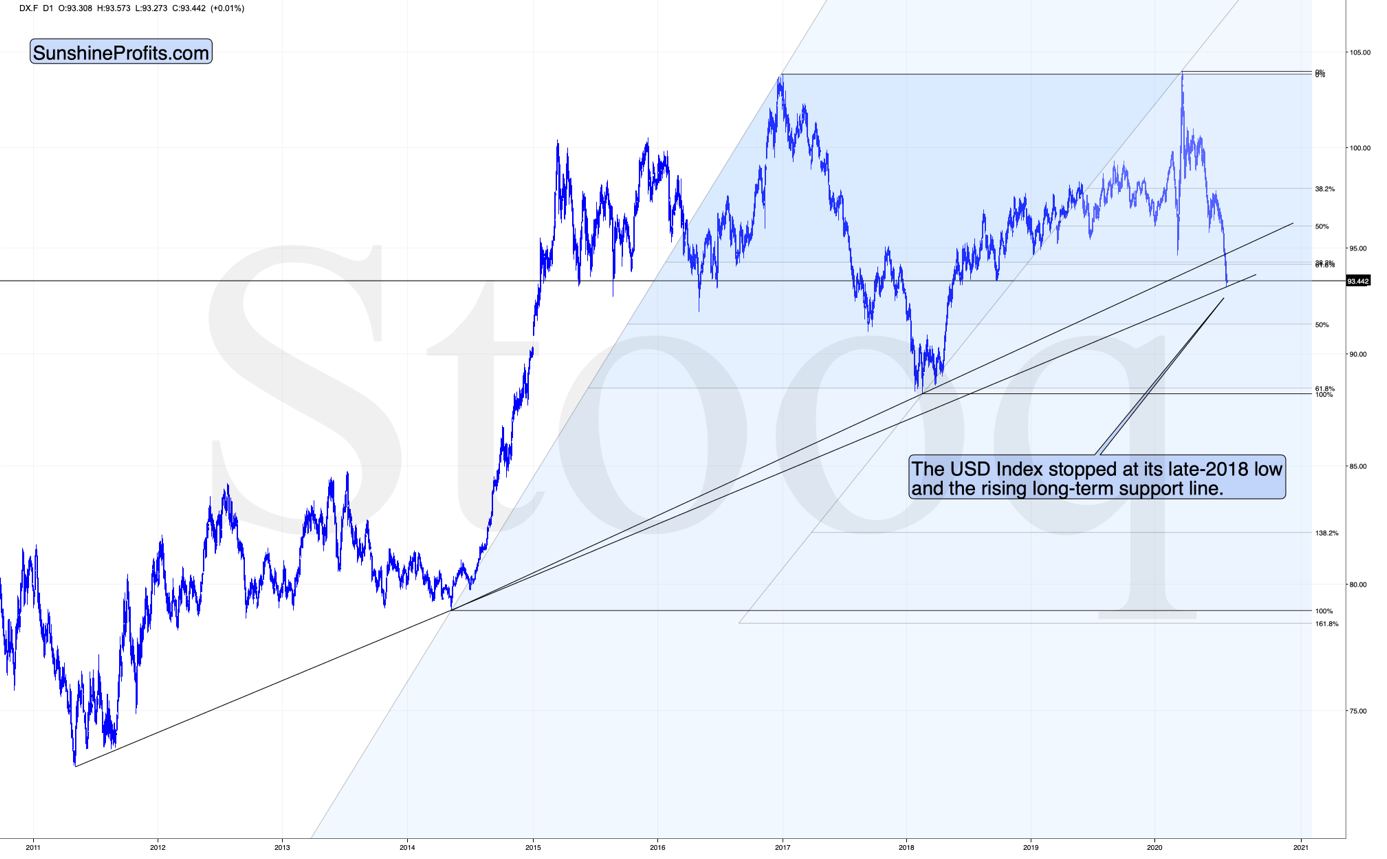
The USD Index just moved to the early-2018 lows, which were also the mid-2015 and 2016 lows (approximately). Additionally, the USDX moved to the rising long-term support line based on the 2011 and 2014 bottoms. And it all happened relatively shortly after the USDX moved below two important Fibonacci retracement levels: 61.8% retracement based on the 2018 - 2020 rally, and the 38.2% retracement based on the 2014 - 2020 rally.
All the above-mentioned factors suggest that the USD Index is going to rally in the very near future. Gold has been magnifying USD's tiny shows of strength, which suggests that any really visible rally in the USDX is likely to trigger a big sell-off in gold.
And a big sell-off in gold is likely to translate into an even bigger plunge in the gold stocks.
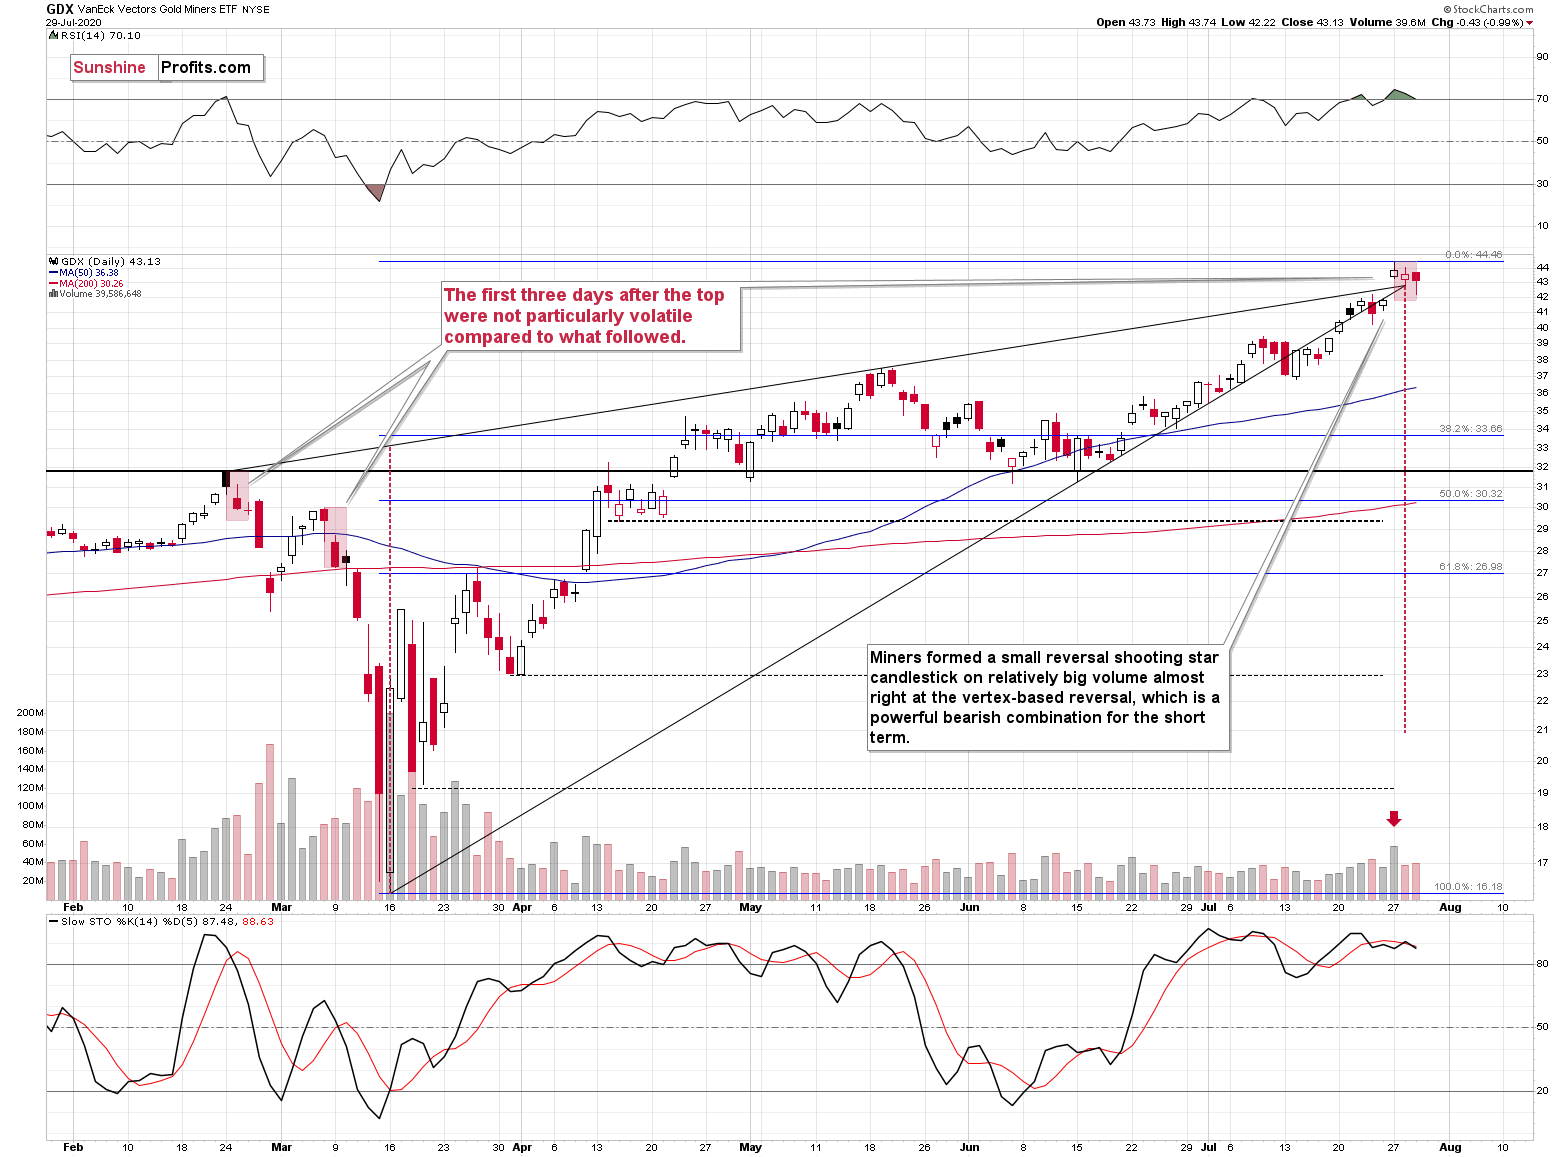
During Monday's session, miners reversed on big volume and it happened almost right at the vertex-based reversal. Gold stocks then continued to decline on volume that was not minor.
So far, the decline was relatively calm, but let's keep in mind that the same was the case during the first three trading days of both early-2020 declines. The GDX ETF declined rather insignificantly in late February, and the same was the case in the early March.
The important detail is that while gold moved to the precious high during yesterday's session, gold miners didn't. Their underperformance relative to gold along with the RSI above 70, and the recent reversal make the outlook very bearish for gold and silver mining stocks.
Overview of the Upcoming Decline
As far as the current overview of the upcoming decline is concerned, I think that after bottoming temporarily at about $1,700, gold, silver and miners will bounce back - perhaps $30-$50 or so in gold, and then we will probably see another move lower, with silver declining more than miners. That would be in tune with how the markets initially reacted to the Covid-19 threat.
At this time it seems that after the initial decline to $1,700, gold could correct and then decline to $1,500 - $1,600 and that would be the final bottom - one that would hold for years, perhaps decades.
Still, it's possible that the $1,700 bottom in gold would be the final bottom.
How will we tell, which scenario is more likely - a decline visibly below $1,700 or just to it? Based on the way different parts of the precious metals sector react to the decline and to the initial rebound. If silver catches up with the decline when gold moves to $1,700, but miners lead on the way back up (strongly so), it will be more likely that the bullish scenario prevails. If we see the opposite - miners are weak during the rebound and silver doesn't catch up with the decline once gold approaches $1,700, the bearish case will prevail. Anything in between will require additional confirmations and we will keep you - our subscribers - updated in any case.
The impact of all the new rounds of money printing in the U.S. and Europe on the precious metals prices is very positive in the long run, but it doesn't make the short-term decline unlikely. In the very near term, markets can and do get ahead of themselves and then need to decline - sometimes very profoundly - before continuing their upward march.
Summary
Summing up, it seems that gold has formed a double-top pattern, just as the USD Index seems to have finally bottomed. Gold and silver have both reacted very strongly to the USDX developments, which has very bearish implications for the following days. The verifications of the very short-term breakdowns in gold and silver serve as bearish confirmations.
The miners have reversed this week on strong volume and practically right at the vertex-based reversal, and it all happened after they had flashed the extremely overbought signal through the Gold Miners Bullish Percent Index.
The implications are very bearish for the next several days - weeks.
Naturally, everyone's trading is their responsibility, but in our opinion, if there ever was a time to either enter a short position in the miners or to increase its size if it wasn't already sizable, it's now. We made money on the March decline and on the March rebound, and it seems that another massive slide is about to start. When everyone is on one side of the boat, it's a good idea to be on the other side, and the Gold Miners Bullish Percent Index literally indicates that this is the case with mining stocks.
After the sell-off (that takes gold below $1,600), we expect the precious metals to rally significantly. The final decline might take as little as 1-6 weeks, so it's important to stay alert to any changes. Especially that if gold repeats its 2011 performance, the very initial bottom could form as early as this week.
Most importantly - stay healthy and safe. We made a lot of money on the March decline and the subsequent rebound (its initial part) price moves (and we'll likely make much more in the following weeks and months), but you have to be healthy to really enjoy the results.
As always, we'll keep you - our subscribers - informed.
To summarize:
Trading capital (supplementary part of the portfolio; our opinion): Full speculative short positions (300% of the full position) in mining stocks is justified from the risk to reward point of view with the following binding exit profit-take price levels:
Senior mining stocks (price levels for the GDX ETF): binding profit-take exit price: $32.02; stop-loss: none (the volatility is too big to justify a SL order in case of this particular trade); binding profit-take level for the DUST ETF: $28.73; stop-loss for the DUST ETF: none (the volatility is too big to justify a SL order in case of this particular trade)
Junior mining stocks (price levels for the GDXJ ETF): binding profit-take exit price: $42.72; stop-loss: none (the volatility is too big to justify a SL order in case of this particular trade); binding profit-take level for the JDST ETF: $21.22; stop-loss for the JDST ETF: none (the volatility is too big to justify a SL order in case of this particular trade)
For-your-information targets (our opinion; we continue to think that mining stocks are the preferred way of taking advantage of the upcoming price move, but if for whatever reason one wants / has to use silver or gold for this trade, we are providing the details anyway. In our view, silver has greater potential than gold does):
Silver futures downside profit-take exit price: unclear at this time - initially, it might be a good idea to exit, when gold moves to $1,703.
Gold futures downside profit-take exit price: $1,703
Long-term capital (core part of the portfolio; our opinion): No positions (in other words: cash
Insurance capital (core part of the portfolio; our opinion): Full position
Whether you already subscribed or not, we encourage you to find out how to make the most of our alerts and read our replies to the most common alert-and-gold-trading-related-questions.
Please note that the in the trading section we describe the situation for the day that the alert is posted. In other words, it we are writing about a speculative position, it means that it is up-to-date on the day it was posted. We are also featuring the initial target prices, so that you can decide whether keeping a position on a given day is something that is in tune with your approach (some moves are too small for medium-term traders and some might appear too big for day-traders).
Plus, you might want to read why our stop-loss orders are usually relatively far from the current price.
Please note that a full position doesn't mean using all of the capital for a given trade. You will find details on our thoughts on gold portfolio structuring in the Key Insights section on our website.
As a reminder - "initial target price" means exactly that - an "initial" one, it's not a price level at which we suggest closing positions. If this becomes the case (like it did in the previous trade) we will refer to these levels as levels of exit orders (exactly as we've done previously). Stop-loss levels, however, are naturally not "initial", but something that, in our opinion, might be entered as an order.
Since it is impossible to synchronize target prices and stop-loss levels for all the ETFs and ETNs with the main markets that we provide these levels for (gold, silver and mining stocks - the GDX ETF), the stop-loss levels and target prices for other ETNs and ETF (among other: UGLD, DGLD, USLV, DSLV, NUGT, DUST, JNUG, JDST) are provided as supplementary, and not as "final". This means that if a stop-loss or a target level is reached for any of the "additional instruments" (DGLD for instance), but not for the "main instrument" (gold in this case), we will view positions in both gold and DGLD as still open and the stop-loss for DGLD would have to be moved lower. On the other hand, if gold moves to a stop-loss level but DGLD doesn't, then we will view both positions (in gold and DGLD) as closed. In other words, since it's not possible to be 100% certain that each related instrument moves to a given level when the underlying instrument does, we can't provide levels that would be binding. The levels that we do provide are our best estimate of the levels that will correspond to the levels in the underlying assets, but it will be the underlying assets that one will need to focus on regarding the signs pointing to closing a given position or keeping it open. We might adjust the levels in the "additional instruments" without adjusting the levels in the "main instruments", which will simply mean that we have improved our estimation of these levels, not that we changed our outlook on the markets. We are already working on a tool that would update these levels on a daily basis for the most popular ETFs, ETNs and individual mining stocks.
Our preferred ways to invest in and to trade gold along with the reasoning can be found in the how to buy gold section. Additionally, our preferred ETFs and ETNs can be found in our Gold & Silver ETF Ranking.
As a reminder, Gold & Silver Trading Alerts are posted before or on each trading day (we usually post them before the opening bell, but we don't promise doing that each day). If there's anything urgent, we will send you an additional small alert before posting the main one.
Thank you.
Sincerely,
Przemyslaw Radomski, CFA
Editor-in-chief, Gold & Silver Fund Manager

