

Briefly: in our opinion, full speculative short positions (250% of the regular position size) in gold, silver, and mining stocks are justified from the risk/reward point of view at the moment of publishing this Alert.
In yesterday's analysis, we wrote that the outlook for the precious metals sector remained bearish, and we wrote that if you've been wondering which parts of the precious metals sector are likely to decline the most, we would still choose silver and mining stocks.
Indeed, silver and miners plunged more than gold, especially the latter.
Yesterday in the PMs
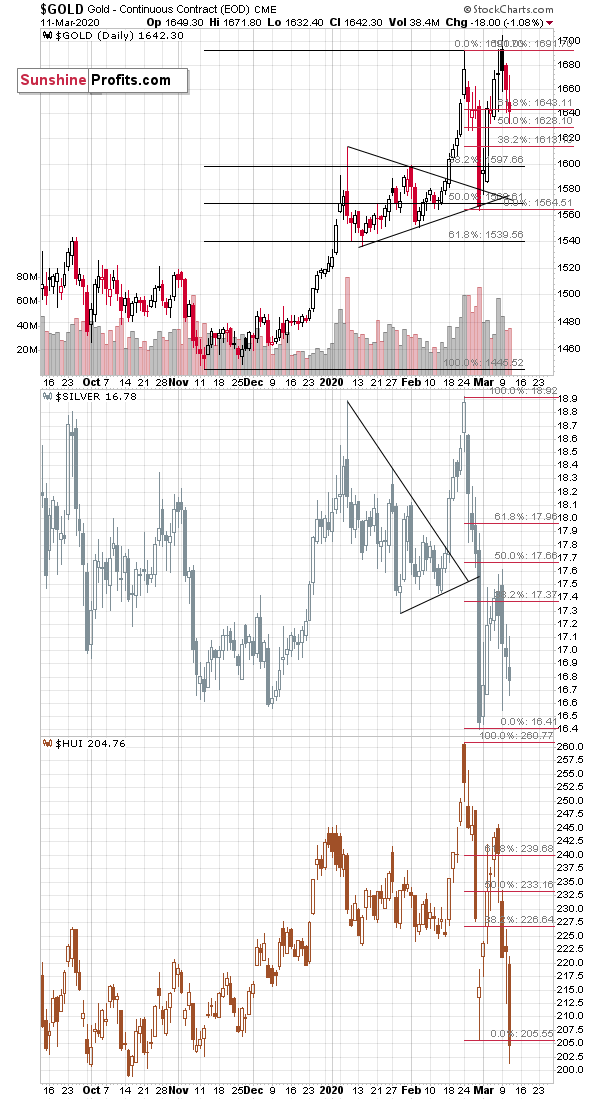
Just several days after many gold traders, gold investors, and goldbugs thought that the sharp decline was nothing more than a bad dream, the reality really kicked in. Sharp decline was followed by a sharp correction, especially in the mining stocks, but that was not the end of the story. Gold miners failed to break above the 61.8% Fibonacci retracement level, and they continued their slide. Anyone holding short positions in silver and miners benefited greatly (we entered our short positions in them and in gold on Feb 21st, a day before the top), and anyone insisting that silver and miners are going higher, is rather unhappy, to say the least.
The above chart also confirms the usefulness of the triangle-vertex-based reversals. Please note that both: gold and silver reversed right at the vertexes of their respective triangles. That happened, even though these triangles were not aligned. Gold's vertex was several days later, so it's not that surprising that gold made an intraday attempt to break above the previous high exactly then (the top in terms of the closing prices formed in February, though).
What's next? Miners are leading the way lower in an extremely clear manner. They moved to new yearly lows in terms of both the intraday and closing prices. In February, before the corrective upswing, miners reversed visibly before the end of the session, which was a bullish sign for the very short term. We haven't seen anything like that yesterday. Without this reversal, the slide could continue.
Taking a cue from the stock market, miners and silver have been declining strongly. And the stock market (S&P 500) just broke below the June and March 2019 lows. The next really strong support is provided by the 2018 lows.
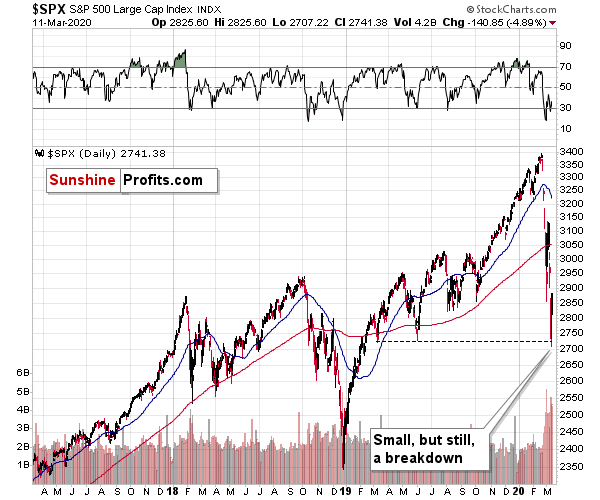
This means that as stocks slide, silver and especially miners, are likely to decline particularly strongly.
Looking at today's first chart, it may seem that gold stocks reached the bottom of their trading range and that the worst is over. But that's only a small part of the truth. In order to get more details, we need to... At least see more on the chart. Let's zoom out, and look at the mining stocks from a different perspective - using a different mining stock proxy. There's been much written on the topic of which proxy to use: HUI vs. GDX but in our view, it doesn't hurt (and it's a good gold trading tip in general) to look at both before making a decision.
On a side note, it is a major mistake to apply regular technical tools to leveraged ETNs like NUGT or DUST, because their prices move not only on emotions, but also based on mechanisms specific to these vehicles (time decay, fees, etc.)
Focus on the Miners
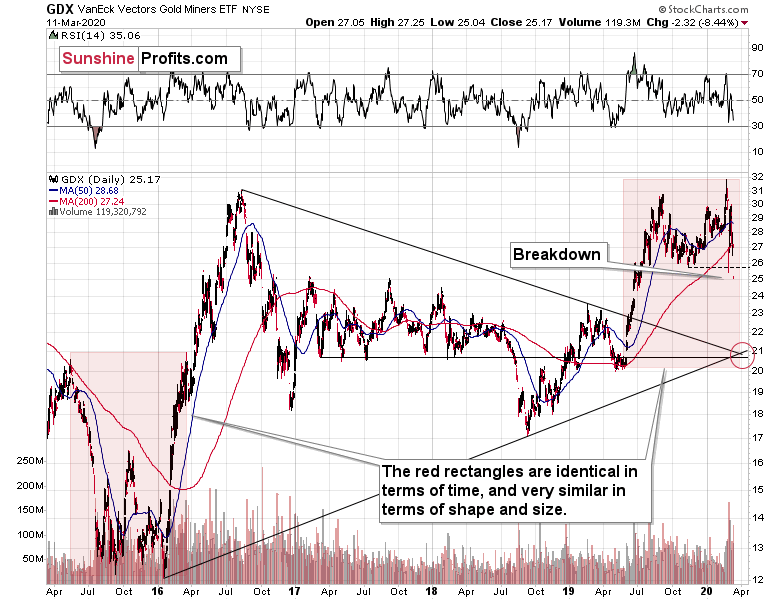
The medium-term GDX ETF chart reveals a major development. The miners just broke below their late-2019 lows. This was not the yearly low, so why would that be important? Because there's no really strong support all the way down until GDX reaches the $20 - $21 area.
Yes, it means doubling the recent GDX decline. And yes, it can and is likely to happen.
There's one more analogy that we would like to share with you. Please take a look at the price action in the two red rectangles. They are identical in terms of time and the current one is a bit smaller in terms of relative price movement.
They are very similar in terms of shape and - most likely - in terms of when they happened.
In 2015 and very early 2016, we saw the final part of the medium-term decline and the initial part of the short-term rebound. The decline was sharp at first, then miners consolidated, then they corrected, then they declined once again moving very temporarily to new lows and after invalidating this breakdown, they shot up with vengeance. And the reversal took place at the beginning of the year.
In 2019 and early 2020, we saw a mirror image of the above.
We saw the final part of the medium-term upswing and the initial part of the short-term decline. The rally was sharp at first, then miners consolidated, then they corrected, then they rallied once again moving very temporarily to new highs, and after they invalidated this breakout, they plunged with vengeance. And the reversal took place at the beginning of the year.
This similarity provides us with a few extra hints that other techniques don't.
It suggests that miners are unlikely to correct before they move even lower - likely to the price extreme that started the upswing (mid-2019 lows). At that price, we can expect a visible rebound, but it might not be anything to call home about - similar to the consolidation that we saw in March 2016. It might, however, be something similar to the very sharp and sizable correction that we saw so far this month, so it will be critical to monitor the market for indications.
The mid-2019 lows are a very good target also based on other reasons:
- Several 2017 and 2018 highs formed there (approximately)
- That's where (approximately) the declining support line based on the previous highs is located
- That's where (approximately) the rising support line based on the previous lows is located
Moreover, the two above-mentioned support lines cross close to the end of March, meaning that this is when the reversal could take place. Earlier today, we emphasized how well this technique worked in case of tops in gold and silver. While no technique can be 100% effective, it seems we have a good chance of seeing a temporary reversal close to the end of the month. The outlook is definitely bearish.
Please note that the end of March in case of the GDX fits very well the triangle-vertex-based reversal in gold that is scheduled for early April (that we covered in this week's flagship Gold & Silver Trading Alert). Miners could simply bottom a bit sooner than gold.
Summary
Summing up, the 2020 top in the precious metals market is most likely in. Gold declined on record-breaking volume, while silver and miners plunged to new yearly lows - and it happened even before the USD's rally resumed. During the rebound, silver and mining stocks continued to show weakness. The outlook for the following months is extremely bearish, especially that even gold failed to really react to what happened recently. All of the following factors: dramatic increase in the fear of coronavirus, crude oil turmoil, and an extreme shift in market's expectations regarding interest rates, should have caused gold to soar, and the only thing that it was able to do, was to test its recent highs.
On one hand, the situation is similar to what happened in 2008 - the Fed is trying desperately to cut rates and prevent the market from sliding, and it's not really working. On the other hand, there are very visible similarities to how gold performed at and immediately after its 2011 top. Implications of both analogies are very bearish for the following weeks and months.
The profits on our big short position in the precious metals market are already sizable (not in gold, but they are huge in case of the silver and miners), and they are likely to become enormous in the following weeks.
As always, we'll keep you - our subscribers - informed.
To summarize:
Trading capital (supplementary part of the portfolio; our opinion): Full speculative short positions (250% of the full position) in gold, silver, and mining stocks are justified from the risk/reward perspective with the following stop-loss orders and binding exit profit-take price levels:
- Gold futures: profit-take exit price: $1,422; stop-loss: $1,712; initial target price for the DGLD ETN: $33.30; stop-loss for the DGLD ETN: $19.88
- Silver futures: profit-take exit price: $14.63; stop-loss: none (if gold moved to $1,712 we would view silver positions as no longer valid); initial target price for the DSLV ETN: $26.10; stop-loss for the DSLV ETN: none (if gold moved to $1,712 we would view silver positions as no longer valid)
- Mining stocks (price levels for the GDX ETF): profit-take exit price: $20.22; stop-loss: $29.51; initial target price for the DUST ETF: $11.29; stop-loss for the DUST ETF $4.25
In case one wants to bet on junior mining stocks' prices, here are the stop-loss details and target prices:
- GDXJ ETF: profit-take exit price: $28.32; stop-loss: $42.12
- JDST ETF: profit-take exit price: $20.97; stop-loss: $7.84
Long-term capital (core part of the portfolio; our opinion): No positions (in other words: cash)
Insurance capital (core part of the portfolio; our opinion): Full position
Whether you already subscribed or not, we encourage you to find out how to make the most of our alerts and read our replies to the most common alert-and-gold-trading-related-questions.
Please note that the in the trading section we describe the situation for the day that the alert is posted. In other words, it we are writing about a speculative position, it means that it is up-to-date on the day it was posted. We are also featuring the initial target prices, so that you can decide whether keeping a position on a given day is something that is in tune with your approach (some moves are too small for medium-term traders and some might appear too big for day-traders).
Plus, you might want to read why our stop-loss orders are usually relatively far from the current price.
Please note that a full position doesn't mean using all of the capital for a given trade. You will find details on our thoughts on gold portfolio structuring in the Key Insights section on our website.
As a reminder - "initial target price" means exactly that - an "initial" one, it's not a price level at which we suggest closing positions. If this becomes the case (like it did in the previous trade) we will refer to these levels as levels of exit orders (exactly as we've done previously). Stop-loss levels, however, are naturally not "initial", but something that, in our opinion, might be entered as an order.
Since it is impossible to synchronize target prices and stop-loss levels for all the ETFs and ETNs with the main markets that we provide these levels for (gold, silver and mining stocks - the GDX ETF), the stop-loss levels and target prices for other ETNs and ETF (among other: UGLD, DGLD, USLV, DSLV, NUGT, DUST, JNUG, JDST) are provided as supplementary, and not as "final". This means that if a stop-loss or a target level is reached for any of the "additional instruments" (DGLD for instance), but not for the "main instrument" (gold in this case), we will view positions in both gold and DGLD as still open and the stop-loss for DGLD would have to be moved lower. On the other hand, if gold moves to a stop-loss level but DGLD doesn't, then we will view both positions (in gold and DGLD) as closed. In other words, since it's not possible to be 100% certain that each related instrument moves to a given level when the underlying instrument does, we can't provide levels that would be binding. The levels that we do provide are our best estimate of the levels that will correspond to the levels in the underlying assets, but it will be the underlying assets that one will need to focus on regarding the signs pointing to closing a given position or keeping it open. We might adjust the levels in the "additional instruments" without adjusting the levels in the "main instruments", which will simply mean that we have improved our estimation of these levels, not that we changed our outlook on the markets. We are already working on a tool that would update these levels on a daily basis for the most popular ETFs, ETNs and individual mining stocks.
Our preferred ways to invest in and to trade gold along with the reasoning can be found in the how to buy gold section. Additionally, our preferred ETFs and ETNs can be found in our Gold & Silver ETF Ranking.
As a reminder, Gold & Silver Trading Alerts are posted before or on each trading day (we usually post them before the opening bell, but we don't promise doing that each day). If there's anything urgent, we will send you an additional small alert before posting the main one.
Thank you.
Sincerely,
Przemyslaw Radomski, CFA
Editor-in-chief, Gold & Silver Fund Manager

