

Briefly: in our opinion, full (250% of the regular position size) speculative short positions in mining stocks are justified from the risk/reward point of view at the moment of publishing this Alert.
Yesterday's price action was quite specific. Gold moved higher, but that's pretty much it. Neither silver, nor miners confirmed gold's strength, so even at first glance this situation already appears different from the ones when gold several times bounced from the $1,680s and moved higher once again.
Let's start with the most bullish action and see if it really indicates strength on the horizon.
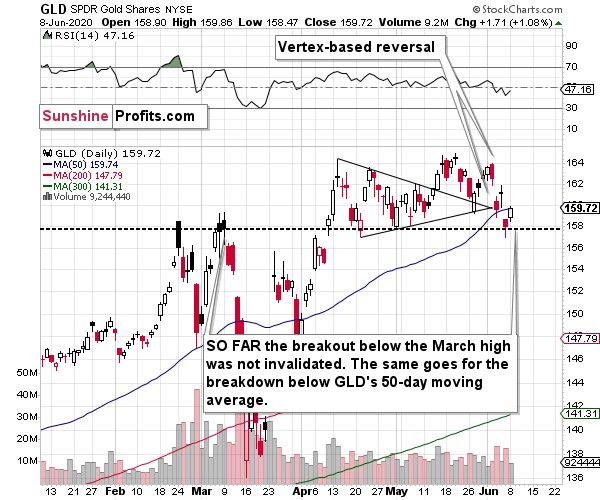
In short, not really. What's bullish about the GLD ETF chart is not yesterday's daily upswing, but the fact that it didn't break below the March high, and we already wrote about it previously:
Last week, we wrote that we had a good indication from the GLD ETF that the rally is about to end today. This was the case due to the triangle-vertex-based reversal that we then. This trading technique has proven to be useful many times in the previous months, so it was worth to be worth to pay attention to its indications also that time.
Right now, we can say the same thing about the RSI indicator and the buy signal in the USD Index - it's definitely worth to pay attention to it.
As far as the GLD ETF is concerned, we haven't seen invalidation of the breakout above the March high just yet, which might be a partial explanation as to why gold is up a bit in today's pre-market trading and as to why the mining stocks didn't decline more on Friday (the other reason being the rally in the stock market). This doesn't imply that the decline is over, but rather indicates that when GLD closes below this all-important level, the huge slide will follow. Given how likely an upswing in the USD Index is, GLD is likely to break lower soon; likely this week.
GLD moved higher, but please note that it didn't move back above its 50-day moving average after it broke below it. What we saw yesterday, might have been just a verification of this breakdown. GLD did manage to close back above the early-June low, but rather insignificantly so.
What's more interesting than seeing gold's moves on a stand-alone basis, is their comparison with what happened in the USD Index.
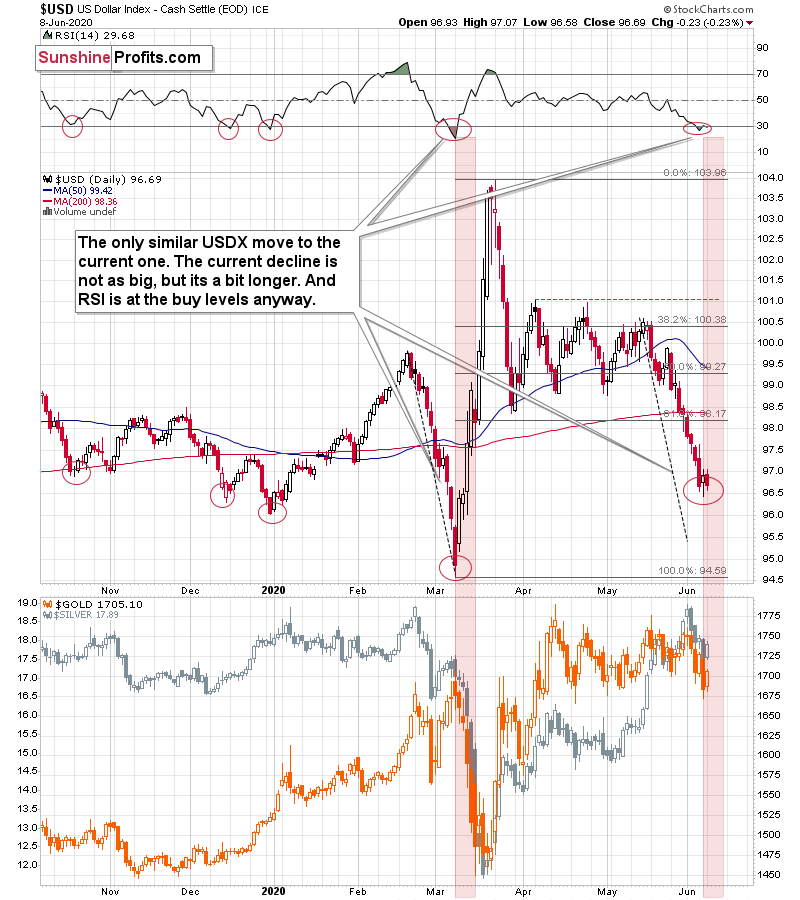
The USD Index ended yesterday's session lower, but it didn't move to new intraday lows. Overall it ended the day more or less, where it had closed on Thursday. And where are gold and silver compared to where they closed on Thursday? Both precious metals closed lower.
This, plus the fact that the USD Index appears to have bottomed and is now ready to rally once again, suggest that PMs are about to slide further.
And it's not only the RSI indicator that is confirming that the USDX bottom is already in. The USDX has broken above its declining resistance line as well.
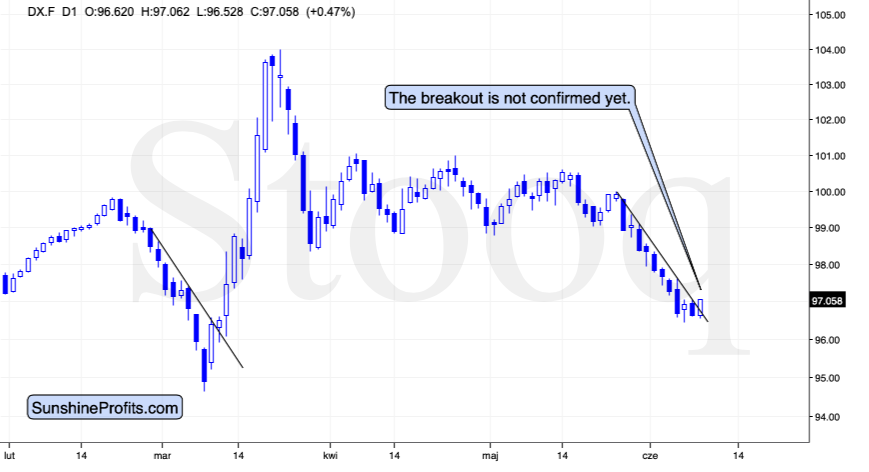
This move is not confirmed as the day is not even close to being over (in fact, we're writing this before U.S. markets' opening bell), but it's already clear that something has changed.
Back in March, it was the USD breakout that either confirmed, or started the really big moves (depending on the way one looks at it and what one defines as a big move), and we're starting to see this major development once again.
Please focus on the previous chart once again. The area that we marked with red, is gold's decline. Please note that during the first few days gold declined relatively insignificantly, and the really big move followed a bit later. Gold declined the most (and most sharply) during the middle of USD's rally. And once gold stopped declining despite USD's rally, it was time to get back on the long side.
We are not in any of the above-mentioned moments. The rally in the USDX seems to be only beginning.
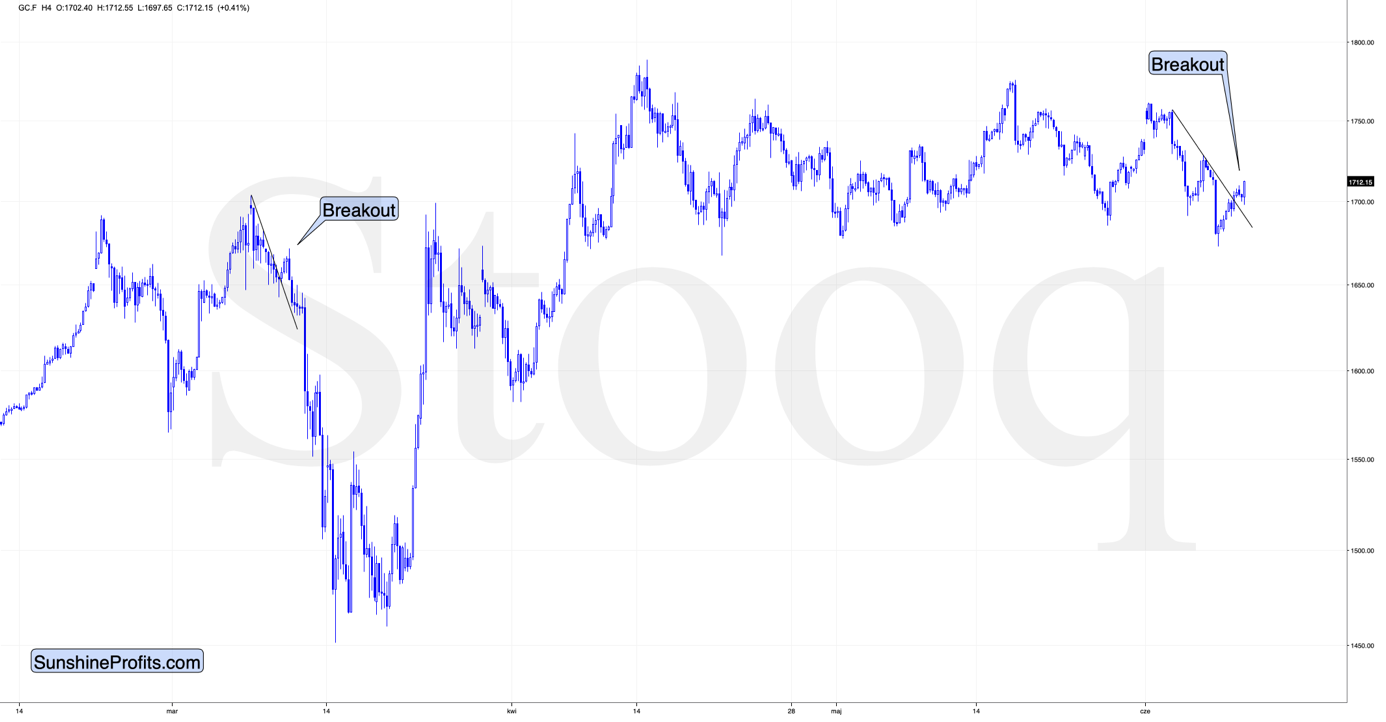
On an intraday basis, we see some strength in gold. This is encouraging, until you check that we saw something similar in the first half of March, which is when the USD Index was also breaking above its declining resistance line.
This doesn't make the current breakout bearish, but it does negate its bearish implications.
What is bearish, is that miners have almost completely ignored yesterday's move higher in gold.
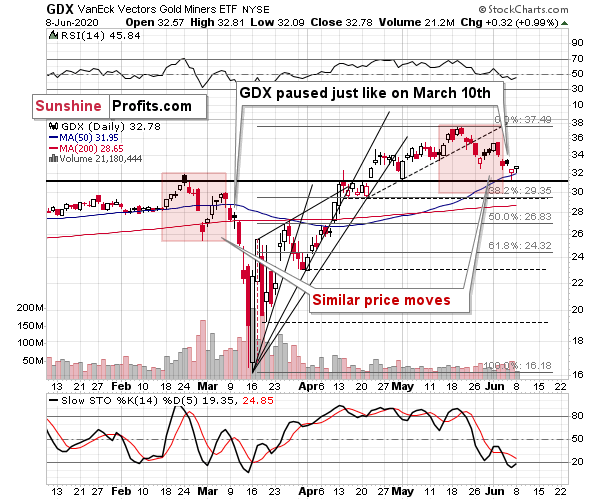
As you can see, the GDX ETF moved higher, but the move was tiny (compared to the size of the previous decline), and it was accompanied by minuscule volume. The last time we saw a relatively clear move higher on tiny volume was on June 1. We commented on that move in the following way:
Miners moved higher yesterday, and they did so on very low volume. There were times, when the volume in the miners was even lower, but that was when miners have not really moved much higher. During yesterday's session, the discrepancy between higher prices and low volume was particularly significant.
Miners moved lower shortly, and we think another move lower is likely in the cards as well. It might not happen immediately, but it's definitely likely to take place this week.
Summary
Summing up, the tops in gold, silver, and mining stocks appear to be already in, and the decline is likely to accelerate shortly. The outlook for the precious metals market is bearish for the next few weeks, and it's very bullish for the following months. Even if gold, silver, and mining stocks are not going to move to new 2020 lows, they are still likely to decline visibly when the USD Index soars.
After the sell-off (that takes gold below $1,400), we expect the precious metals to rally significantly. The final decline might take as little as 1-3 weeks, so it's important to stay alert to any changes.
Most importantly - stay healthy and safe. We made a lot of money on the March decline and the subsequent rebound (its initial part) price moves (and we'll likely make much more in the following weeks and months), but you have to be healthy to really enjoy the results.
As always, we'll keep you - our subscribers - informed.
To summarize:
Trading capital (supplementary part of the portfolio; our opinion): Full speculative short positions (250% of the full position) in mining stocks is justified from the risk to reward point of view with the following binding exit profit-take price levels:
Senior mining stocks (price levels for the GDX ETF): binding profit-take exit price: $10.32; stop-loss: none (the volatility is too big to justify a SL order in case of this particular trade); binding profit-take level for the DUST ETF: $231.75; stop-loss for the DUST ETF: none (the volatility is too big to justify a SL order in case of this particular trade)
Junior mining stocks (price levels for the GDXJ ETF): binding profit-take exit price: $9.57; stop-loss: none (the volatility is too big to justify a SL order in case of this particular trade); binding profit-take level for the JDST ETF: $284.25; stop-loss for the JDST ETF: none (the volatility is too big to justify a SL order in case of this particular trade)
For-your-information targets (our opinion; we continue to think that mining stocks are the preferred way of taking advantage of the upcoming price move, but if for whatever reason one wants / has to use silver or gold for this trade, we are providing the details anyway. In our view, silver has greater potential than gold does):
Silver futures downside profit-take exit price: $8.58 (the downside potential for silver is significant, but likely not as big as the one in the mining stocks)
Gold futures downside profit-take exit price: $1,382 (the target for gold is least clear; it might drop to even $1,170 or so; the downside potential for gold is significant, but likely not as big as the one in the mining stocks or silver)
Long-term capital (core part of the portfolio; our opinion): No positions (in other words: cash
Insurance capital (core part of the portfolio; our opinion): Full position
Whether you already subscribed or not, we encourage you to find out how to make the most of our alerts and read our replies to the most common alert-and-gold-trading-related-questions.
Please note that the in the trading section we describe the situation for the day that the alert is posted. In other words, it we are writing about a speculative position, it means that it is up-to-date on the day it was posted. We are also featuring the initial target prices, so that you can decide whether keeping a position on a given day is something that is in tune with your approach (some moves are too small for medium-term traders and some might appear too big for day-traders).
Plus, you might want to read why our stop-loss orders are usually relatively far from the current price.
Please note that a full position doesn't mean using all of the capital for a given trade. You will find details on our thoughts on gold portfolio structuring in the Key Insights section on our website.
As a reminder - "initial target price" means exactly that - an "initial" one, it's not a price level at which we suggest closing positions. If this becomes the case (like it did in the previous trade) we will refer to these levels as levels of exit orders (exactly as we've done previously). Stop-loss levels, however, are naturally not "initial", but something that, in our opinion, might be entered as an order.
Since it is impossible to synchronize target prices and stop-loss levels for all the ETFs and ETNs with the main markets that we provide these levels for (gold, silver and mining stocks - the GDX ETF), the stop-loss levels and target prices for other ETNs and ETF (among other: UGLD, DGLD, USLV, DSLV, NUGT, DUST, JNUG, JDST) are provided as supplementary, and not as "final". This means that if a stop-loss or a target level is reached for any of the "additional instruments" (DGLD for instance), but not for the "main instrument" (gold in this case), we will view positions in both gold and DGLD as still open and the stop-loss for DGLD would have to be moved lower. On the other hand, if gold moves to a stop-loss level but DGLD doesn't, then we will view both positions (in gold and DGLD) as closed. In other words, since it's not possible to be 100% certain that each related instrument moves to a given level when the underlying instrument does, we can't provide levels that would be binding. The levels that we do provide are our best estimate of the levels that will correspond to the levels in the underlying assets, but it will be the underlying assets that one will need to focus on regarding the signs pointing to closing a given position or keeping it open. We might adjust the levels in the "additional instruments" without adjusting the levels in the "main instruments", which will simply mean that we have improved our estimation of these levels, not that we changed our outlook on the markets. We are already working on a tool that would update these levels on a daily basis for the most popular ETFs, ETNs and individual mining stocks.
Our preferred ways to invest in and to trade gold along with the reasoning can be found in the how to buy gold section. Additionally, our preferred ETFs and ETNs can be found in our Gold & Silver ETF Ranking.
As a reminder, Gold & Silver Trading Alerts are posted before or on each trading day (we usually post them before the opening bell, but we don't promise doing that each day). If there's anything urgent, we will send you an additional small alert before posting the main one.
Thank you.
Sincerely,
Przemyslaw Radomski, CFA
Editor-in-chief, Gold & Silver Fund Manager

