

Briefly: in our opinion, full (300% of the regular position size) speculative short positions in junior mining stocks are justified from the risk/reward point of view at the moment of publishing this Alert.
The recent developments in the gold market are mostly invalidations. However, they do not only come from the USDX, which usually affects the price of the yellow metal the most.
Today’s technical analysis once again takes the video format:
Having (literally) said that, let’s take a look at the markets from a more fundamental point of view.
Who Was the Worst Performer?
With the S&P 500 selling off on Dec. 5, the gold price followed suit; and with the USD Index and the U.S. 10-Year real yield rallying, risk off reigned on Wall Street. Moreover, with the bearish price action aligning with the hawkish payrolls print from Dec. 2, the reality is that more of the same is required to curb inflation.
Please see below:
 Source: Goldman Sachs
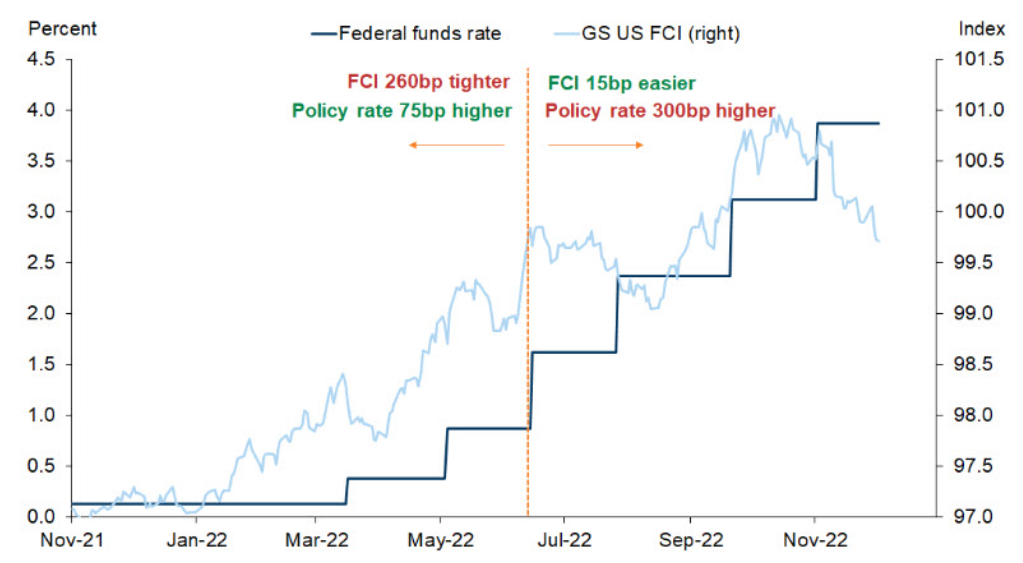
To explain, the dark blue line above tracks the U.S. federal funds rate (FFR), while the light blue line above tracks the Goldman Sachs Financial Conditions Index (FCI). For context, tighter financial conditions uplift the light blue line, with the ascent driven by higher interest rates, a stronger U.S. dollar, wider credit spreads and lower stock prices.
Furthermore, a higher FFR is extremely bullish for the FCI, though, if you analyze the right side of the chart, you can see that the FCI has declined dramatically, even as the FFR seeks higher ground.
Consequently, the pair's behavior mirrors the divergence that occurred in July/August, and unsurprisingly, the period culminated with the PMs and the S&P 500's previous bear market rallies. Yet, it wasn't long before the FCI hit new 2022 highs in September/October and risk assets suffered.
As it stands, the important point is not the correlation between the two lines; it's about the economic reality required to stabilize inflation. When the Fed increases the FFR, the central bank aims to increase the cost of debt and reduce consumption. In contrast, when the FCI doesn't accommodate, it reduces the FFR's effectiveness and makes the Fed's inflation fight more difficult.
So, while I warned throughout 2021 and 2022 that the fundamental outlooks were bullish for the FFR, real yields and the USD Index, nothing has changed: the FFR needs to rise materially to normalize inflation, and the recent pullback in the FCI should culminate with higher highs before this bear market ends.
To that point, with more hawkish data hitting the wire on Dec. 5, resilient growth, employment and consumer spending continue to unfold as expected. For example, the ISM released its Services PMI, and an excerpt read:
“In November, the Services PMI registered 56.5 percent, a 2.1-percentage point increase compared to the October reading of 54.4 percent. The 12-month average is 57.2 percent, reflecting consistently strong growth in the services sector, which has expanded for 30 consecutive months.”
More importantly:
“Employment activity in the services sector grew in November after contracting in October. ISM’s Employment Index registered 51.5 percent, up 2.4 percentage points from the October reading of 49.1 percent. Comments from respondents include: ‘slow improvement in staffing levels’ and ‘recruitment fairs have helped enable open positions to be filled.’”
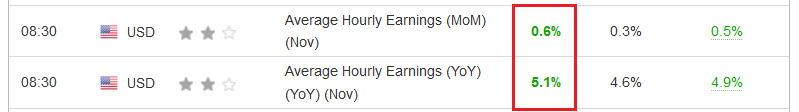
Thus, with demand still outweighing supply in the U.S. labor market, the fundamental backdrop is highly bullish for wage inflation. Moreover, the average hourly earnings (AHE) print on Dec. 2 proved that point. I wrote on Dec. 5:
 Source: Investing.com
AHE increased by 0.8% month-over-month (MoM) in November, which was more than double the consensus estimate of 0.3% MoM. Likewise, the 5.1% year-over-year (YoY) increase also surpassed the 4.6% YoY estimate.
As a result, the crowd materially underestimates the resiliency of inflation and the measures required to control the pricing pressures. The ISM report added:
“The Business Activity Index registered 64.7 percent, a substantial increase of 9 percentage points compared to the reading of 55.7 percent in October.”
Please see below:
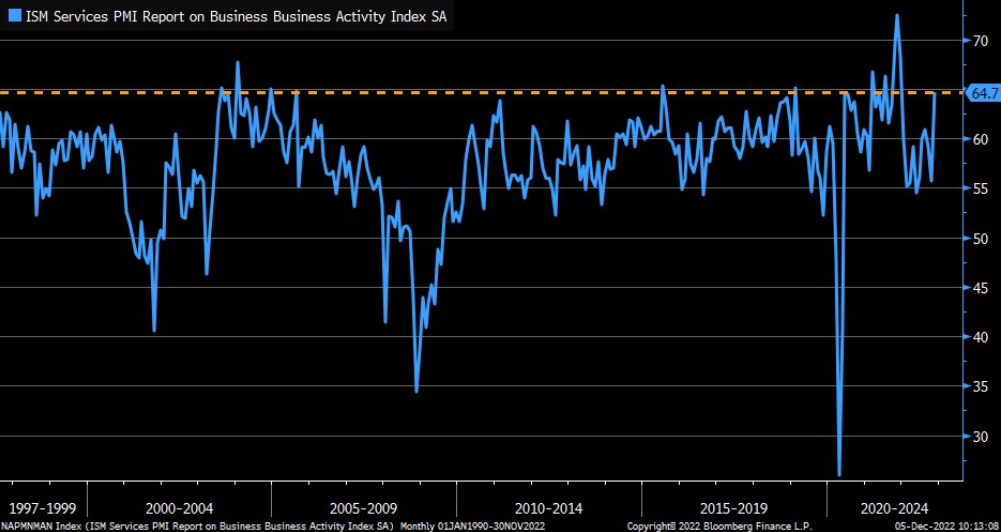
To explain, the blue line above tracks the ISM’s Business Activity Index, and the sharp rise on the right side of the chart highlights the strength realized in November. So, while gold is priced for a dovish pivot, the fundamental reality is much different.
Also, S&P Global released its U.S. Manufacturing and Services PMIs on Dec. 1 and Dec. 5; and while both headline indexes dipped into contraction, the employment results were relatively bullish for the FFR.
The manufacturing PMI report read:
“Although firms continued to fill long-held vacancies, numerous companies noted that
voluntary leavers were not replaced in order to reduce cost overheads. Employment rose at the joint-slowest pace since January.”
The services PMI report read:
“Despite a reduction in pressure on capacity, firms continued to hire midway through the fourth quarter. Nonetheless, where job creation was noted, firms largely attributed this
to the filling of long-held vacancies. The uptick in staffing numbers was only marginal and the second-slowest since September 2020.”
As a result, while hiring has moderated, any uptick in staffing is hawkish when the unemployment rate is at a ~50-year low. Remember, the Fed needs to increase the unemployment rate to reduce wage and output inflation; and with the labor force participation rate declining as payrolls increase, it's the opposite of the Fed's desired outcome.
As such, it will take a major collapse in inflation, employment and economic activity to spur a dovish pivot, and we're nowhere near that scenario right now.
On top of that, Mastercard released its SpendingPulse U.S. Thanksgiving retail sales report on Nov. 29. An excerpt read:
“Shoppers drove U.S. retail sales during the Thanksgiving weekend up +10.9% YoY excluding auto…. In-store sales increased +10.5% YoY while e-commerce continued to experience strong growth up +12.5% YoY for the weekend running Thursday, November 24 through Sunday, November 27.”
Michelle Meyer, North America Chief Economist at the Mastercard Economics Institute, added:
“Not only did consumers get their holiday shopping in this weekend but they also dined out with family and friends. Restaurants did particularly well, reinforcing consumer demand for the experience economy.”
Please see below:
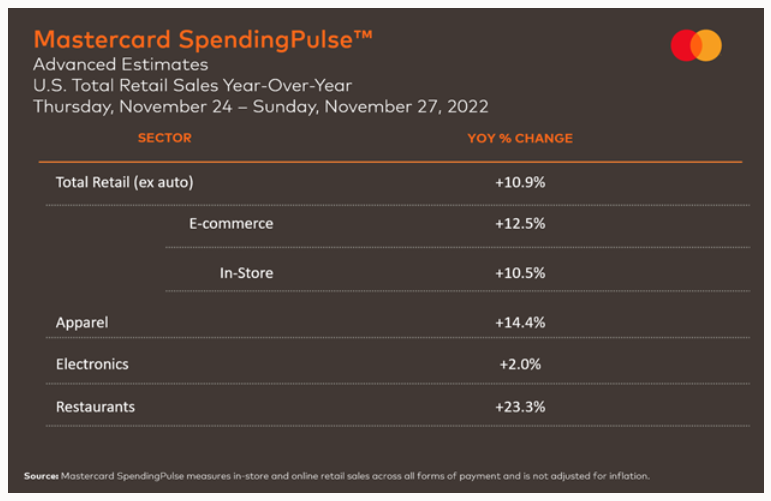
Overall, while I warned for many months that demand was much stronger than the consensus realized, Americans’ ability and willingness to spend should keep inflation uplifted and drag the FFR higher. Therefore, while the gold price implies that rate cuts and QE are on the horizon, don’t be surprised if those hopes are dashed and a substantial drawdown occurs.
The Silver Price
It was a sea of red across the financial markets on Dec. 5, and it’s no surprise that the S&P 500’s weakness coincided with sharp declines in silver and mining stocks. Moreover, I’ve noted on numerous occasions how the pair are more correlated to the S&P 500 than gold, which makes the index an important variable in our medium-term thesis.
However, with stock prices in la-la land, little to no fundamental risk is priced in despite the ominous fundamental backdrop.
Please see below:
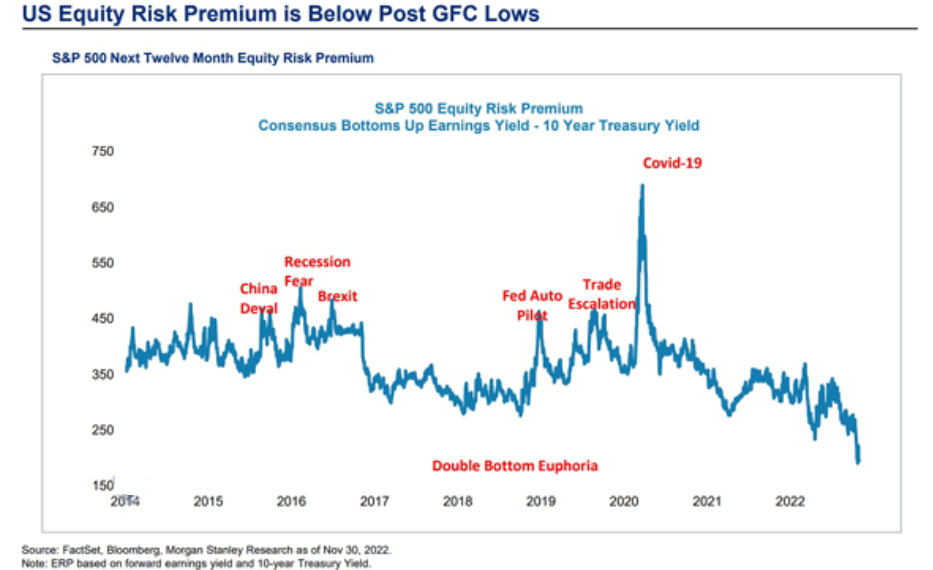
To explain, the blue line above tracks the S&P 500's equity risk premium (ERP), which is calculated by subtracting the U.S. 10-Year Treasury yield from analysts' consensus 12-month earnings yield. In a nutshell: when the blue line declines, it means that the U.S. 10-Year Treasury yield is increasing at a faster pace than corporate earnings as a percentage of their stock prices.
Furthermore, if you analyze the right side of the chart, you can see that the blue line has sunk like a stone. Therefore, stock prices haven't declined enough, and investors are paying a premium for an asset with more risk.
Consequently, the data highlights investors' willingness to overlook inflation, higher interest rates and the potential for a 2023 recession. But, the sharp spikes in the blue line highlight how quickly things can change. Even if we exclude the COVID-19-induced rise, less treacherous fundamental environments culminated with ERPs that exceeded 450 basis points; and with the current reading closer to 200 basis points, the metric should have plenty of room to run.
On top of that, while bear market fatigue often creates pathways for short-term rallies, the S&P 500's mauling is still relatively immature.
Please see below:
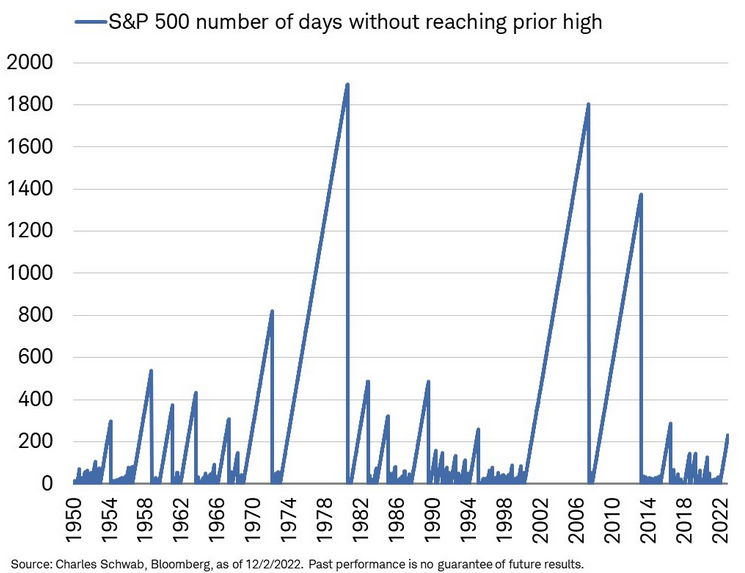
To explain, the blue line above tracks the number of days it took the S&P 500 to reach its previous high when historical downtrends occurred. If you analyze the right side of the chart, you can see that the current bear market has lasted a little more than 200 days.
Yet, historical readings show that plenty of downtrends lasted 400 days or more, and the severe bear markets of ~1974, ~2000 and ~2008 lasted more than 1,200 days. Also, with the current inflation backdrop similar to ~1970 (~800 days) and ~1974 (~1,900 days), it’s laughable to assume that the bear market is over when inflation is at a ~40-year high and the unemployment rate is at a ~50-year low.
As such, with the metrics poised for a reversal of fortunes in 2023 (high unemployment needed for low inflation), silver should suffer mightily before it’s all said and done.
In addition, while the crowd assumes that inflation will decelerate with little economic damage, history implies that a much higher FFR is needed than currently expected.
Please see below:
 Source: The Daily Shot
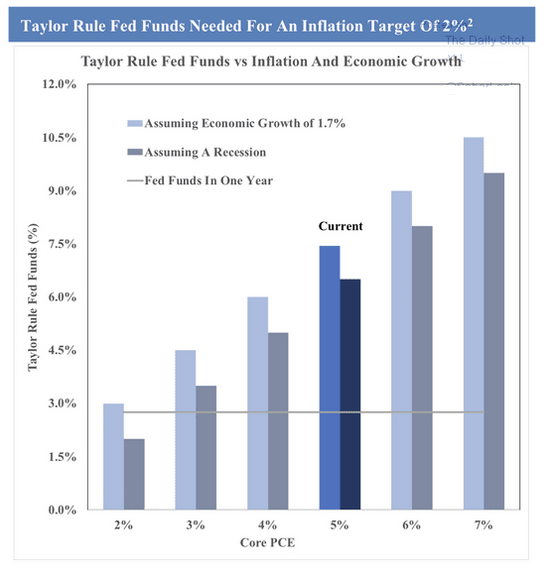
To explain, the Taylor Rule opines that the FFR needs to hit ~7.5% to curb inflation, assuming real GDP growth of 1.7%. For context, Q3 real GDP growth came in at 2.9%, so the metric is already above that level.
More importantly, the dark blue bar in the middle shows how the FFR would need to hit ~6% even if a recession occurs; and with every inflation fight since 1954 ending with a recession, it's the most likely long-term outcome.
So, with investors underpricing the peak FFR and the odds of a recession, the silver price is unlikely to respond well to a 6% FFR and an economic malaise. Consequently, more downside should confront the PMs in the months ahead, and silver and mining stocks should be the hardest hit.
Overall, the fundamental backdrop remains profoundly bearish, and silver's sharp sell-off on Dec. 5 highlights investors' anxiety. With bullish seasonality the only thing supporting higher prices, sentiment has driven the recent rally, and it often has a short shelf-life. Thus, when the algorithms turn, the silver price's slide could be climactic.
Quietly Climbing
After the Consumer Price Index (CPI) release on Nov. 10 lit a fire under risk assets and depressed rate hike expectations, the former have remained uplifted. However, with the latter climbing back above 5% on Dec. 5, investors are ignoring the prospect of a higher FFR at their own peril.
Please see below:
 Source: Bloomberg/ZeroHedge
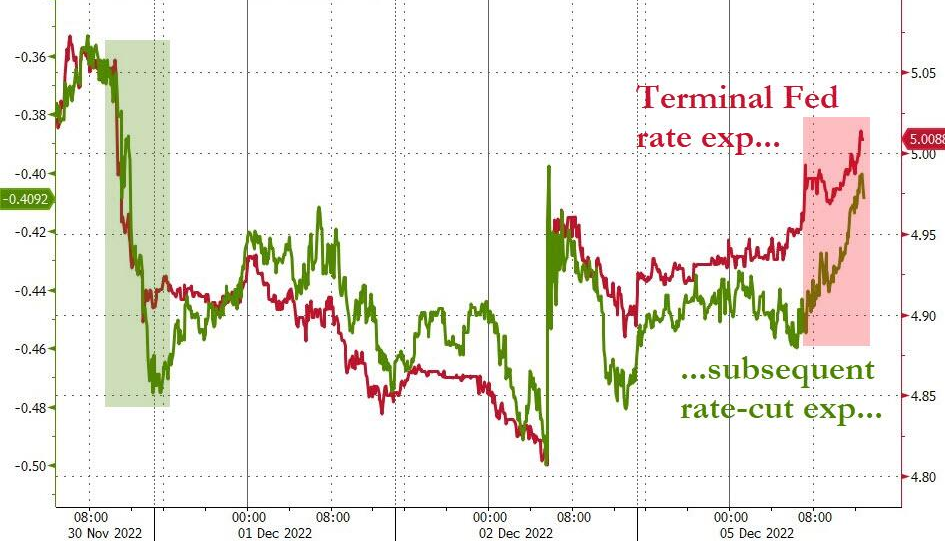
To explain, the red line above tracks the peak FFR implied by the futures market, while the green line above tracks the inverted (down means up) rate cuts priced in thereafter. If you analyze the left side of the chart, you can see that when Fed Chairman Jerome Powell said on Nov. 30 that “moderating the pace of rate increases may come as soon as the December meeting,” rate hike expectations fell and rate cut expectations rose.
Conversely, with hawkish data hitting the wire in recent days, rate hike expectations have increased, while rate cut expectations have decreased; and with the red line poised to hit a new high in the months ahead, risk assets should take notice sooner rather than later.
The Bottom Line
Risk assets fell hard on Dec. 5, and the GDXJ ETF was among the worst performers. However, with gold, silver, mining stocks and the S&P 500 still priced well above their fundamental values, higher interest rates and a likely recession should evaporate their optimism over the medium term.
Therefore, while bullish seasonality may uplift short-term sentiment, the economic issues that confront the financial markets can’t be solved by Powell’s words or investors’ hopes. As a result, reality should reign during the winter months, and the PMs will likely be left out in the cold.
In conclusion, the PMs declined on Dec. 5, as the USD Index and the U.S. 10-Year real yield reasserted themselves. But, with the bulls desperate for a Santa Clause rally, it may take more than a little pessimism to break their Christmas spirit. In contrast, the medium term should be a much different story.
Overview of the Upcoming Part of the Decline
- It seems to me that the corrective upswing is over (or about to be over) and that the next big move lower is already underway (or that it’s about to start).
- If we see a situation where miners slide in a meaningful and volatile way while silver doesn’t (it just declines moderately), I plan to – once again – switch from short positions in miners to short positions in silver. At this time, it’s too early to say at what price levels this could take place and if we get this kind of opportunity at all – perhaps with gold prices close to $1,500 - $1,550.
- I plan to switch from the short positions in junior mining stocks or silver (whichever I’ll have at that moment) to long positions in junior mining stocks when gold / mining stocks move to their 2020 lows (approximately). While I’m probably not going to write about it at this stage yet, this is when some investors might consider getting back in with their long-term investing capital (or perhaps 1/3 or 1/2 thereof).
- I plan to return to short positions in junior mining stocks after a rebound – and the rebound could take gold from about $1,450 to about $1,550, and it could take the GDXJ from about $20 to about $24. In other words, I’m currently planning to go long when GDXJ is close to $20 (which might take place when gold is close to $1,450), and I’m planning to exit this long position and re-enter the short position once we see a corrective rally to $24 in the GDXJ (which might take place when gold is close to $1,550).
- I plan to exit all remaining short positions once gold shows substantial strength relative to the USD Index while the latter is still rallying. This may be the case with gold prices close to $1,400 and GDXJ close to $15 . This moment (when gold performs very strongly against the rallying USD and miners are strong relative to gold after its substantial decline) is likely to be the best entry point for long-term investments, in my view. This can also happen with gold close to $1,400, but at the moment it’s too early to say with certainty.
- The above is based on the information available today, and it might change in the following days/weeks.
You will find my general overview of the outlook for gold on the chart below:
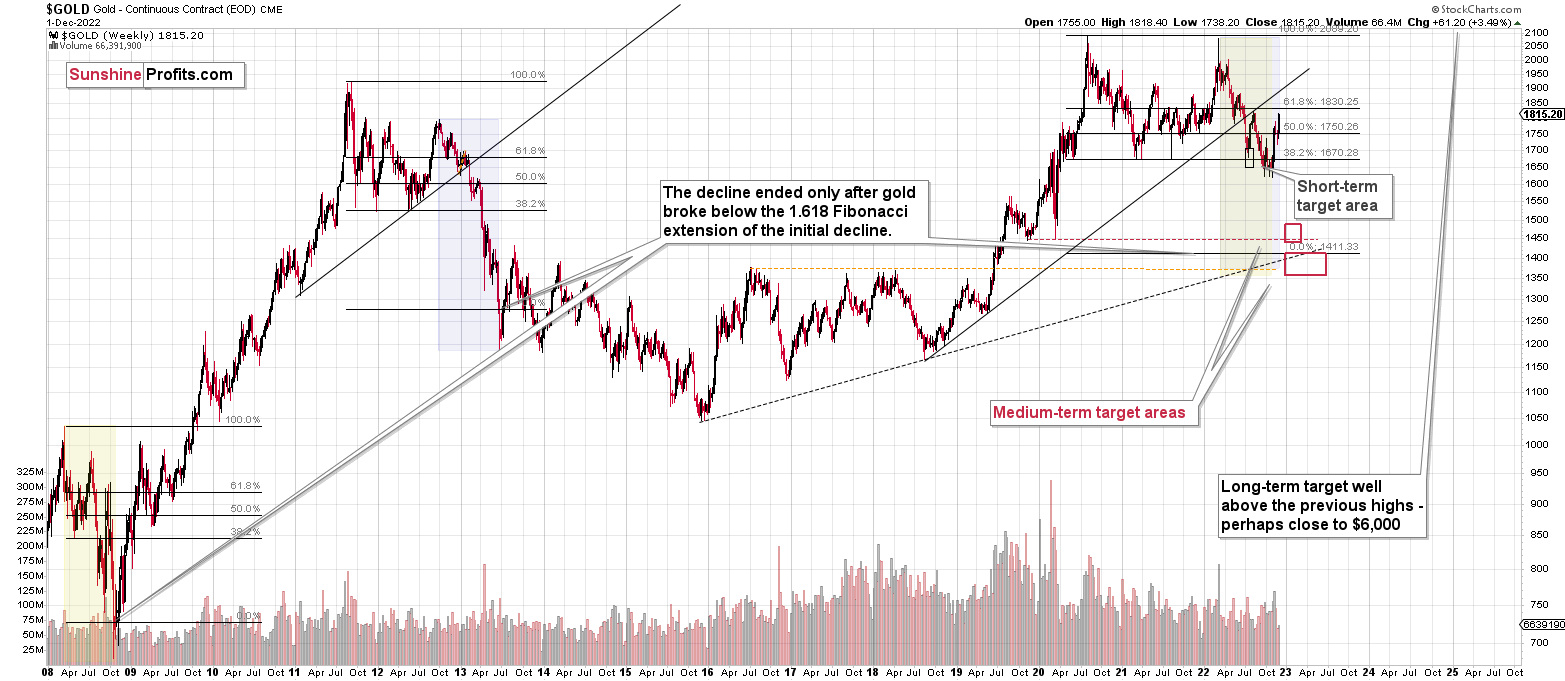
Please note that the above timing details are relatively broad and “for general overview only” – so that you know more or less what I think and how volatile I think the moves are likely to be – on an approximate basis. These time targets are not binding nor clear enough for me to think that they should be used for purchasing options, warrants, or similar instruments.
Letters to the Editor
There are no new letters for today, but I wanted to keep the below reminder in place, just to make sure that everyone had the chance to see it:
Please note that this section is going to go away within the next 1-8 weeks, as you can add comments/questions below the article on Golden Meadow – the platform that we’re using to provide our analyses. Your notification e-mails include an invitation link that allows you to access the “Gold Trading Alerts” space.
The first premium analysis had over 30 comments below it, and once I finish writing this article, I’ll head over to the comments section and catch up on yesterday’s comments.
Also, if you haven’t had the chance to see the video, in which I’m talking about the new platform and why we essentially moved from Sunshine Profits to Golden Meadow, I strongly encourage you to do so:
Summary
Summing up, while the precious metals sector moved higher this week, it seems that it’s just a part of a bigger – bearish – analogy to what we saw in 2008. I realize that volatile upswings generate a lot of emotions, but taking a calm, broad look at the markets shows that nothing really changed.
The situation on the USD index, in particular, suggests that the bottom is already in or nearing, and the opposite is likely for the precious metals market.
In fact, I would like to take this opportunity to congratulate you on your patience with this trade (and I’m grateful for your understanding that not every corrective upswing can be “caught” in trading terms). Many investors and traders panic and get out of the market exactly at the wrong time, but your patience and self-discipline mean that you’re poised to make the most of what the market brings us this and next year.
Moving back to the market, it appears to be yet another time when the markets are incorrectly expecting the Fed to make a dovish U-turn, and based on this, the part of the 2008 decline where we saw the biggest corrective upswing materialized.
In my opinion, the current trading position is going to become profitable in the following weeks, and quite possibly in the following days. And while I can’t promise any kind of performance, I fully expect it to become very profitable before it’s over and to prolong our 2022 winning streak.
After the final sell-off (that takes gold to about $1,350-$1,500), I expect the precious metals to rally significantly. The final part of the decline might take as little as 1-5 weeks, so it's important to stay alert to any changes.
As always, we'll keep you – our subscribers – informed.
To summarize:
Trading capital (supplementary part of the portfolio; our opinion): Full speculative short positions (300% of the full position) in junior mining stocks are justified from the risk to reward point of view with the following binding exit profit-take price levels:
Mining stocks (price levels for the GDXJ ETF): binding profit-take exit price: $20.32; stop-loss: none (the volatility is too big to justify a stop-loss order in case of this particular trade)
Alternatively, if one seeks leverage, we’re providing the binding profit-take levels for the JDST (2x leveraged). The binding profit-take level for the JDST: $27.87; stop-loss for the JDST: none (the volatility is too big to justify a SL order in case of this particular trade).
For-your-information targets (our opinion; we continue to think that mining stocks are the preferred way of taking advantage of the upcoming price move, but if for whatever reason one wants / has to use silver or gold for this trade, we are providing the details anyway.):
Silver futures downside profit-take exit price: $12.32
SLV profit-take exit price: $11.32
ZSL profit-take exit price: $74.87
Gold futures downside profit-take exit price: $1,504
HGD.TO – alternative (Canadian) 2x inverse leveraged gold stocks ETF – the upside profit-take exit price: $18.47
HZD.TO – alternative (Canadian) 2x inverse leveraged silver ETF – the upside profit-take exit price: $46.87
Long-term capital (core part of the portfolio; our opinion): No positions (in other words: cash)
Insurance capital (core part of the portfolio; our opinion): Full position
Whether you’ve already subscribed or not, we encourage you to find out how to make the most of our alerts and read our replies to the most common alert-and-gold-trading-related-questions.
Please note that we describe the situation for the day that the alert is posted in the trading section. In other words, if we are writing about a speculative position, it means that it is up-to-date on the day it was posted. We are also featuring the initial target prices to decide whether keeping a position on a given day is in tune with your approach (some moves are too small for medium-term traders, and some might appear too big for day-traders).
Additionally, you might want to read why our stop-loss orders are usually relatively far from the current price.
Please note that a full position doesn't mean using all of the capital for a given trade. You will find details on our thoughts on gold portfolio structuring in the Key Insights section on our website.
As a reminder - "initial target price" means exactly that - an "initial" one. It's not a price level at which we suggest closing positions. If this becomes the case (as it did in the previous trade), we will refer to these levels as levels of exit orders (exactly as we've done previously). Stop-loss levels, however, are naturally not "initial", but something that, in our opinion, might be entered as an order.
Since it is impossible to synchronize target prices and stop-loss levels for all the ETFs and ETNs with the main markets that we provide these levels for (gold, silver and mining stocks - the GDX ETF), the stop-loss levels and target prices for other ETNs and ETF (among other: UGL, GLL, AGQ, ZSL, NUGT, DUST, JNUG, JDST) are provided as supplementary, and not as "final". This means that if a stop-loss or a target level is reached for any of the "additional instruments" (GLL for instance), but not for the "main instrument" (gold in this case), we will view positions in both gold and GLL as still open and the stop-loss for GLL would have to be moved lower. On the other hand, if gold moves to a stop-loss level but GLL doesn't, then we will view both positions (in gold and GLL) as closed. In other words, since it's not possible to be 100% certain that each related instrument moves to a given level when the underlying instrument does, we can't provide levels that would be binding. The levels that we do provide are our best estimate of the levels that will correspond to the levels in the underlying assets, but it will be the underlying assets that one will need to focus on regarding the signs pointing to closing a given position or keeping it open. We might adjust the levels in the "additional instruments" without adjusting the levels in the "main instruments", which will simply mean that we have improved our estimation of these levels, not that we changed our outlook on the markets. We are already working on a tool that would update these levels daily for the most popular ETFs, ETNs and individual mining stocks.
Our preferred ways to invest in and to trade gold along with the reasoning can be found in the how to buy gold section. Furthermore, our preferred ETFs and ETNs can be found in our Gold & Silver ETF Ranking.
As a reminder, Gold & Silver Trading Alerts are posted before or on each trading day (we usually post them before the opening bell, but we don't promise doing that each day). If there's anything urgent, we will send you an additional small alert before posting the main one.
Thank you.
Przemyslaw K. Radomski, CFA
Founder, Editor-in-chief

