

Briefly: in our opinion, full (300% of the regular position size) speculative short positions in junior mining stocks are justified from the risk/reward point of view at the moment of publishing this Alert.
PLEASE NOTE:
Dear Subscribers,
As the Author will be traveling this week, upcoming Gold & Silver Trading Alerts will not include regular technical analysis. Instead, they will focus on the fundamental aspects. The next regular technical analysis will be published on Monday, August 15. PR will inform you about significant changes (which are unlikely).
Stay tuned!
Introduction
The PMs went their separate ways on Aug. 9, as gold rallied by 0.39%, silver fell by 0.64%, the GDX ETF fell by 0.22%, and the GDXJ ETF underperformed, declining by 1.07%. Moreover, the USD Index declined by 0.07%, while U.S. Treasury yields rallied. Furthermore, while today’s Consumer Price Index (CPI) release may induce some intraday volatility, the medium-term implications are unchanged: the PMs’ technical and fundamental outlooks continue to worsen, and lower lows should materialize in the months ahead.
Here Comes the CPI
With investors eagerly awaiting the release of the Consumer Price Index (CPI), the results could sway short-term sentiment. Moreover, while the headline CPI is expected to show a year-over-year (YoY) deceleration – due to the decline in oil and gas prices – the economic pain required to reduce the metric to 2% is materially underestimated by the consensus.
Therefore, while investors may take a glass-half-full approach when analyzing the data, the medium-term implications of eliminating inflation should weigh heavily on gold, silver, and mining stocks.
For example, the U.S. Bureau of Labor Statistics (BLS) released its productivity report on Aug. 9. Moreover, with nonfarm productivity declining by the most on record in Q2, the data is profoundly inflationary.
Please see below:
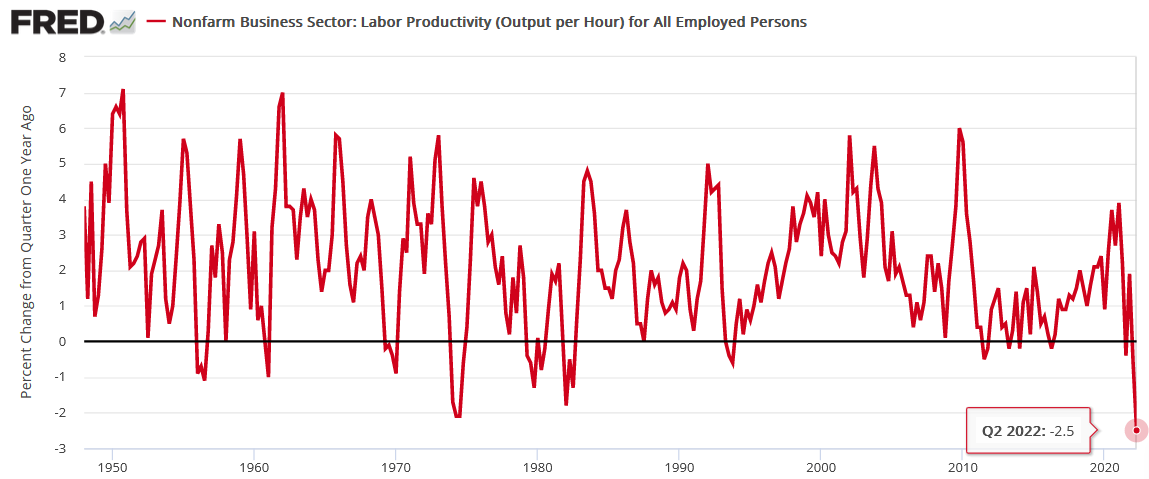
To explain, the red line above tracks the percentage change from the quarter one year ago. If you analyze the right side of the chart, you can see that the metric has never printed a lower figure in its nearly 75-year history.
Furthermore, productivity measures the amount of output produced per hour. Therefore, when productivity declines, it means that companies produced the same amount of goods in more time or less goods in the same amount of time. In a nutshell: a lack of efficiency increases companies’ expenses, and the results are inflationary.
To that point, unit labor costs – which factor in wage increases and productivity – increased by 10.8% in Q2 and outperformed economists’ consensus estimate.
Please see below:
 Source: Investing.com
The official BLS report stated:
“Unit labor costs in the nonfarm business sector increased 10.8 percent in the second quarter of 2022, reflecting a 5.7-percent increase in hourly compensation and a 4.6-percent decrease in productivity. Unit labor costs increased 9.5 percent over the last four quarters. This is the largest four-quarter increase in this measure since a 10.6-percent increase in the first quarter of 1982.”
Thus, with employees’ efficiency down and their wages up, U.S. companies must raise prices to protect their profit margins. If not, the excess costs will decrease their earnings, and investors will grow restless. As such, the data paints an ominous portrait of the medium-term inflation backdrop.
The Earnings Picture
With 'macro' analysts only seeing a bird's-eye view of the inflation picture they miss the realities on the ground. As a result, while the crowd uses top-down charts to explain why inflation should decline sharply, they don't realize that the bottom-up data suggests otherwise.
For example, freight rates have declined substantially, which reduces the burden of higher shipping costs. However, A.P. Møller-Mærsk – the largest shipping company in the world – is still charging higher prices for ocean freight. The company released its second-quarter earnings on Aug. 2, and CEO Soren Skou said during the conference call:
“As of today, the average contract rate for the year is expected to be $1,900 per FFE higher than in 2021. The increase of $500 compared to our expectations at the end of Q1 reflects much better performance in Q2 itself, higher conclusion of deals in the latter part of Q2 and over the summer, a positive effects from higher share of contracts being hit all than expected, and a small positive buff effects.”
CFO Patrick Jany added:
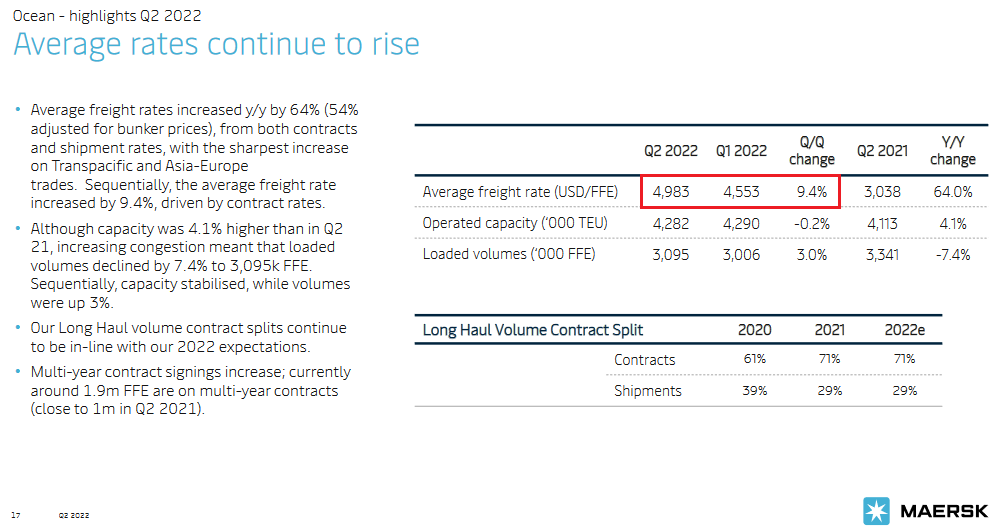
“Q2 saw a continuation of the global congestions, with an accumulation of several disruptions, offsetting the weakening demand and lower economic outlook and implying still a very high level freight rates. Although spot rates softened slightly, during the quarter, they remained high in absolute terms, and we continue to sign contracts at higher rates than previously, leading to an average rate increase of 64% compared the previous year.”
Thus, the average ocean freight rate was 9.4% higher in Q2 than in Q1.
Please see below:
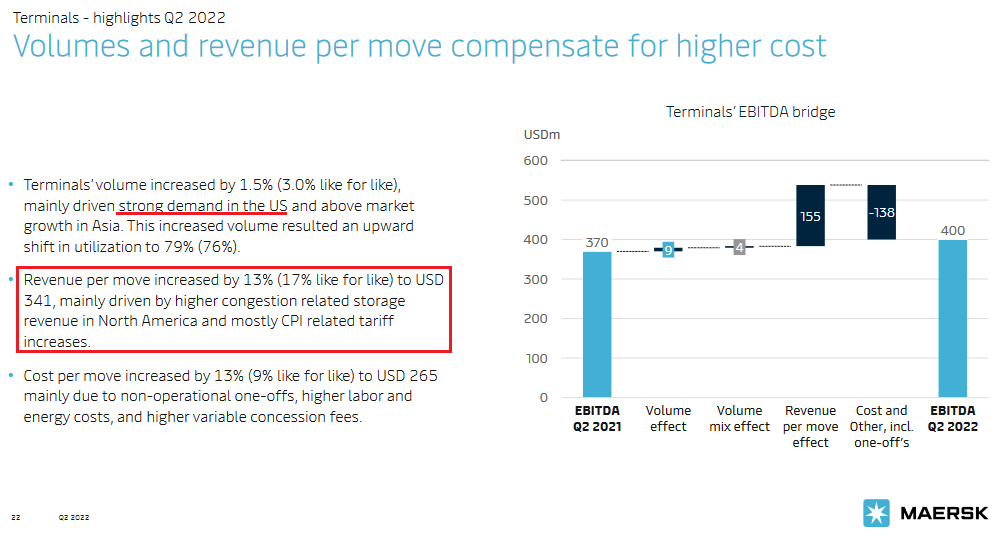
In addition, the company’s terminals segment – which aids the transport process through loading and/or unloading cargo – saw its revenue per move increase by 13% as “CPI related tariff increases” were implemented to offset higher costs.
Please see below:
As a result, since the 'macro' community doesn't comb through these earnings reports, they miss the critical details showcasing inflation's stickiness. To that point, Skou concluded:
“I think there's really any doubt on where the global economy is going, right? So there will be a reduced demand at one point in time. But we would expect for all the factors, which we typically have, as we discussed earlier on, that this will be a gradual development and that ultimately as well freight rates will stabilize at a higher level than they were in the past and higher than the cost scale.”
Thus, with higher-for-longer freight rates poised to persist, management increased the company’s profitability and cash flow guidance for the second time in 2022. As such, does it seem like demand destruction has unfolded?
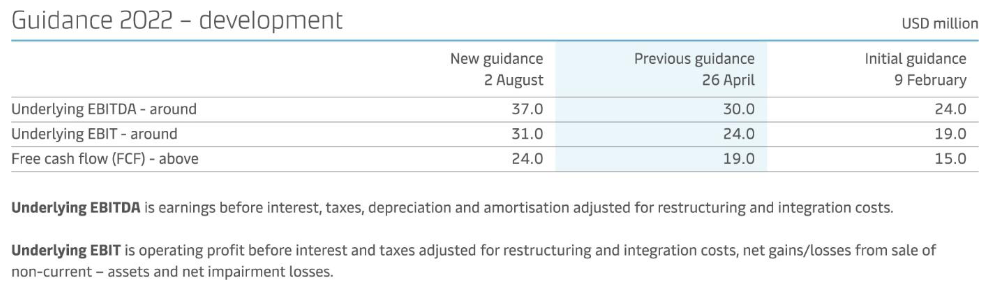 Source: A.P. Møller-Mærsk
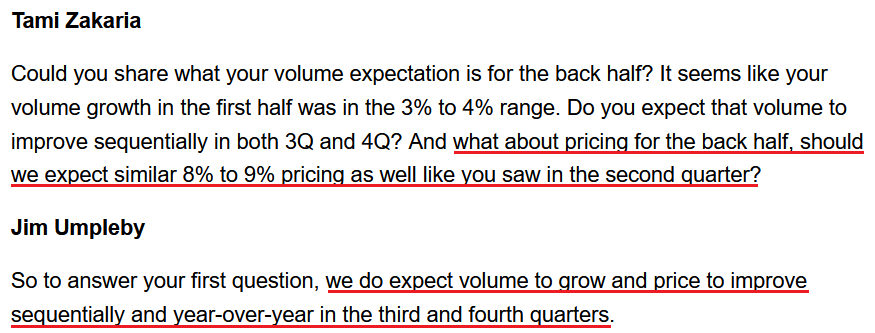
On top of that, Caterpillar – an industrial company with a nearly $100 billion market cap – released its second-quarter earnings on Aug. 2. When asked about the recent decline in commodity prices, CEO Jim Umpleby responded:
“We're still dealing with an inflationary environment, and we have not seen a decrease from our suppliers as a result of commodity price reductions. As you know, it takes a while for those kind of changes to work their way through the supply chain. And of course, there's volatility there as well. So, no. The short answer to the question is no, we haven't seen any moderation in those costs.”
Furthermore, after increasing prices by 8% to 9% in Q2, Umpleby told analysts to expect “sequentially” higher prices in Q3 and Q4.
Please see below:
 Source: Caterpillar/Seeking Alpha
He added:
“We expect a volume and price realization to improve in the second half of the year, which should lead to sales growth in the remaining quarters of the year, both sequentially and year-over-year. We also expect adjusted operating profit margins will improve both sequentially and year-over-year in the second half of 2022 as our price realization will more than offset manufacturing cost increases.”
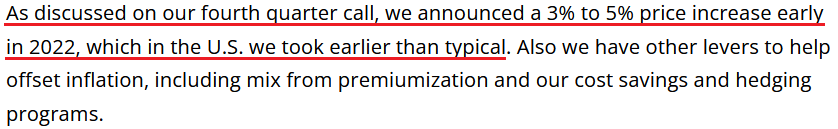
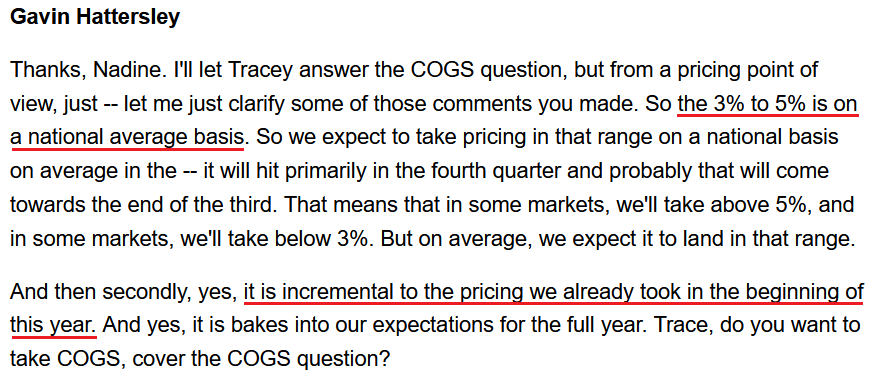
Continuing the theme, Molson Coors – the second-largest brewer in the U.S. – released its second-quarter earnings on Aug. 2. As a prelude, CFO Tracey Joubert said during the Q1 earnings call:
 Source: Molson Coors/AlphaStreet
Moreover, CEO Gavin Hattersley provided an update during the Q2 earnings call:
“We knew we were going to take a price increase in the fall. We're probably going to get a little more than we were expecting. So it was our expectation that we're going to get it. But we're probably taking a little bit more (…). We will have the benefits of our fourth quarter U.S. price increase which will further help offset inflation.”
As well, consumers are not balking at the higher prices. He added:
“I think we said on the Q1 call that elasticity wasn't as high as one would have expected given the pricing that we put into the marketplace in January and February of this year. And we'll do the same thing again with this price increase. We'll watch the elasticities and we'll watch how our brands perform in the market very carefully. But without rehashing what I said, our brand performance from a share point of view is strong, and we're pleased with it.”
Therefore, with another 3% to 5% price increase scheduled for Q4, Hattersley made it clear that the hikes would be on top of the increases that commenced in early 2022.
Please see below:
 Source: Molson Coors/Seeking Alpha
Thus, while the consensus hopes that inflation will go quietly into the night, the reality is that U.S. corporations are still increasing their prices with little pushback from consumers. Furthermore, with average hourly earnings and unit labor costs outperforming expectations, the record decline in productivity highlights how input pressures stretch well beyond commodity prices.
As a result, the neutral U.S. federal funds rate (FFR) is much higher than investors and the Fed realize, and a wake-up call should have negative consequences for the PMs.
The Bottom Line
While a decelerating CPI may increase investors’ optimism, the decline in oil and gas prices will only enhance consumers’ spending power. Therefore, what’s bearish for the headline CPI is bullish for the core CPI. Furthermore, with financial conditions still too loose to curb inflation, the Fed needs higher real yields and lower asset prices to achieve its dual mandate. As such, reality should re-emerge in the months ahead.
In conclusion, the PMs were mixed on Aug. 9, though, the GDXJ ETF was a noticeable underperformer. Moreover, with the meme-stock surge fizzling, further drawdowns of the S&P 500 should weigh heavily on the junior miners. Thus, more downside should confront gold, silver, and mining stocks over the medium term.
Overview of the Upcoming Part of the Decline
- It seems to me that the corrective upswing is either over or about to be over, and that the next big move lower is about to start.
- If we see a situation where miners slide in a meaningful and volatile way while silver doesn’t (it just declines moderately), I plan to – once again – switch from short positions in miners to short positions in silver. At this time, it’s too early to say at what price levels this could take place and if we get this kind of opportunity at all – perhaps with gold prices close to $1,600.
- I plan to exit all remaining short positions once gold shows substantial strength relative to the USD Index while the latter is still rallying. This may be the case with gold prices close to $1,400. I expect silver to fall the hardest in the final part of the move. This moment (when gold performs very strongly against the rallying USD and miners are strong relative to gold after its substantial decline) is likely to be the best entry point for long-term investments, in my view. This can also happen with gold close to $1,400, but at the moment it’s too early to say with certainty.
- The above is based on the information available today, and it might change in the following days/weeks.
You will find my general overview of the outlook for gold on the chart below:
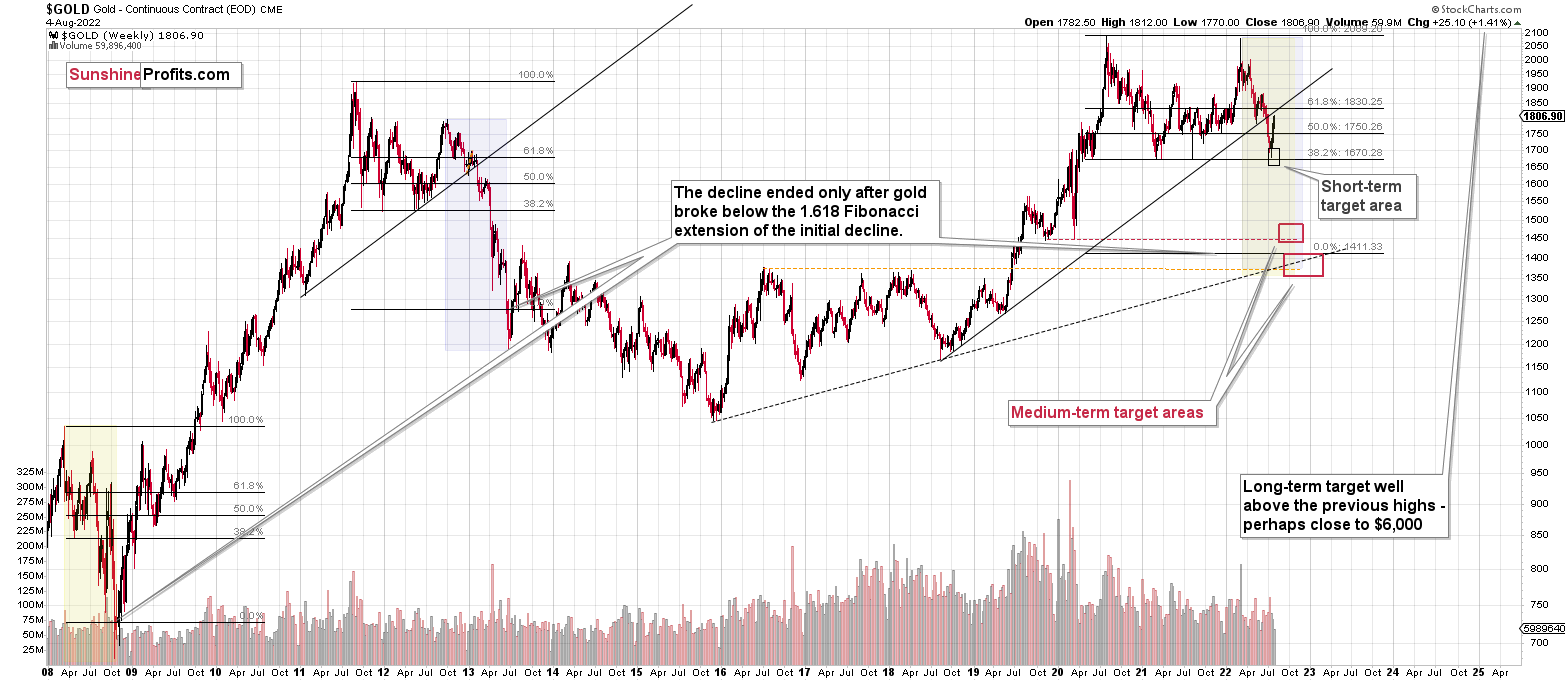
Please note that the above timing details are relatively broad and “for general overview only” – so that you know more or less what I think and how volatile I think the moves are likely to be – on an approximate basis. These time targets are not binding nor clear enough for me to think that they should be used for purchasing options, warrants, or similar instruments.
Summary
Summing up, it seems that the corrective upswing is over (or close to being over), which means that the powerful medium-term downtrend can now resume.
Last week, we closed yet another profitable trade in a row. This year’s profits are already enormous, but it seems likely to me that they will grow even more in the following weeks and months. Making money on corrections during powerful trends is a difficult feat, but you managed to do just that – congratulations!
On an administrative note, I will be traveling next week, and therefore, Gold & Silver Trading Alerts posted during next week will not include the regular technical analysis – they will focus on the fundamental aspects instead. The next regular technical analysis will be posted on Monday, Aug. 15. I will keep you informed if anything major changes (which is unlikely).
Moreover, please note that it’s not only the profits on the long positions that are so great about this success – it’s also the ability to get back on the short side of the market at more favorable (higher) prices, thus increasing the likely profits from the current trade. Congratulations, once again!
Also, please note that I will be updating the targets for the leveraged ETFs as we move closer to them, as their prices will depend on the path prices take to reach their targets.
After the final sell-off (that takes gold to about $1,350-$1,500), I expect the precious metals to rally significantly. The final part of the decline might take as little as 1-5 weeks, so it's important to stay alert to any changes.
As always, we'll keep you – our subscribers – informed.
To summarize:
Trading capital (supplementary part of the portfolio; our opinion): Full speculative short positions (300% of the full position) in junior mining stocks are justified from the risk to reward point of view with the following binding exit profit-take price levels:
Mining stocks (price levels for the GDXJ ETF): binding profit-take exit price: $20.32; stop-loss: none (the volatility is too big to justify a stop-loss order in case of this particular trade)
Alternatively, if one seeks leverage, we’re providing the binding profit-take levels for the JDST (2x leveraged). The binding profit-take level for the JDST: $29.87; stop-loss for the JDST: none (the volatility is too big to justify a SL order in case of this particular trade).
For-your-information targets (our opinion; we continue to think that mining stocks are the preferred way of taking advantage of the upcoming price move, but if for whatever reason one wants / has to use silver or gold for this trade, we are providing the details anyway.):
Silver futures downside profit-take exit price: $12.32
SLV profit-take exit price: $11.32
ZSL profit-take exit price: $79.87
Gold futures downside profit-take exit price: $1,504
HGD.TO – alternative (Canadian) 2x inverse leveraged gold stocks ETF – the upside profit-take exit price: $19.87
HZD.TO – alternative (Canadian) 2x inverse leveraged silver ETF – the upside profit-take exit price: $49.87
Long-term capital (core part of the portfolio; our opinion): No positions (in other words: cash)
Insurance capital (core part of the portfolio; our opinion): Full position
Whether you’ve already subscribed or not, we encourage you to find out how to make the most of our alerts and read our replies to the most common alert-and-gold-trading-related-questions.
Please note that we describe the situation for the day that the alert is posted in the trading section. In other words, if we are writing about a speculative position, it means that it is up-to-date on the day it was posted. We are also featuring the initial target prices to decide whether keeping a position on a given day is in tune with your approach (some moves are too small for medium-term traders, and some might appear too big for day-traders).
Additionally, you might want to read why our stop-loss orders are usually relatively far from the current price.
Please note that a full position doesn't mean using all of the capital for a given trade. You will find details on our thoughts on gold portfolio structuring in the Key Insights section on our website.
As a reminder - "initial target price" means exactly that - an "initial" one. It's not a price level at which we suggest closing positions. If this becomes the case (as it did in the previous trade), we will refer to these levels as levels of exit orders (exactly as we've done previously). Stop-loss levels, however, are naturally not "initial", but something that, in our opinion, might be entered as an order.
Since it is impossible to synchronize target prices and stop-loss levels for all the ETFs and ETNs with the main markets that we provide these levels for (gold, silver and mining stocks - the GDX ETF), the stop-loss levels and target prices for other ETNs and ETF (among other: UGL, GLL, AGQ, ZSL, NUGT, DUST, JNUG, JDST) are provided as supplementary, and not as "final". This means that if a stop-loss or a target level is reached for any of the "additional instruments" (GLL for instance), but not for the "main instrument" (gold in this case), we will view positions in both gold and GLL as still open and the stop-loss for GLL would have to be moved lower. On the other hand, if gold moves to a stop-loss level but GLL doesn't, then we will view both positions (in gold and GLL) as closed. In other words, since it's not possible to be 100% certain that each related instrument moves to a given level when the underlying instrument does, we can't provide levels that would be binding. The levels that we do provide are our best estimate of the levels that will correspond to the levels in the underlying assets, but it will be the underlying assets that one will need to focus on regarding the signs pointing to closing a given position or keeping it open. We might adjust the levels in the "additional instruments" without adjusting the levels in the "main instruments", which will simply mean that we have improved our estimation of these levels, not that we changed our outlook on the markets. We are already working on a tool that would update these levels daily for the most popular ETFs, ETNs and individual mining stocks.
Our preferred ways to invest in and to trade gold along with the reasoning can be found in the how to buy gold section. Furthermore, our preferred ETFs and ETNs can be found in our Gold & Silver ETF Ranking.
As a reminder, Gold & Silver Trading Alerts are posted before or on each trading day (we usually post them before the opening bell, but we don't promise doing that each day). If there's anything urgent, we will send you an additional small alert before posting the main one.
Thank you.
Przemyslaw Radomski, CFA
Founder, Editor-in-chief

