

Briefly: in our opinion, full (300% of the regular position size) speculative short positions in mining stocks are justified from the risk/reward point of view at the moment of publishing this Alert.
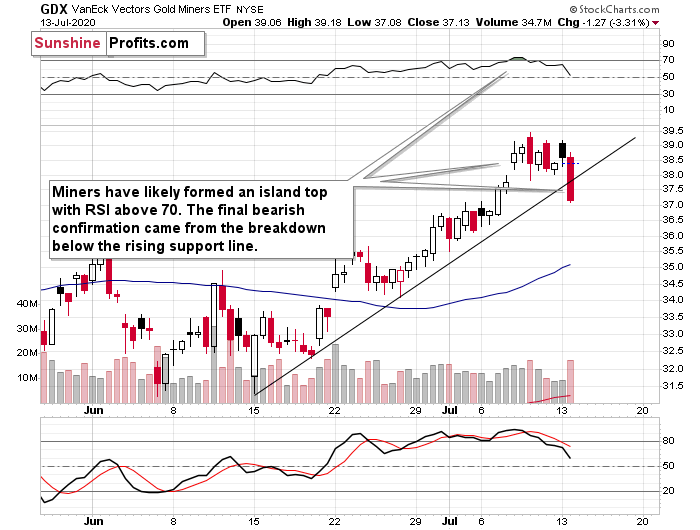
In yesterday's analysis, we wrote that miners have likely formed an island top and that the final confirmation thereof will come when they break below their rising support line.
We didn't have to wait long for the above-mentioned confirmation - miners broke decisively and close yesterday's session below the rising support line.
We described the above chart in the following way:
GDX's 4-hour candlestick chart shows that they were just very overbought also from the short-term point of view as the RSI indicator moved above 70. While it was in this sell-signal territory, miners were moving back and forth after a bullish price gap. Combination of both suggests that what we saw was an island top formation. At this time, it's just a "potential" formation, because we won't know for certain until miners decline more and move below the $37.5 level. This level is important because it corresponds not only to the lower border of the price gap, but it's also where the rising support line currently is.
As the breakdown has already happened, the very short-term outlook for the mining stocks has deteriorated significantly.
The strength of the support line - and thus importance of the breakdown below it - is further increased by what we see on GDX's daily chart.
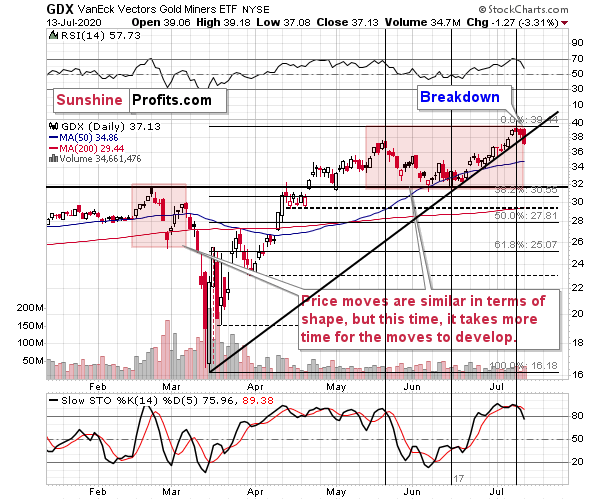
The above-mentioned line is actually the line that starts all the way at the March bottom. Breakdown below this line opened the door wide open to strong declines. Given the Gold Miners Bullish Percent Index's extreme overbought reading, the fall should be substantial.
Last Monday, we described the above chart in the following way:
Remember when we wrote that the situation right now is similar to what happened in March, but this time it takes longer for everything to develop due to the change in market's perception of risk? To make a long story short, the March coronavirus panic was because the entire world was dealing with the unknown, which exacerbated the fear. Right now, the situation is worse, and it goes worse almost on a daily basis, but people are not as afraid. The economic implications don't appear so dire either. And it's definitely nothing unknown - we more or less know what to expect.
This means that we're likely to see a repeat of what we saw in March, we're likely to see it in "slow motion", at least for some time. Please note that even slow-motion mode of the mid-March plunge would still be very volatile.
The areas that we marked with red rectangles are similar in terms of shape, but the current one is about 4x longer. The previous pattern was characterized by a decline and a correction that took more or less the same time to complete. If we're about to see something similar also this time, then we can expect the top to be formed this week.
As of yesterday, the June - July upswing took as much time as the May - June decline did. This time, the second high was higher, but the timing between the highs and the low is analogous to what we saw in February and March.
Given that the RSI that just touched the 70 level, the sell signal from the Stochastic indicator, the Gold Miners Bullish Percent Index that just hit the extreme 100 mark, and the above-mentioned symmetry, it seems that the top in the mining stocks is finally in.
The next strong support is provided by the June lows, but if gold is to move to $1,700 next week, we doubt that this level would hold.
Once the decline really starts and gold is on its way to $1,700, we will update the target prices for the mining stocks - it will be much easier to assess the likely short-term bottom price once we see how miners react to gold's move.
Having said that, let's turn to another part of the precious metals market that flashed a major sell signal yesterday - silver.
Spotlight on Silver
In yesterday's analysis, we commented on the white metal in the following way:
Please note that silver just moved above the most recent high while gold is far from it. This very short-term outperformance is exactly what we want to see as a confirmation that the top in gold is in. Silver's stand-alone breakouts very often turn into fake-outs and we expect this to be the case once again.
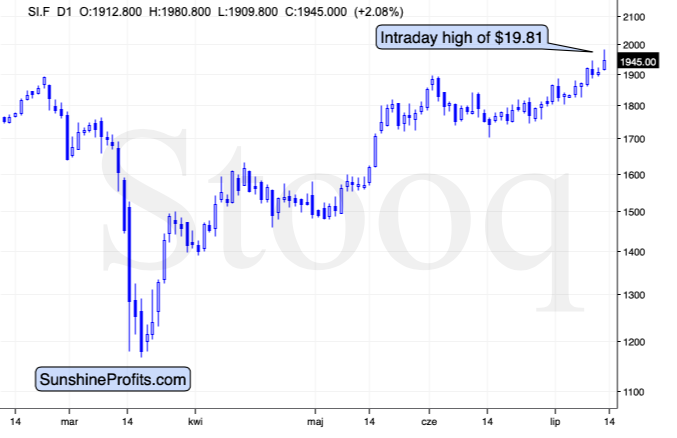
Silver has one more important resistance just ahead - the 2019 high of $19.75. We wouldn't be surprised to see silver move several cents above it and slide then. Silver (continuous futures) is trading at $19.51 and the moment of writing these words, so it's relatively close.
That's exactly what silver did yesterday. It moved 6 cents above the 2019 high only to decline back below it and move back below $19.50s. This quick invalidation and fake-out, plus the fact that silver outperformed gold on a very short-term basis while miners underperformed it, is a very bearish combination.
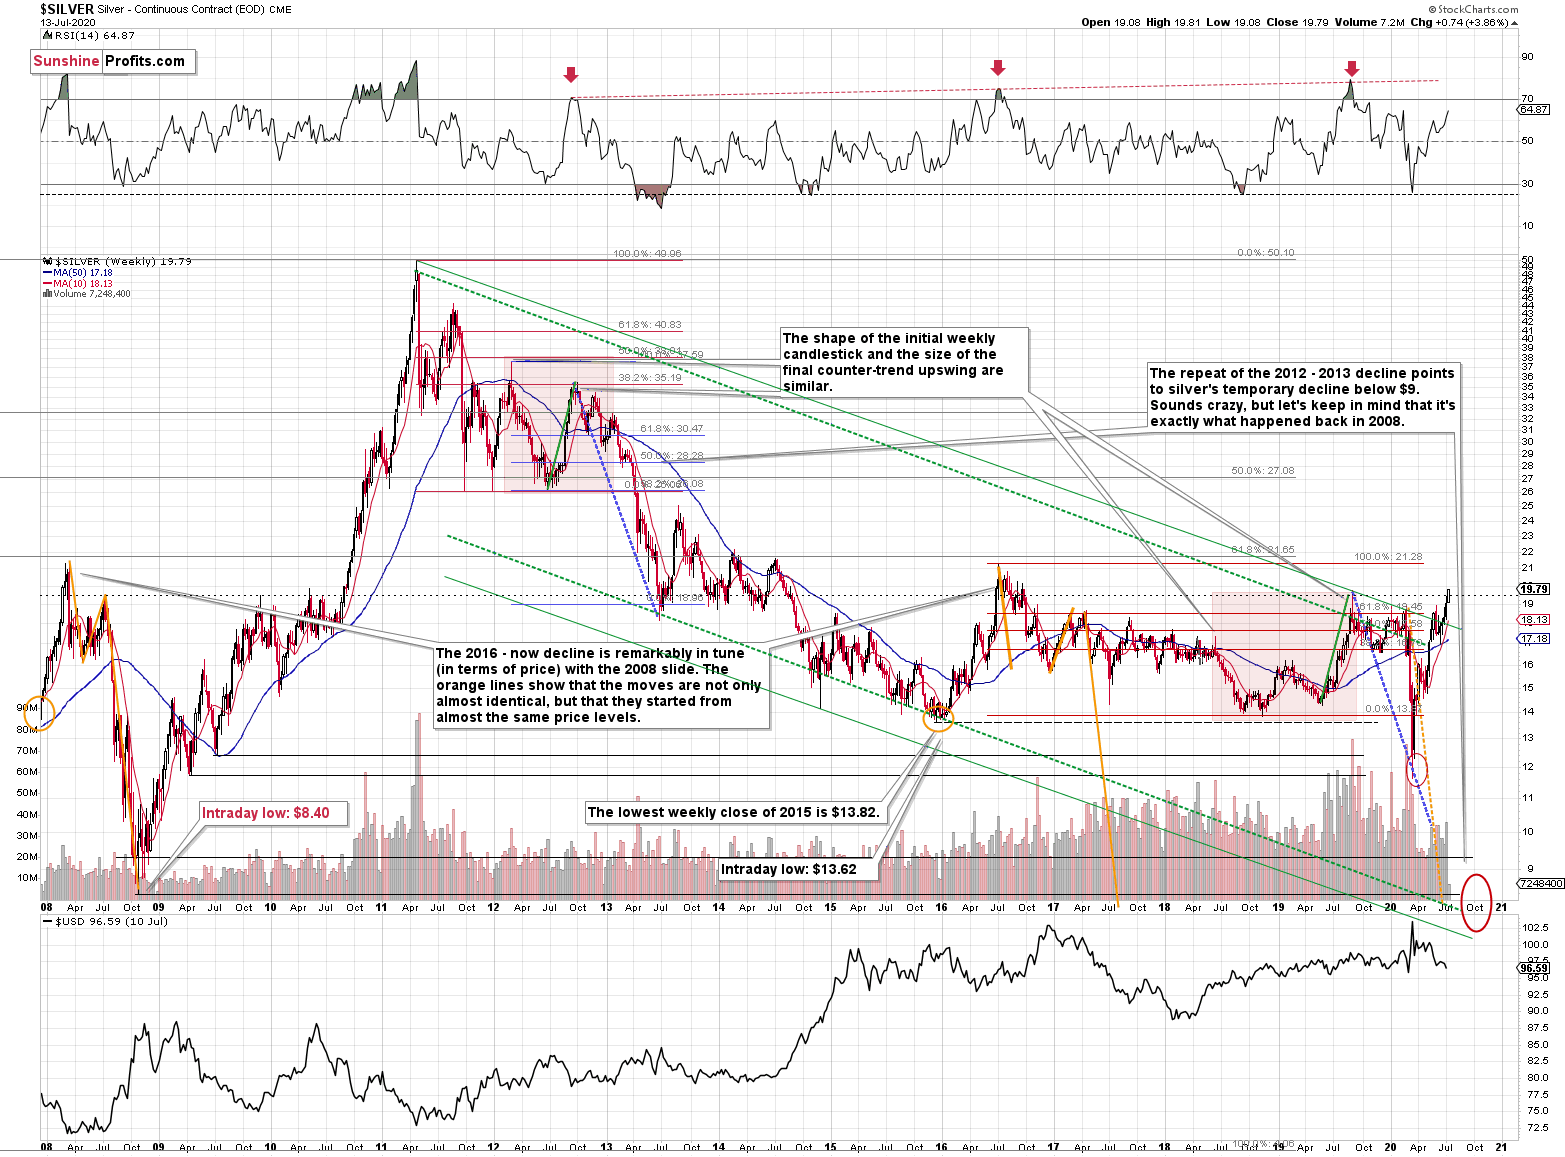
Once the white metal declines below the rising support line, and the $18 level, the pace of decline is likely to accelerate.
And what did gold do? That's the best part - almost nothing. The GLD ETF moved higher by 0.12%. Miners broke below their strong support line almost without gold's help - and actually despite its tiny upswing. This makes their breakdown even more bearish as it shows that they want to decline so badly that they just can't wait.
In the final hours of yesterday's trading and during the overnight trading, gold moved lower by only a bit, but that was enough for the yellow metal to break below the first of the rising support lines.
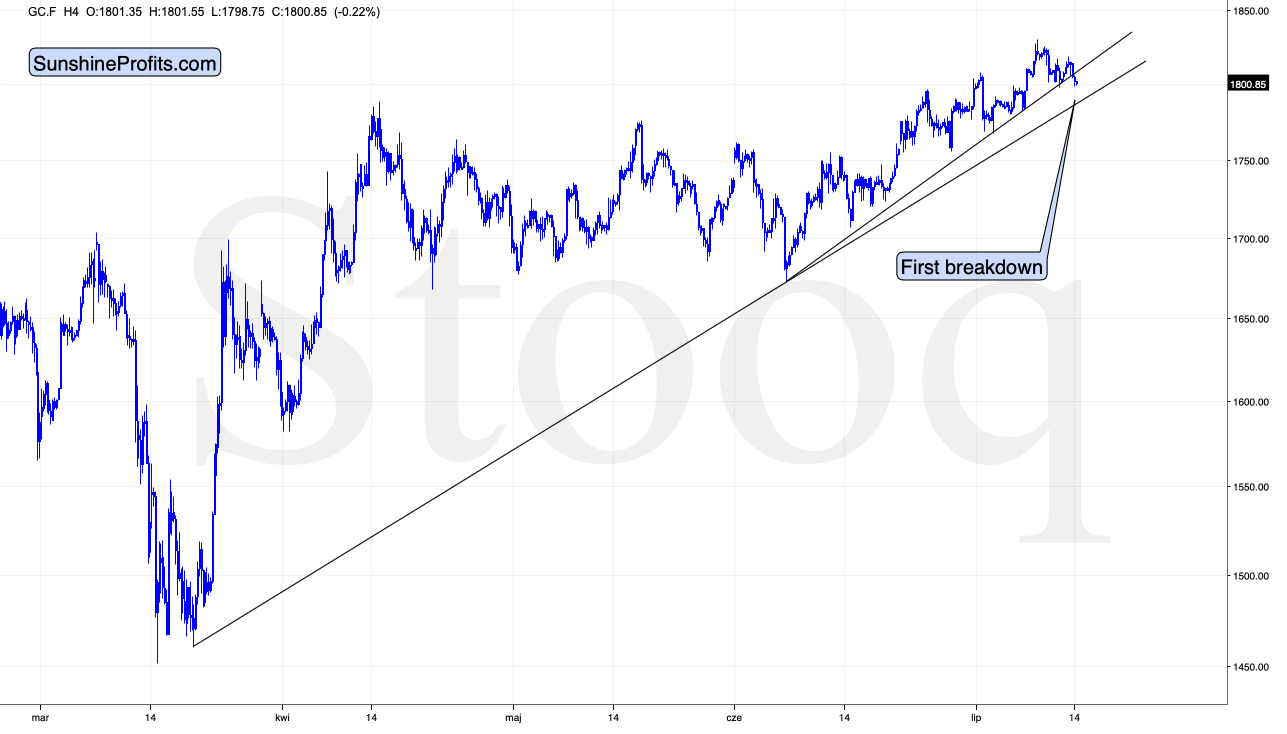
This is a bearish development, but silver's outperformance and fake-out as well as miners' breakdown together with their underperformance, are much more important.
Based on the declines that were similarly big as the move that would take gold to about $1,700, we can expect gold to reach this level sometime this or next week. That's when we might exit the current short positions in order to re-open them after the rebound.
Before summarizing, we would like to address a question that we just received:
Q: Between 5/20/20 - 6/29/20, HUI dropped 5.48%. For the same period DUST gained 3.44%. I know that DUST is not a bear index for HUI but I wonder why DUST didn't gain at least as much as HUI lost, or more. What insight gives you confidence that DUST will retain it's 2X leverage gain when the miners decline significantly.
I appreciate the technical explanations in each day's Alert.
A: There are two things that can explain the above. First, the DUST and NUGT are not designed to track HUI but a slightly different gold mining index (NYSE Arca Gold Miners Index - GDM), which is why they are not tracking the above perfectly. However, the key issue is that they are designed to track and provide the leverage for daily price changes, not for certain periods. This means that the 2x relationship is almost guaranteed not to hold over longer periods. For instance, if a given asset moves up and down by 20% for 6 consecutive trading days, it's price would move 0.8 x 1.2 x 0.8 x 1.2 x 0.8 x 1.2 = 0.8847, which means over 11% lower. However, for something with a 2x daily leverage, it would look like this: 0.6 x 1.4 x 0.6 x 1.4 x 0.6 x 1.4 = 0.5927, which means over 40% lower. Even though the daily leverage was always 2x, the ultimate leverage for these 6 days was almost 4x.
Consequently, in order to determine the future price of any daily-leveraged instrument (like DUST, NUGT, JDST, JNUG), one would have to know not only the final price of the underlying instrument, but also the way in which this price is achieved (daily price moves). This is why we will be adjusting our target levels for DUST and JDST once the decline is underway and we have clearer view regarding the price path.
There's also the third reason, which are costs that drag the price down a bit (but it adds up over time).
Summary
Summing up, the breakdown in gold miners as well as the extreme overbought reading from the Gold Miners Bullish Percent Index are perfectly bearish confirmations for points that we made previously about gold and the USD Index.
Naturally, everyone's trading is their responsibility, but in our opinion, if there ever was a time to either enter a short position in the miners or to increase its size if it wasn't already sizable, it's now. We made money on the March decline and on the March rebound, and it seems that another massive slide is about to start. When everyone is on one side of the boat, it's a good idea to be on the other side, and the Gold Miners Bullish Percent Index literally indicates that this is the case with mining stocks.
After the sell-off (that takes gold below $1,400), we expect the precious metals to rally significantly. The final decline might take as little as 1-6 weeks, so it's important to stay alert to any changes.
Most importantly - stay healthy and safe. We made a lot of money on the March decline and the subsequent rebound (its initial part) price moves (and we'll likely make much more in the following weeks and months), but you have to be healthy to really enjoy the results.
As always, we'll keep you - our subscribers - informed.
To summarize:
Trading capital (supplementary part of the portfolio; our opinion): Full speculative short positions (300% of the full position) in mining stocks is justified from the risk to reward point of view with the following binding exit profit-take price levels:
Senior mining stocks (price levels for the GDX ETF): binding profit-take exit price: $10.32; stop-loss: none (the volatility is too big to justify a SL order in case of this particular trade); binding profit-take level for the DUST ETF: $231.75; stop-loss for the DUST ETF: none (the volatility is too big to justify a SL order in case of this particular trade)
Junior mining stocks (price levels for the GDXJ ETF): binding profit-take exit price: $9.57; stop-loss: none (the volatility is too big to justify a SL order in case of this particular trade); binding profit-take level for the JDST ETF: $284.25; stop-loss for the JDST ETF: none (the volatility is too big to justify a SL order in case of this particular trade)
For-your-information targets (our opinion; we continue to think that mining stocks are the preferred way of taking advantage of the upcoming price move, but if for whatever reason one wants / has to use silver or gold for this trade, we are providing the details anyway. In our view, silver has greater potential than gold does):
Silver futures downside profit-take exit price: $8.58 (the downside potential for silver is significant, but likely not as big as the one in the mining stocks)
Gold futures downside profit-take exit price: $1,382 (the target for gold is least clear; it might drop to even $1,170 or so; the downside potential for gold is significant, but likely not as big as the one in the mining stocks or silver)
Long-term capital (core part of the portfolio; our opinion): No positions (in other words: cash
Insurance capital (core part of the portfolio; our opinion): Full position
Whether you already subscribed or not, we encourage you to find out how to make the most of our alerts and read our replies to the most common alert-and-gold-trading-related-questions.
Please note that the in the trading section we describe the situation for the day that the alert is posted. In other words, it we are writing about a speculative position, it means that it is up-to-date on the day it was posted. We are also featuring the initial target prices, so that you can decide whether keeping a position on a given day is something that is in tune with your approach (some moves are too small for medium-term traders and some might appear too big for day-traders).
Plus, you might want to read why our stop-loss orders are usually relatively far from the current price.
Please note that a full position doesn't mean using all of the capital for a given trade. You will find details on our thoughts on gold portfolio structuring in the Key Insights section on our website.
As a reminder - "initial target price" means exactly that - an "initial" one, it's not a price level at which we suggest closing positions. If this becomes the case (like it did in the previous trade) we will refer to these levels as levels of exit orders (exactly as we've done previously). Stop-loss levels, however, are naturally not "initial", but something that, in our opinion, might be entered as an order.
Since it is impossible to synchronize target prices and stop-loss levels for all the ETFs and ETNs with the main markets that we provide these levels for (gold, silver and mining stocks - the GDX ETF), the stop-loss levels and target prices for other ETNs and ETF (among other: UGLD, DGLD, USLV, DSLV, NUGT, DUST, JNUG, JDST) are provided as supplementary, and not as "final". This means that if a stop-loss or a target level is reached for any of the "additional instruments" (DGLD for instance), but not for the "main instrument" (gold in this case), we will view positions in both gold and DGLD as still open and the stop-loss for DGLD would have to be moved lower. On the other hand, if gold moves to a stop-loss level but DGLD doesn't, then we will view both positions (in gold and DGLD) as closed. In other words, since it's not possible to be 100% certain that each related instrument moves to a given level when the underlying instrument does, we can't provide levels that would be binding. The levels that we do provide are our best estimate of the levels that will correspond to the levels in the underlying assets, but it will be the underlying assets that one will need to focus on regarding the signs pointing to closing a given position or keeping it open. We might adjust the levels in the "additional instruments" without adjusting the levels in the "main instruments", which will simply mean that we have improved our estimation of these levels, not that we changed our outlook on the markets. We are already working on a tool that would update these levels on a daily basis for the most popular ETFs, ETNs and individual mining stocks.
Our preferred ways to invest in and to trade gold along with the reasoning can be found in the how to buy gold section. Additionally, our preferred ETFs and ETNs can be found in our Gold & Silver ETF Ranking.
As a reminder, Gold & Silver Trading Alerts are posted before or on each trading day (we usually post them before the opening bell, but we don't promise doing that each day). If there's anything urgent, we will send you an additional small alert before posting the main one.
Thank you.
Sincerely,
Przemyslaw Radomski, CFA
Editor-in-chief, Gold & Silver Fund Manager

