

Briefly: in our opinion, full (300% of the regular position size) speculative short positions in junior mining stocks are justified from the risk/reward point of view at the moment of publishing this Alert.
PLEASE NOTE:
Dear Subscribers,
As the Author will be traveling this week, upcoming Gold & Silver Trading Alerts will not include regular technical analysis. Instead, they will focus on the fundamental aspects. The next regular technical analysis will be published on Monday, August 15. PR will inform you about significant changes (which are unlikely).
Stay tuned!
A weaker-than-expected headline Consumer Price Index (CPI) print didn’t provide the PMs with much stimulation, as gold rallied by 0.08%, silver by 1.27%, the GDX ETF by 0.71% and the GDXJ ETF by 0.12%. In contrast, the NASDAQ Composite and the S&P 500 rallied by more than 2%. Moreover, with the USD Index declining by 1.10% and U.S. Treasury yields also dropping, the PMs’ relative weakness is profoundly bearish.
Gold Left Out in the Cold
With the Consumer Price Index (CPI) coming in cold on Aug. 10, jubilation overwhelmed the financial markets, as the S&P 500 and risk-on currencies surged. However, with gold, silver, and mining stocks underperforming, the PMs were largely forgotten during the bullish feeding frenzy.
Moreover, while the consensus celebrates the inflation deceleration, I warned before the opening bell that a slowdown was likely. I wrote:
With investors eagerly awaiting the release of the CPI, the results could sway short-term sentiment. Moreover, while the headline CPI is expected to show a year-over-year (YoY) deceleration – due to the decline in oil and gas prices – the economic pain required to reduce the metric to 2% is materially underestimated by the consensus.
Therefore, while investors may take a glass-half-full approach when analyzing the data, the medium-term implications of eliminating inflation should weigh heavily on gold, silver, and mining stocks.
To that point, with lower oil and gas prices as the main culprits, the medium-term roadmap continues to unfold as expected.
Please see below:
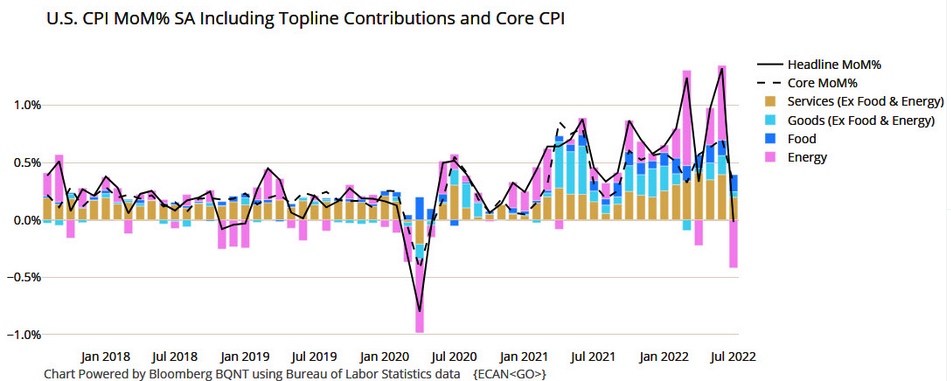
To explain, the black line above tracks the month-over-month (MoM) percentage change in the headline CPI, while the colored bars above represent the various components' contributions. If you analyze the right side of the chart, you can see that energy (the purple bar) was the only component to decline MoM in July. As a result, the print didn't reveal anything that we didn't expect.
Likewise, the idea of "peak inflation" is much more semblance than substance. For example, there is a misnomer in the financial markets that the battle is won when inflation stops going up. However, the reality is that reducing inflation to 2% is much more difficult than reducing the pace of the increases. As such, the consensus drastically underestimates the amount of economic pain that's required to achieve true normalization.
In addition, the core CPI increased by 0.31% MoM in July, so inflation is still increasing despite the energy respite. More importantly, investors celebrated an event that occurred several times in the 1970s and1980s, in June 2021 and in March 2022.
Please see below:
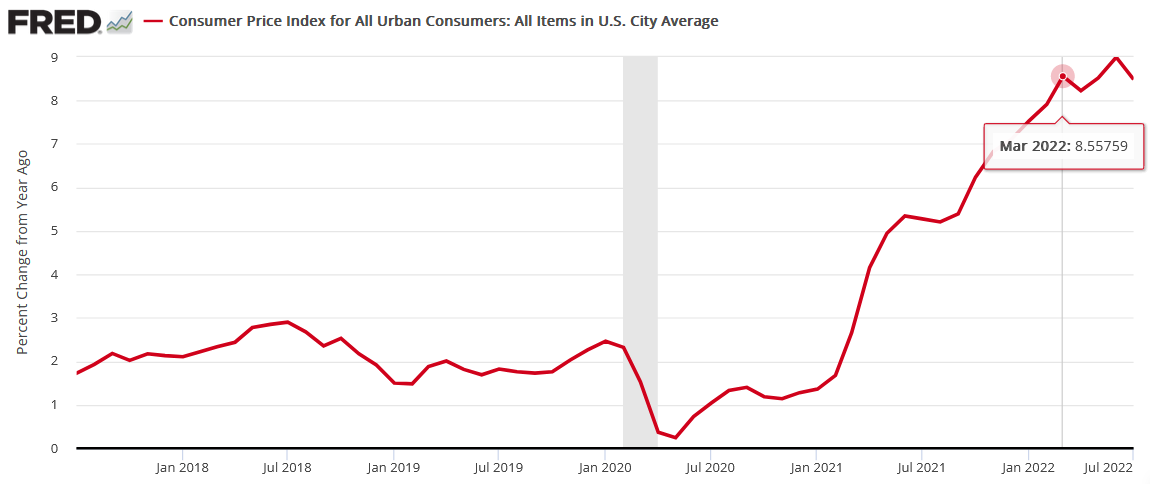
To explain, the red line above tracks the YoY percentage change in the headline CPI. Remember when “peak inflation” was initially present in March? Likewise, the headline CPI also decelerated from June to August 2021 before increasing once again.
Furthermore, the “peak inflation” crowd also enjoyed plenty of premature celebrations in the 1970s and 1980s.
Please see below:
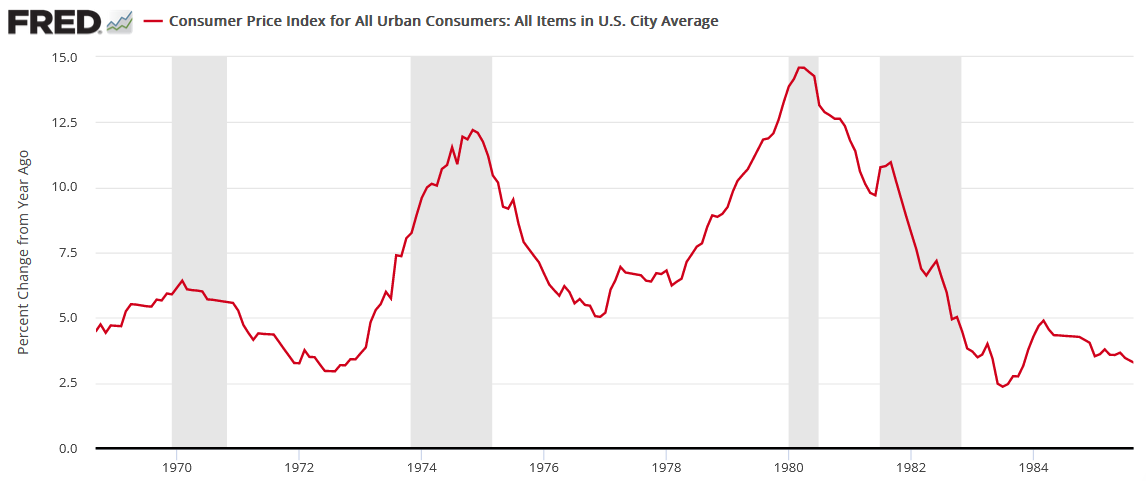
To explain, the red line above also tracks the YoY percentage change in the headline CPI, and the gray vertical bars represent recessions. Moreover, notice how plenty of short-term decelerations (declines or pauses in the red line) were present. Even during the largely uninterrupted surge from 1978 to 1980, the YoY percentage change in the headline CPI declined or flatlined twice along the way. Therefore, while sentiment rules the day in the short term, the crowd is overly-optimistic about how this all ends.
As further evidence, the Atlanta Fed’s Sticky CPIs hit new 2022 highs.
Please see below:
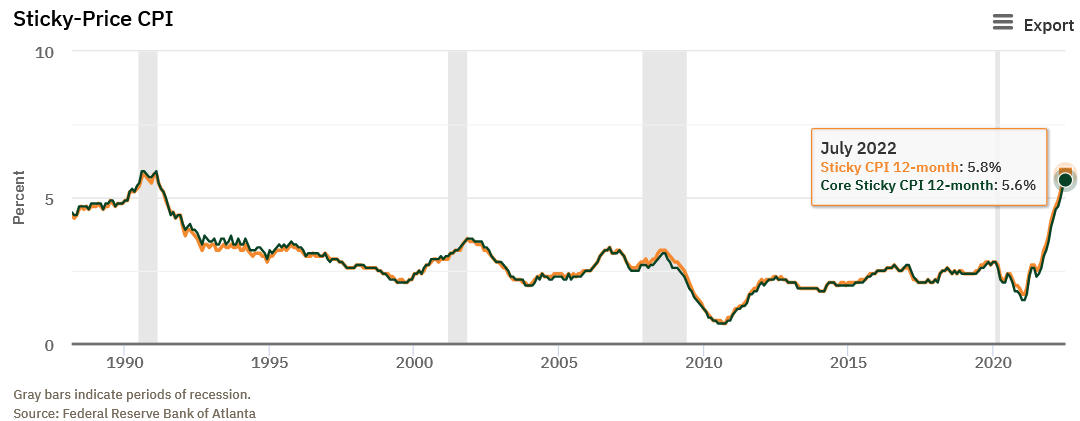
To explain, the orange and green lines above track the YoY percentage changes in the Sticky and core Sticky (excluding food and energy) CPIs. If you analyze the right side of the chart, you can see that neither decelerated in July. For context, the Atlanta Fed defines the metrics as:
“The Sticky CPI is calculated from a subset of goods and services included in the CPI that change price relatively infrequently. Because these goods and services change price relatively infrequently, they are thought to incorporate expectations about future inflation to a greater degree than prices that change on a more frequent basis. One possible explanation for sticky prices could be the costs firms incur when changing price.”
Moreover, a report by Atlanta and Cleveland Fed researchers came to the same conclusion. An excerpt read:
“We are interested in whether changes in the flexible CPI or sticky CPI improve the forecast of headline inflation at various numbers of months into the future…. We find that forecasts of the headline CPI that are based on the sticky-price data tend to be more accurate than the forecasts based on headline inflation. Further, CPI predictions using sticky-price data perform pretty well relative to CPI forecasts using core CPI data. We also find that the relative accuracy of the sticky-price Phillips curve increases as the forecast horizon gets longer.”
Please see below:
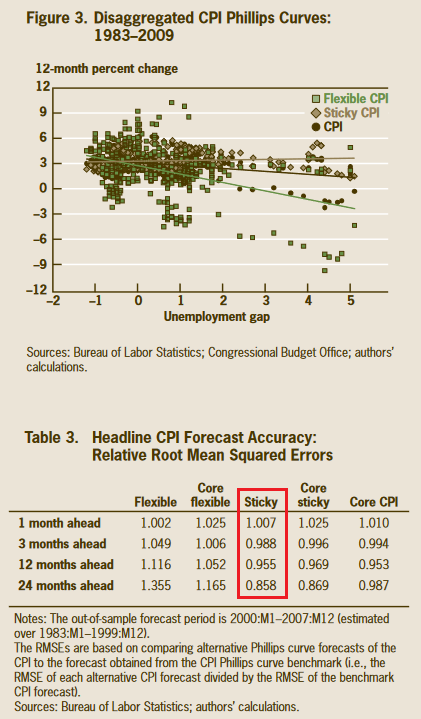
To explain, the chart and the red box above show how the Sticky CPI has the smallest forecasting error when attempting to predict the future direction of the headline CPI. Therefore, with the metric hitting a new 2022 high in July, investors' optimism contrasts with the “sticky” realities. To that point, the researchers concluded:
 Source: Atlanta/Cleveland Fed
Thus, while volatility in the energy markets made the headline CPI look more attractive to the “soft landing” crowd, the Sticky CPI provides important clues about how embedded inflation is in the U.S. economy.
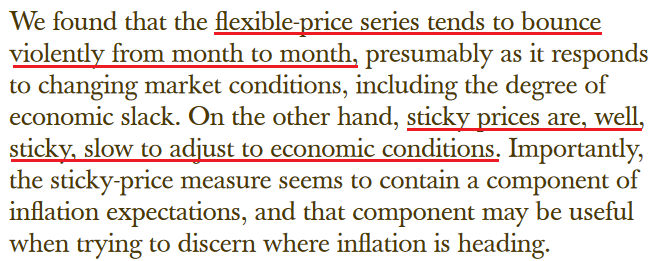
Continuing the theme, I’ve long warned that rent inflation would prove problematic for the headline CPI. Moreover, with the Shelter CPI hitting a new 2022 high, it’s another indicator of why the Fed’s war with inflation will be one of attrition.
Please see below:
Finally, while the inflation pause was met with applause, the headline CPI could repeat the feat for another eight months and still be 1.1% above the Fed’s 2% target in March 2023.
Please see below:
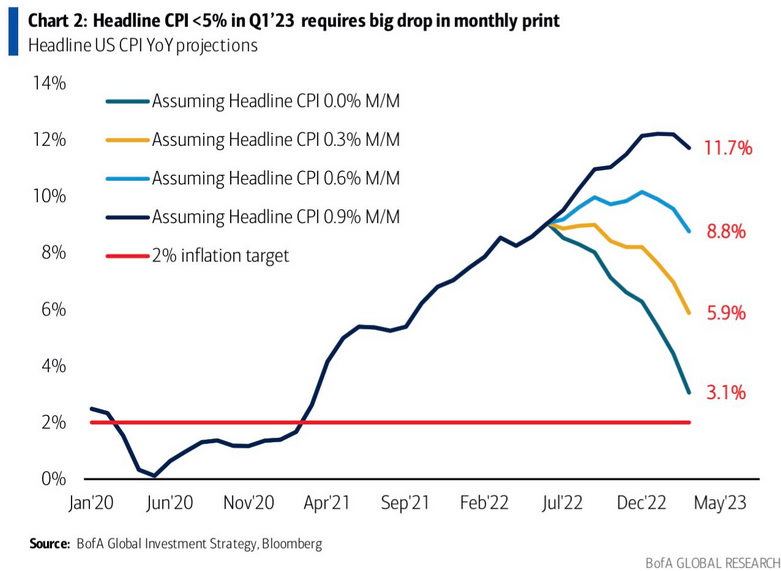
To explain, the various lines above track the trajectory of the YoY percentage change in the headline CPI, assuming different MoM scenarios. If you analyze the teal line, you can see that a flat headline CPI for the next eight months would put the headline CPI at 3.1% YoY in March 2023.
However, with the sticky inflation components still increasing, that forecast would require energy prices to decelerate MoM for the next eight months. Conversely, the light blue and gold lines are more reflective of fundamental reality. Under those scenarios, 0.3% to 0.6% MoM increases would put the headline CPI at 5.9% YoY and 8.8% YoY in March 2023.
Thus, those front-running a potential dovish pivot don’t realize that material deflation is needed to reach the Fed’s 2% target anytime soon; and with the Sticky CPI hitting a new 2022 high, does it seem like we’re near that point?
Fed Not Impressed
While investors clamor for the next round of QE, Fed officials poured cold water on that notion on Aug. 10. For example, Minneapolis Fed President Neel Kashkari (a reformed dove) said, “I think a much more likely scenario is we will raise rates to some point and then we will sit there until we get convinced that inflation is well on its way back down to 2% before I would think about easing back on interest rates.”
As a result, the man “who prior to the pandemic was the central bank’s most dovish policymaker” sees the U.S. federal funds rate (FFR) moving materially higher in the months ahead.
Please see below:
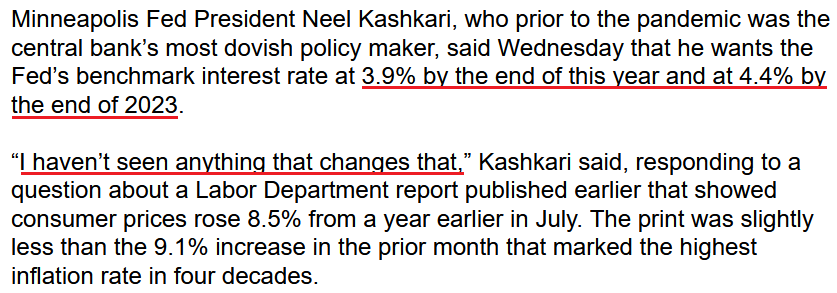 Source: Bloomberg
Moreover, while Chicago Fed President Charles Evans welcomed the monthly pullback, he said on Aug. 10 that inflation remains “unacceptably high” and “that we will be increasing rates the rest of this year and into next year to make sure inflation gets back to our 2% objective.”
The Bottom Line
While the headline CPI retreated in July, the impact of lower oil and gas prices was far from unexpected. Moreover, while stock investors went all in, the PMs underperformed, and the GDXJ ETF gave up nearly all of its intraday gains. In addition, the relative weakness occurred alongside a decline in U.S. Treasury yields and a sharp drop in the USD Index. As such, the PMs likely understand what the stock bulls will realize in the months ahead.
In conclusion, the PMs rallied on Aug. 10; but when considering the pullback in interest rates and the U.S. dollar, their performances were relatively poor. Therefore, the medium-term backdrop is much less optimistic than the S&P 500's price action suggests.
Overview of the Upcoming Part of the Decline
- It seems to me that the corrective upswing is either over or about to be over, and that the next big move lower is about to start.
- If we see a situation where miners slide in a meaningful and volatile way while silver doesn’t (it just declines moderately), I plan to – once again – switch from short positions in miners to short positions in silver. At this time, it’s too early to say at what price levels this could take place and if we get this kind of opportunity at all – perhaps with gold prices close to $1,600.
- I plan to exit all remaining short positions once gold shows substantial strength relative to the USD Index while the latter is still rallying. This may be the case with gold prices close to $1,400. I expect silver to fall the hardest in the final part of the move. This moment (when gold performs very strongly against the rallying USD and miners are strong relative to gold after its substantial decline) is likely to be the best entry point for long-term investments, in my view. This can also happen with gold close to $1,400, but at the moment it’s too early to say with certainty.
- The above is based on the information available today, and it might change in the following days/weeks.
You will find my general overview of the outlook for gold on the chart below:
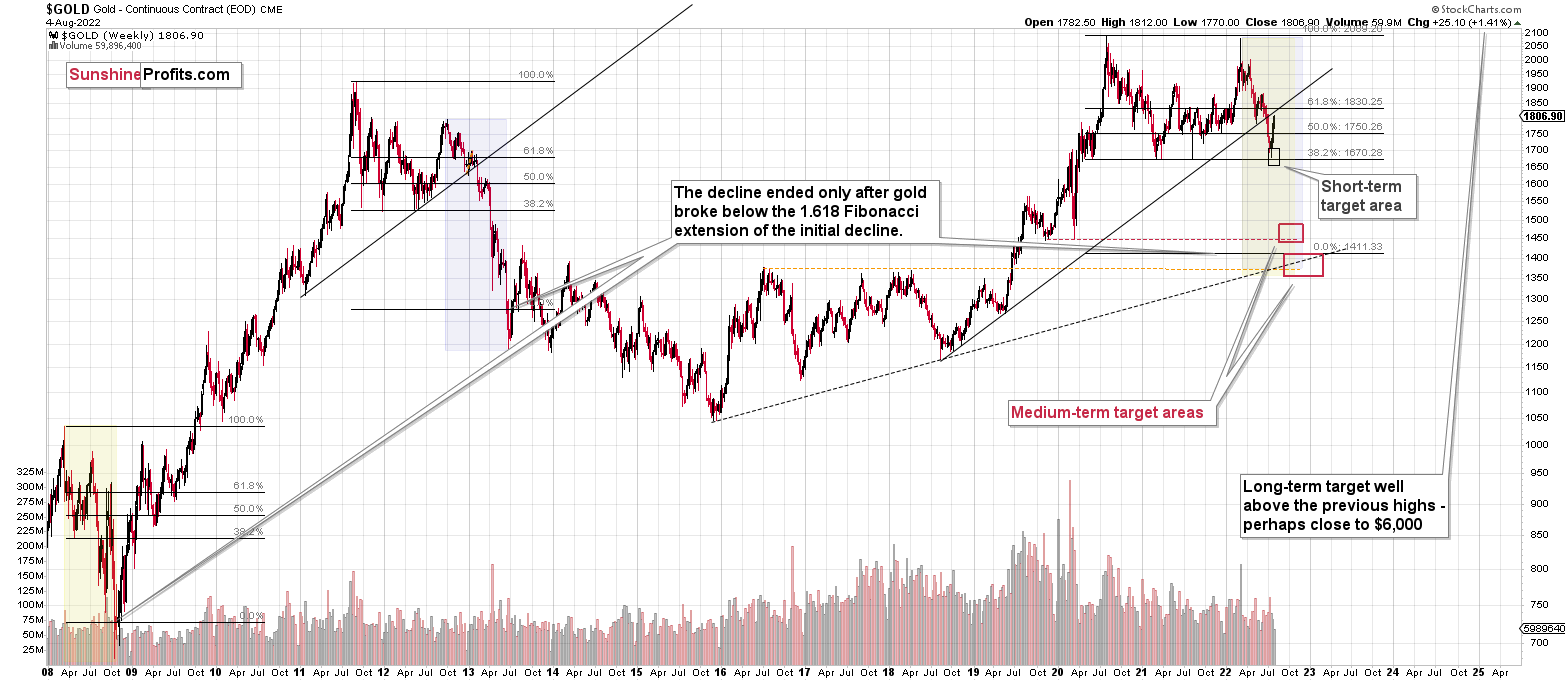
Please note that the above timing details are relatively broad and “for general overview only” – so that you know more or less what I think and how volatile I think the moves are likely to be – on an approximate basis. These time targets are not binding nor clear enough for me to think that they should be used for purchasing options, warrants, or similar instruments.
Summary
Summing up, it seems that the corrective upswing is over (or close to being over), which means that the powerful medium-term downtrend can now resume.
Last week, we closed yet another profitable trade in a row. This year’s profits are already enormous, but it seems likely to me that they will grow even more in the following weeks and months. Making money on corrections during powerful trends is a difficult feat, but you managed to do just that – congratulations!
On an administrative note, I will be traveling next week, and therefore, Gold & Silver Trading Alerts posted during next week will not include the regular technical analysis – they will focus on the fundamental aspects instead. The next regular technical analysis will be posted on Monday, Aug. 15. I will keep you informed if anything major changes (which is unlikely).
Moreover, please note that it’s not only the profits on the long positions that are so great about this success – it’s also the ability to get back on the short side of the market at more favorable (higher) prices, thus increasing the likely profits from the current trade. Congratulations, once again!
Also, please note that I will be updating the targets for the leveraged ETFs as we move closer to them, as their prices will depend on the path prices take to reach their targets.
After the final sell-off (that takes gold to about $1,350-$1,500), I expect the precious metals to rally significantly. The final part of the decline might take as little as 1-5 weeks, so it's important to stay alert to any changes.
As always, we'll keep you – our subscribers – informed.
To summarize:
Trading capital (supplementary part of the portfolio; our opinion): Full speculative short positions (300% of the full position) in junior mining stocks are justified from the risk to reward point of view with the following binding exit profit-take price levels:
Mining stocks (price levels for the GDXJ ETF): binding profit-take exit price: $20.32; stop-loss: none (the volatility is too big to justify a stop-loss order in case of this particular trade)
Alternatively, if one seeks leverage, we’re providing the binding profit-take levels for the JDST (2x leveraged). The binding profit-take level for the JDST: $29.87; stop-loss for the JDST: none (the volatility is too big to justify a SL order in case of this particular trade).
For-your-information targets (our opinion; we continue to think that mining stocks are the preferred way of taking advantage of the upcoming price move, but if for whatever reason one wants / has to use silver or gold for this trade, we are providing the details anyway.):
Silver futures downside profit-take exit price: $12.32
SLV profit-take exit price: $11.32
ZSL profit-take exit price: $79.87
Gold futures downside profit-take exit price: $1,504
HGD.TO – alternative (Canadian) 2x inverse leveraged gold stocks ETF – the upside profit-take exit price: $19.87
HZD.TO – alternative (Canadian) 2x inverse leveraged silver ETF – the upside profit-take exit price: $49.87
Long-term capital (core part of the portfolio; our opinion): No positions (in other words: cash)
Insurance capital (core part of the portfolio; our opinion): Full position
Whether you’ve already subscribed or not, we encourage you to find out how to make the most of our alerts and read our replies to the most common alert-and-gold-trading-related-questions.
Please note that we describe the situation for the day that the alert is posted in the trading section. In other words, if we are writing about a speculative position, it means that it is up-to-date on the day it was posted. We are also featuring the initial target prices to decide whether keeping a position on a given day is in tune with your approach (some moves are too small for medium-term traders, and some might appear too big for day-traders).
Additionally, you might want to read why our stop-loss orders are usually relatively far from the current price.
Please note that a full position doesn't mean using all of the capital for a given trade. You will find details on our thoughts on gold portfolio structuring in the Key Insights section on our website.
As a reminder - "initial target price" means exactly that - an "initial" one. It's not a price level at which we suggest closing positions. If this becomes the case (as it did in the previous trade), we will refer to these levels as levels of exit orders (exactly as we've done previously). Stop-loss levels, however, are naturally not "initial", but something that, in our opinion, might be entered as an order.
Since it is impossible to synchronize target prices and stop-loss levels for all the ETFs and ETNs with the main markets that we provide these levels for (gold, silver and mining stocks - the GDX ETF), the stop-loss levels and target prices for other ETNs and ETF (among other: UGL, GLL, AGQ, ZSL, NUGT, DUST, JNUG, JDST) are provided as supplementary, and not as "final". This means that if a stop-loss or a target level is reached for any of the "additional instruments" (GLL for instance), but not for the "main instrument" (gold in this case), we will view positions in both gold and GLL as still open and the stop-loss for GLL would have to be moved lower. On the other hand, if gold moves to a stop-loss level but GLL doesn't, then we will view both positions (in gold and GLL) as closed. In other words, since it's not possible to be 100% certain that each related instrument moves to a given level when the underlying instrument does, we can't provide levels that would be binding. The levels that we do provide are our best estimate of the levels that will correspond to the levels in the underlying assets, but it will be the underlying assets that one will need to focus on regarding the signs pointing to closing a given position or keeping it open. We might adjust the levels in the "additional instruments" without adjusting the levels in the "main instruments", which will simply mean that we have improved our estimation of these levels, not that we changed our outlook on the markets. We are already working on a tool that would update these levels daily for the most popular ETFs, ETNs and individual mining stocks.
Our preferred ways to invest in and to trade gold along with the reasoning can be found in the how to buy gold section. Furthermore, our preferred ETFs and ETNs can be found in our Gold & Silver ETF Ranking.
As a reminder, Gold & Silver Trading Alerts are posted before or on each trading day (we usually post them before the opening bell, but we don't promise doing that each day). If there's anything urgent, we will send you an additional small alert before posting the main one.
Thank you.
Przemyslaw Radomski, CFA
Founder, Editor-in-chief

