

Briefly: in our opinion, full (300% of the regular position size) speculative short positions in junior mining stocks are justified from the risk/reward point of view at the moment of publishing this Alert.
The situation in the precious metals markets remains practically unchanged on the technical front and confirms what I wrote in my previous analyses. Therefore, today I will once again focus on the fundamentals. However, in tomorrow's Gold & Silver Trading Alert there will be a more detailed part from a technical point of view.
The Lesser of Two Evils
While I’ve warned for months that unanchored inflation would force the Fed’s hand, hawkish rhetoric and policies are now obvious to investors. Moreover, with the hyper-inflationist ‘death of the dollar’ crowd increasingly anxious, their mettle has come under immense pressure. To explain, I wrote on Nov. 18, 2021:
The hyper-inflationists are missing the forest through the trees. In their argument, they assume that high U.S. debt levels make raising interest rates impossible. As a result, the U.S. government will allow inflation to run rampant and the U.S. dollar will crash in the process. However, while it’s an interesting story, it’s unrealistic. And why is that?
Well, for one, not raising interest rates will likely do more harm to the U.S. economy than tightening monetary policy. The reasons are outlined above: if prices keep rising and consumer confidence keeps falling, eventually demand destruction unfolds. As a result, if policymakers don’t solve their inflationary conundrum, failure to do so will likely push the U.S. economy into recession.
Second, the political component shouldn’t be ignored. Biden’s approval ratings keep hitting new lows along with consumer confidence. Thus, is it in his best interest to maintain the status quo? Of course not. That’s why he’s been so forceful on inflation over the last few weeks. Essentially, if he (and/or the Fed) does nothing, he’ll likely lose the next presidential election and the Democrats will likely lose control of Congress. However, if he tames inflation, then he’s a hero. And left with those two options, which one do you think he’ll choose?
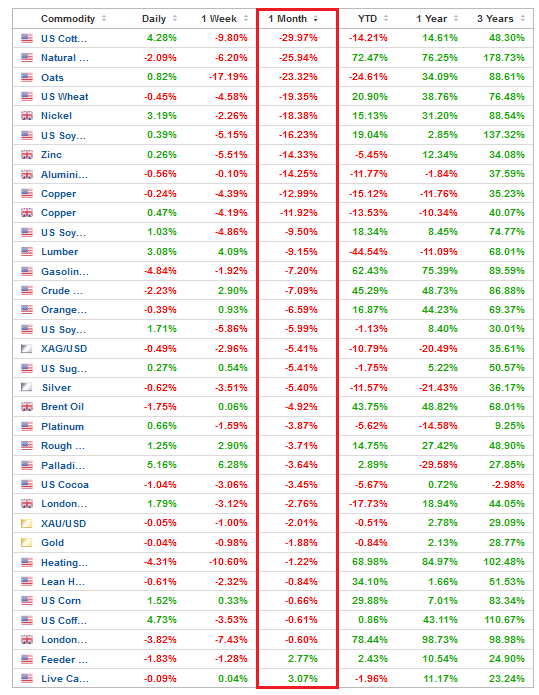
To that point, with six rate hikes realized in 2022 (25 basis point increments) and Fed officials amplifying their hawkish threats, commodity investors have run for cover.
Please see below:
 Source: Investing.com
To explain, the table above tracks the performance of commodities over various timeframes. If you analyze the vertical red rectangle, you can see that most commodities have been crushed over the last month. Moreover, with the GDXJ ETF also suffering mightily, lower prices were always necessary for the Fed to achieve its inflation goal. Therefore, the fundamental thesis continues to unfold as expected.
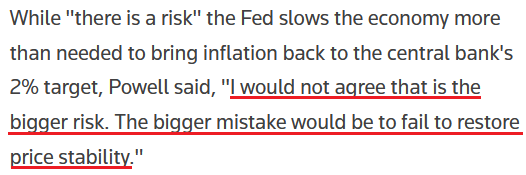
Furthermore, Fed Chairman Jerome Powell reiterated his conviction in fighting inflation on Jun. 29. Likewise, while letting inflation rage was never a realistic outcome, he understands that a recession that kills inflation is much better than a hyper-inflationary collapse.
He said that while the U.S. economy is "in pretty strong shape," the path to a "soft landing" becomes "significantly more challenging" the longer inflation persists.
As a result:
"The clock is kind of running on how long will you remain in a low-inflation regime (...). The risk is that because of the multiplicity of shocks you start to transition into a higher inflation regime, and our job is to literally prevent that from happening and we will prevent that from happening."
Therefore, while I've long warned that inflation was the most important fundamental variable, the hyper-inflationists realize that Powell has a similar belief.
Please see below:
 Source: Reuters
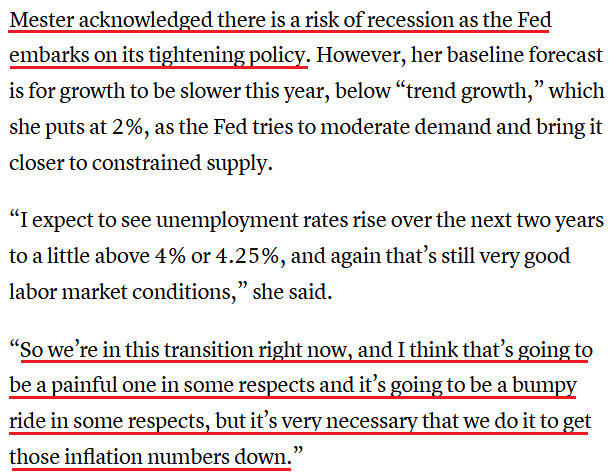
Supporting the claim, Cleveland Fed President Loretta Mester said on Jun. 29 that “Job one for us now is to get inflation rates under control, and I think right now that’s coloring how consumers are feeling about the economy and where it’s going.”
“If conditions were exactly the way they were today going into that meeting – if the meeting were today – I would be advocating for 75 [basis points] because I haven’t seen the kind of numbers on the inflation side that I need to see in order to think that we can go back to a 50 increase.”
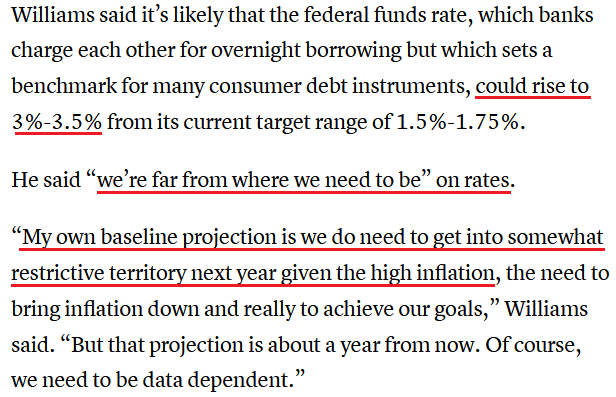
Thus, she expects 12 to 14 rate hikes in 2022:
“I think getting interest rates up to that 3-3.5%; it’s really important that we do that, and do it expeditiously and do it consistently as we go forward, so it’s after that point where I think there is more uncertainty about how far we’ll need to go in order to rein in inflation,”
Furthermore, she essentially recited my points from Nov. 18:
Please see below:
 Source: CNBC
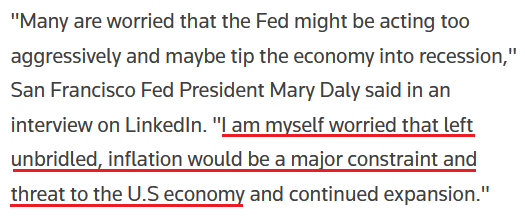
Making three of a kind, San Francisco Fed President Mary Daly said on Jun. 28 that the Fed is "tapping the brakes" to cool demand. "We are working towards that as quickly as we possibly can, and hopefully Americans everywhere will start to see some relief in their pocketbooks."
In addition, she also cited my argument:
 Source: Reuters
Continuing the theme, New York Fed President John Williams (a reformed dove) said on Jun. 28: “a slowdown [is what] we need to see in the economy to really reduce the inflationary pressures that we have and bring inflation down.”
He added:
"We need to move expeditiously. In terms of our next meeting I think 50 [basis points] or 75 is clearly going to be the debate."
As a result, anxiety in the stock and commodities markets should intensify in the months ahead.
 Source: CNBC
Thus, while I've noted on many occasions that unanchored inflation left unchecked is worse than a recession induced by interest rate hikes, Fed officials understand that the latter is the lesser of two evils. As a result, my comments from Apr. 6 continue to bear fruit. I wrote:
Please remember that the Fed needs to slow the U.S. economy to calm inflation, and rising asset prices are mutually exclusive to this goal. Therefore, officials should keep hammering the financial markets until investors finally get the message.
Moreover, with the Fed in inflation-fighting mode and reformed doves warning that the U.S. economy “could teeter” as the drama unfolds, the reality is that there is no easy solution to the Fed’s problem. To calm inflation, it has to kill demand. If that occurs, investors should suffer a severe crisis of confidence.
To Be, or Not to Be
While recession fears have spread across Wall Street, a realization, or lack thereof, could have major implications on the performances of the S&P 500 and the GDXJ ETF. However, an economic malaise is much more likely than not. To explain, I wrote on Jun. 1:
While the consensus either doesn't care or doesn't know history, unanchored inflation in the 1970s/1980s pushed the U.S. into recession four times over ~12 years (the vertical gray bars below). For context, if we exclude the COVID-19 pandemic, the U.S. has only entered a recession once in the last 20 years. Thus, putting a Band-Aid on a gunshot wound won't do much good.
Please see below:
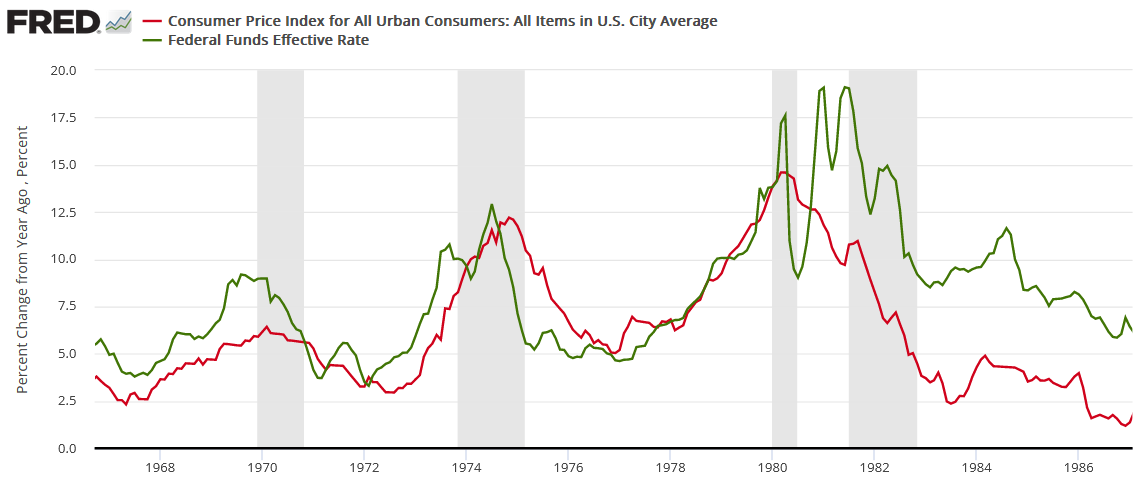
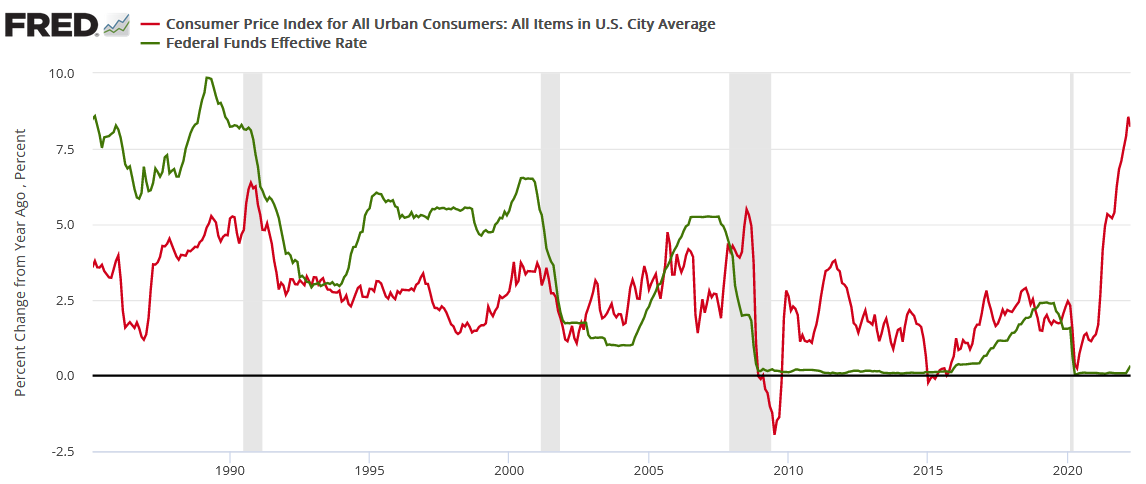
Likewise, modern history sings a similar tune. For example, the Fed has never curbed inflation without the U.S. federal funds rate eclipsing the YoY CPI rate at some point. Therefore, if the Fed pauses at 1.83% and inflation falls to its 2% target, Powell and his crew would accomplish something that’s never been done.
To that point, notice how every inflation spike leads to a higher U.S. federal funds rate and then a recession. As such, do you really think this time is different?
Therefore, if (when) a recession materializes, the S&P 500 and the GDXJ ETF should hit new lows.
Please see below:
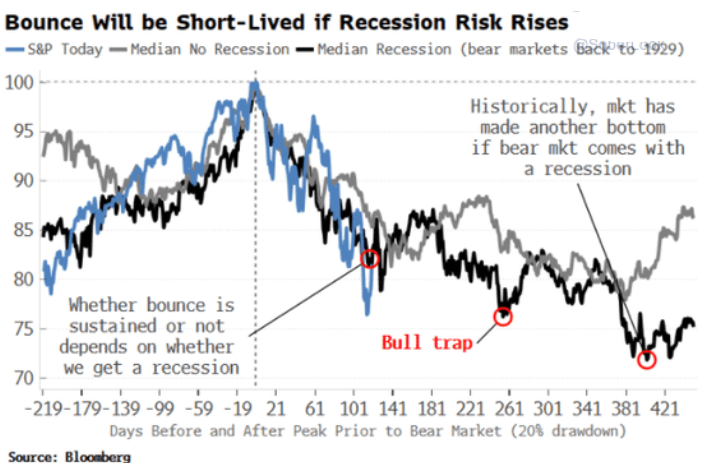
To explain, the blue line above tracks the S&P 500’s current path, while the gray line above tracks the index’s median movement during no-recession bear markets (20% declines) since 1929. As you can see, the S&P 500 often doesn’t hit a new low after an initial sharp drawdown.
Conversely, the black line above tracks the S&P 500’s median path when a recession occurs. If you analyze the performance, you can see that sharp drawdowns often elicit failed relief rallies that culminate in new lows. Moreover, it’s not uncommon for a second new low to materialize. Thus, with a recession likely on the horizon, the S&P 500 and the GDXJ ETF are likely far from medium-term bottoms.
In addition, while inflation is higher now than in 2008, the monetary backdrop is eerily similar.
Please see below:
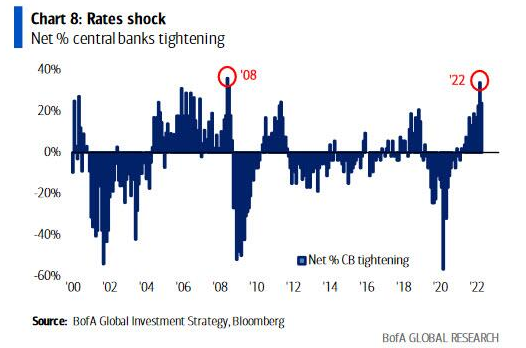
To explain, the blue bars above track the net percentage of global central banks tightening monetary policy. If you analyze the annotations, you can see that 2022 rivals 2008. As a result, the immense liquidity drain should have drastic consequences in the months ahead.
A Real Reminder
Reality has returned to the bond market, and the realization is profoundly bearish for the PMs. To explain, I wrote on Apr. 20:
The next leg higher for the U.S. 10-Year real yield may occur for the opposite reasons. For example, I noted above that we don’t need nominal yields to rise for real yields to rise. Moreover, while the U.S. 10-Year Treasury yield was undervalued in 2021 and was poised to move higher, the U.S. 10-Year breakeven inflation rate is overvalued in 2022 and is poised to move lower.
Please see below:
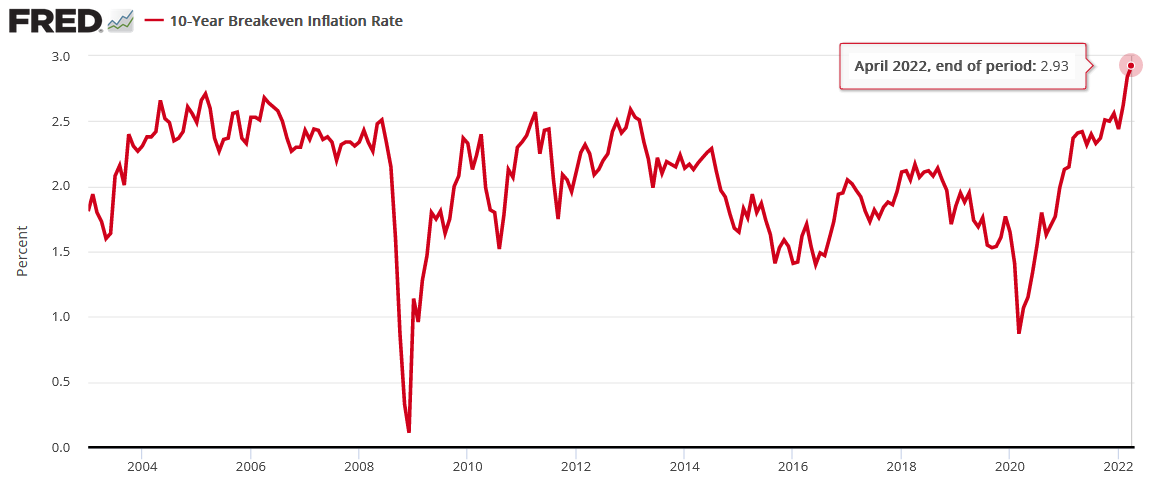
To explain, the U.S. 10-Year breakeven inflation rate ended the Apr. 19 session at 2.93%, only slightly below the all-time high of 2.95% set in March. However, like the PMs, investors’ long-term inflation expectations remain in la-la land.
To that point, with the U.S. 10-Year breakeven inflation rate ending the Jun. 29 session at 2.36%, the Fed doubters and their assets are in free fall.
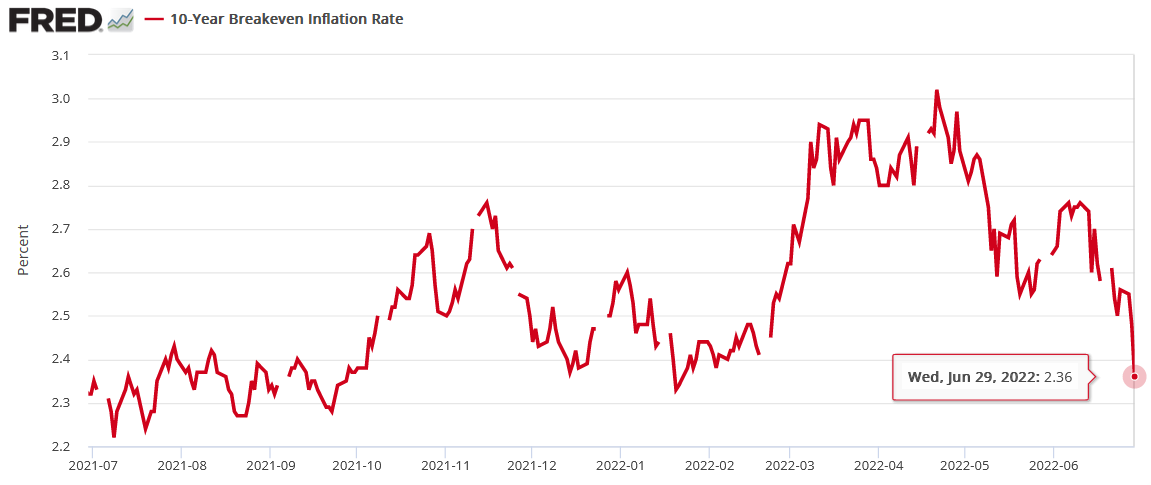
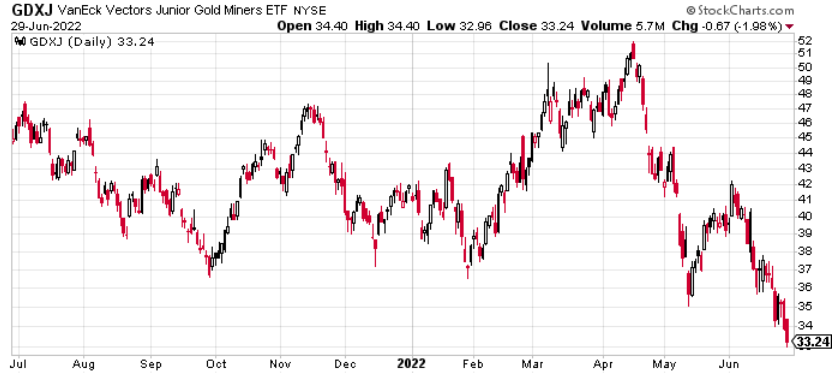
Likewise, notice the similarity between the above chart and the GDXJ ETF’s 12-month chart?
The Bottom Line
The fundamental thesis continues to unfold as expected: the Fed is hawked up, and their policies have helped uplift the USD Index and the U.S. 10-Year real yield. Moreover, since these metrics are the PMs' main fundamental adversaries, the GDXJ ETF has gone in the opposite direction.
Furthermore, with the NASDAQ Composite highly allergic to higher real yields, the developments also hurt the S&P 500. Therefore, with the junior miners more correlated with the general stock market, the medium-term fundamental outlook remains bright for our short position.
In conclusion, the PMs declined on Jun. 29, as many commodities have lost their luster. Furthermore, with more rate hikes poised to uplift the USD Index and the U.S. 10-Year real yield in the months ahead, gold, silver, and mining stocks are stuck in no-man's land.
Overview of the Upcoming Part of the Decline
- It seems to me that the precious metals market is already in its medium-term decline that is about to take it much lower (to the 2021 lows in case of gold - $1,650 - $1,700)
- If we see a situation where miners slide in a meaningful and volatile way while silver doesn’t (it just declines moderately), I plan to – once again – switch from short positions in miners to short positions in silver. At this time, it’s too early to say at what price levels this could take place and if we get this kind of opportunity at all – perhaps with gold prices close to $1,600.
- I plan to exit all remaining short positions once gold shows substantial strength relative to the USD Index while the latter is still rallying. This may be the case with gold close to $1,400. I expect silver to fall the hardest in the final part of the move. This moment (when gold performs very strongly against the rallying USD and miners are strong relative to gold after its substantial decline) is likely to be the best entry point for long-term investments, in my view. This can also happen with gold close to $1,400, but at the moment it’s too early to say with certainty.
- The above is based on the information available today, and it might change in the following days/weeks.
You will find my general overview of the outlook for gold on the chart below:
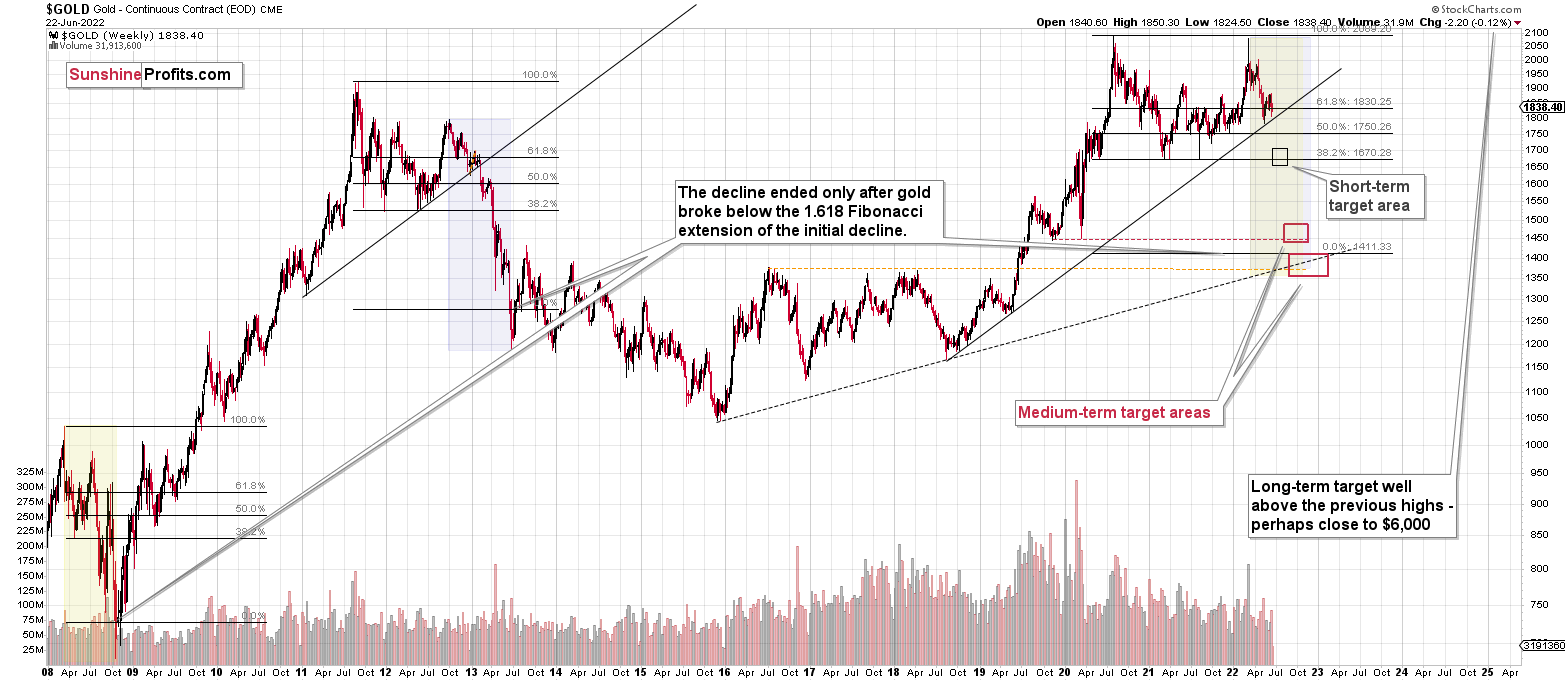
Please note that the above timing details are relatively broad and “for general overview only” – so that you know more or less what I think and how volatile I think the moves are likely to be – on an approximate basis. These time targets are not binding or clear enough for me to think that they should be used for purchasing options, warrants, or similar instruments.
Summary
Summing up, it seems to me that the short-term rally in the precious metals market is over, and the decline will now continue. And the tiny correction’s days are likely numbered, too.
I previously wrote that the profits from the previous long position (congratulations once again) were likely to further enhance the profits on this huge decline, and that’s exactly what happened. The profit potential with regard to the upcoming gargantuan decline remains huge.
As investors are starting to wake up to reality, the precious metals sector (particularly junior mining stocks) is declining sharply. Here are the key aspects of the reality that market participants have ignored:
- rising real interest rates,
- rising USD Index values.
Both of the aforementioned are the two most important fundamental drivers of the gold price. Since neither the USD Index nor real interest rates are likely to stop rising anytime soon (especially now that inflation has become highly political), the gold price is likely to fall sooner or later. Given the analogy to 2012 in gold, silver, and mining stocks, “sooner” is the more likely outcome.
After the final sell-off (that takes gold to about $1,350-$1,500), I expect the precious metals to rally significantly. The final part of the decline might take as little as 1-5 weeks, so it's important to stay alert to any changes.
As always, we'll keep you – our subscribers – informed.
To summarize:
Trading capital (supplementary part of the portfolio; our opinion): Full speculative short positions (300% of the full position) in junior mining stocks are justified from the risk to reward point of view with the following binding exit profit-take price levels:
Mining stocks (price levels for the GDXJ ETF): binding profit-take exit price: $27.32; stop-loss: none (the volatility is too big to justify a stop-loss order in case of this particular trade)
Alternatively, if one seeks leverage, we’re providing the binding profit-take levels for the JDST (2x leveraged). The binding profit-take level for the JDST: $18.35; stop-loss for the JDST: none (the volatility is too big to justify a SL order in case of this particular trade).
For-your-information targets (our opinion; we continue to think that mining stocks are the preferred way of taking advantage of the upcoming price move, but if for whatever reason one wants / has to use silver or gold for this trade, we are providing the details anyway.):
Silver futures downside profit-take exit price: $17.22
SLV profit-take exit price: $16.22
ZSL profit-take exit price: $41.47
Gold futures downside profit-take exit price: $1,706
HGD.TO – alternative (Canadian) 2x inverse leveraged gold stocks ETF – the upside profit-take exit price: $11.87
HZD.TO – alternative (Canadian) 2x inverse leveraged silver ETF – the upside profit-take exit price: $31.87
Long-term capital (core part of the portfolio; our opinion): No positions (in other words: cash)
Insurance capital (core part of the portfolio; our opinion): Full position
Whether you’ve already subscribed or not, we encourage you to find out how to make the most of our alerts and read our replies to the most common alert-and-gold-trading-related-questions.
Please note that we describe the situation for the day that the alert is posted in the trading section. In other words, if we are writing about a speculative position, it means that it is up-to-date on the day it was posted. We are also featuring the initial target prices to decide whether keeping a position on a given day is in tune with your approach (some moves are too small for medium-term traders, and some might appear too big for day-traders).
Additionally, you might want to read why our stop-loss orders are usually relatively far from the current price.
Please note that a full position doesn't mean using all of the capital for a given trade. You will find details on our thoughts on gold portfolio structuring in the Key Insights section on our website.
As a reminder - "initial target price" means exactly that - an "initial" one. It's not a price level at which we suggest closing positions. If this becomes the case (as it did in the previous trade), we will refer to these levels as levels of exit orders (exactly as we've done previously). Stop-loss levels, however, are naturally not "initial", but something that, in our opinion, might be entered as an order.
Since it is impossible to synchronize target prices and stop-loss levels for all the ETFs and ETNs with the main markets that we provide these levels for (gold, silver and mining stocks - the GDX ETF), the stop-loss levels and target prices for other ETNs and ETF (among other: UGL, GLL, AGQ, ZSL, NUGT, DUST, JNUG, JDST) are provided as supplementary, and not as "final". This means that if a stop-loss or a target level is reached for any of the "additional instruments" (GLL for instance), but not for the "main instrument" (gold in this case), we will view positions in both gold and GLL as still open and the stop-loss for GLL would have to be moved lower. On the other hand, if gold moves to a stop-loss level but GLL doesn't, then we will view both positions (in gold and GLL) as closed. In other words, since it's not possible to be 100% certain that each related instrument moves to a given level when the underlying instrument does, we can't provide levels that would be binding. The levels that we do provide are our best estimate of the levels that will correspond to the levels in the underlying assets, but it will be the underlying assets that one will need to focus on regarding the signs pointing to closing a given position or keeping it open. We might adjust the levels in the "additional instruments" without adjusting the levels in the "main instruments", which will simply mean that we have improved our estimation of these levels, not that we changed our outlook on the markets. We are already working on a tool that would update these levels daily for the most popular ETFs, ETNs and individual mining stocks.
Our preferred ways to invest in and to trade gold along with the reasoning can be found in the how to buy gold section. Furthermore, our preferred ETFs and ETNs can be found in our Gold & Silver ETF Ranking.
As a reminder, Gold & Silver Trading Alerts are posted before or on each trading day (we usually post them before the opening bell, but we don't promise doing that each day). If there's anything urgent, we will send you an additional small alert before posting the main one.
Thank you.
Przemyslaw Radomski, CFA
Founder, Editor-in-chief

