

Briefly: in our opinion, full (250% of the regular position size) speculative short positions in mining stocks are justified from the risk/reward point of view at the moment of publishing this Alert.
The miners moved higher instead of moving lower yesterday, which might make one concerned about our current positions. And rightfully so - one should be on a constant lookout for the things that might invalidate one's current position (that's the opposite of confirmation bias). That's definitely our aim.
So, what exactly happened in the miners?
In the Miners Yesterday
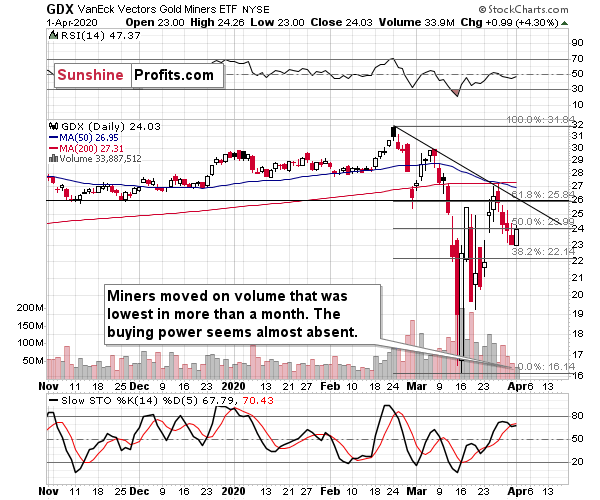
Miners moved higher on VERY low volume. The volume was the lowest of any session since the final part of the February.
That's exactly what a breather within a decline - a one that doesn't change the trend - should look like.
But miners didn't rally visibly - even just one day - before the mid-March plunge!
Didn't they? Please take a look at what happened on March 10th. The candlestick is black, because GDX declined on an intraday basis, but the closing price is higher than the March 9th closing price. Small, but still, it was a daily rally.
In yesterday's analysis, we explained that the bases (steady parts of the decline) are getting bigger, which likely indicates that the real moves (volatile parts of the decline) are also getting bigger.
If this is the case, then it's only natural to expect the corrective upswings to be more visible during this "base". And, well, it was more visible. The volume was still very low, so yesterday's session appears not to invalidate anything.
But let's double check, by looking at details from the 4-hour candlestick chart.
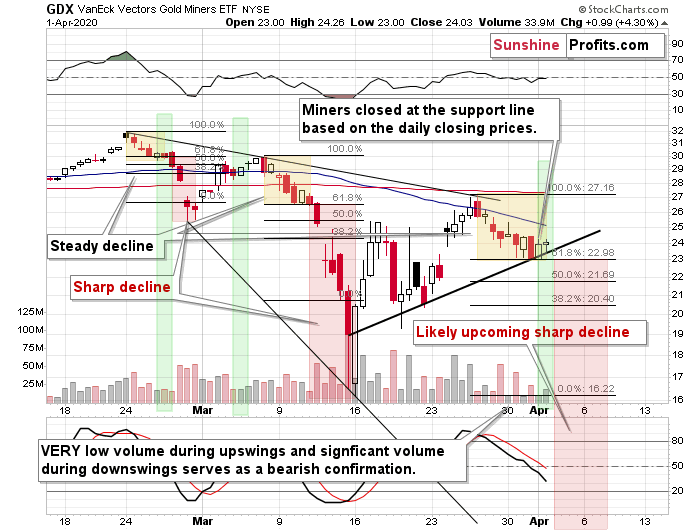
This chart does not only tell us that what we saw yesterday was normal - it actually provides us with bearish confirmations.
The 4-hour candlesticks mean that each session is effectively broken into two candlesticks, instead of one. While it is relatively normal for the volume to be relatively low during the first half of the day, it is usually the case that the volume during the second half of the session is bigger.
Now, the point is that the volume during the second half of yesterday's session was very low. This emphasizes how weak the bulls are and how little buying power there is right now. But let's compare it to the recent past.
The green rectangles on the above chart represent the second halves of the sessions when the volume was approximately as low as it was yesterday. This was the case on March 4th, and on February 26th. In the latter case, the decline accelerated on the next day. In the former case, it was exactly one daily close away from the top. Based on these similarities, the implications of yesterday's session are actually bearish.
Since we saw an additional day of the "base", we need to update the analogy in terms of time that we described yesterday:
In late February, GDX declined steadily for 5 candlesticks (the above chart is based on 4-hourly candlesticks). Then it declined quickly for 3-4 candlesticks (there was a double bottom).
In mid-March, GDX declined steadily for 6 candlesticks. Then it declined quickly for 4-5 candlesticks (there was a double bottom).
Please note that there is a specific tendency for both: the base (steady decline) and the real move (quick decline). They were both slightly longer in the second case - each by 1 day. It's also interesting that we saw a double bottom at the end of each.
Now, GDX has been declining steadily for 8 candlesticks, which still seems to fit the above pattern quite well. If the more volatile part starts today - and this seems quite likely - then based on the above analogy, we can expect it to continue for about 5-7 trading days. This means that the bottom would be likely to form on April 8th (Wednesday) or April 9th (Thursday), or April 10th (Friday).
Based on yet another technique (the previous ones are the analogy between 2008 and 2020 in gold, and the one about miners' reaching their declining support line that we outlined on Monday) it seems that we'll see a major bottom in the precious metals market next week.
It could be the case we'll once again see a double bottom formation in the, but we have only one indication for it, so we wouldn't bet the farm on this particular scenario.
Please note that the above time prediction is very far from being written in stone. Conversely, we will be updating it as more details become available. Remember how it was with the recent long position in the miners? We've been changing the upside target for them multiple times, and we ended up closing the long position at the top, anyway.
Moreover, there's one more thing that we would like to tell you about the above chart. In both previous short-term declines, GDX declined more than below the 2.618 extension based on the size of the base (counting from the intraday high to the lowest closing price of the base). The day when GDX declined below the 2.618 extension, was the day when it formed the intraday bottom and the first of the two bottoms. And that could be a very important detail for the following week.
Interestingly, the 2.618 extension based on the current base is right at the mid-March low. This means that the GDX would likely stop at this level, similarly to how it stopped at the 2.618 extension in the first half of the March 13 session.
In mid-March, GDX declined about $4 in just a few hours after it broke below the 2.618 extension and in the upcoming decline, it would be likely to decline even more. Given our target at about $10, this would imply an approximately $6 move below the 2.618 extension level. It appears very extreme, but it's quite in tune with what happened in mid-March.
The important take-away here is that once GDX breaks below its mid-March low of about $16, it's likely to slide very fast and perhaps reverse before the end of the day - that's when the final bottom for this decline might be reached, and that's when when the best buying opportunity will present itself.
What else happened on the precious metals market yesterday? Not much, actually.
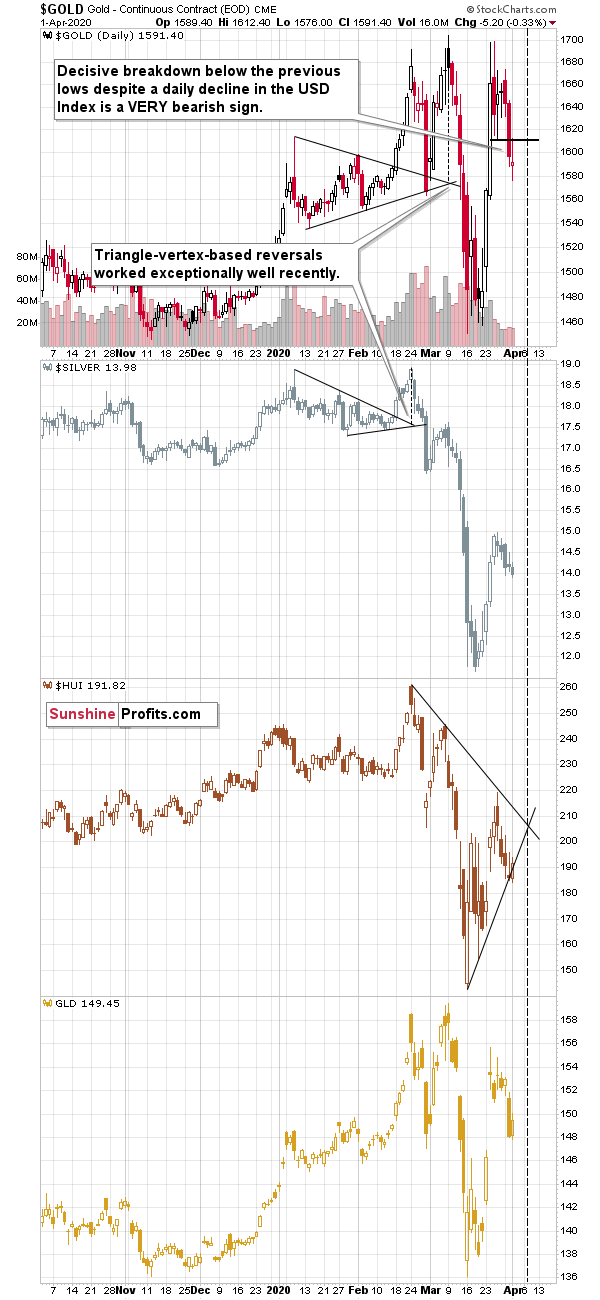
Gold moved back to its previously broken lows and it verified them as resistance. Silver declined a bit. While gold futures closed lower, the GLD ETF moved higher. This is not some manipulation-confirming event - futures and ETFs have different trading hours, so there will be discrepancies every now and then. The information about GLD is useful, because we can compare it to GDX's move.
Comparing miners' performance to the one of gold futures might make one believe that miners showed significant strength relative to gold. But they didn't, and comparing GDX and GLD proves it.
Over to Stocks and Readers' Questions
Before moving to replying to questions that we received recently, we would like to update our forecast for the stock market based on the US Covid-19 death toll. We previously wrote that the buying opportunity in stocks may present itself when the US death toll is counted in tens of thousands per day. It seems that we've been too conservative in our estimates. The US reached the 1 thousand deaths per day yesterday, and it's really just the very beginning. Consequently, in our view, the buying opportunity in the stock market is unlikely to present itself until the US Covid-19 death toll is at least 100,000 in one day.
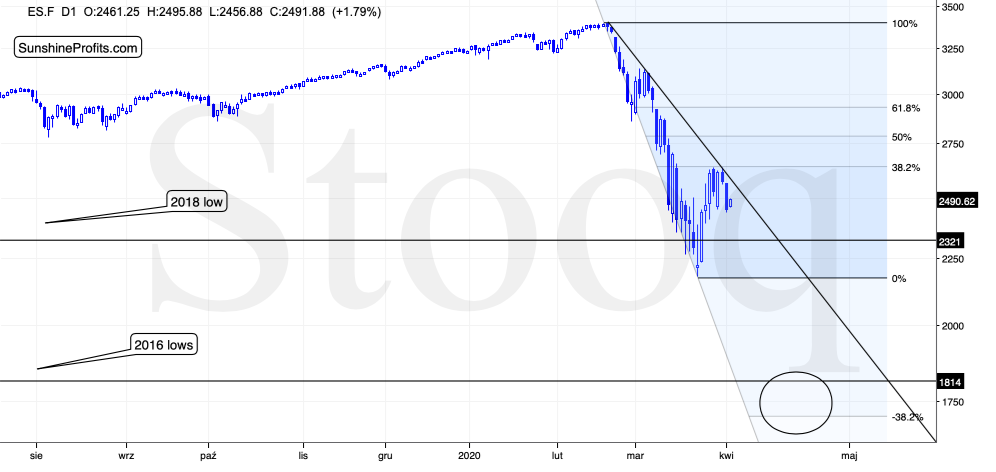
This could be below the 2016 lows, but it could even be lower - close to the 2008 lows. As we wrote before, we expect the precious metals sector to bottom well before the general stock market does.
Having said that, let's turn to questions.
The first question will seem weird, but please read it. We will explain shortly.
Q: I'm sorry, but at this point it is apparent to me that all of this technical analysis is pointless. Look at the last 3 or 4 months of updates. How many factors were 'verified' or 'confirmed' or whatever, and all of that was meaningless, all undone by one thing: gold rallied. Now, with gold at the door of 1700, we are to look for signs that the 'correction' is probably - maybe- over and put our money back in the market long term; money that we took out, because of the 'technical analysis' that warned of a drop below 1500, to 1350, whatever, many months ago. So all that was accomplished was the loss from selling at close to the bottom ($100 down) and another $100 lost from gains unrealized on the way up. Plus the money lost in short positions that didn't pan out.
Just go back and reread the alert from 8/17; it reads like a lot of others: all the factors are explained and lined up in favor of a particular result- which then never occurs. Then we go from short term to medium term, whatever the latter is, because we have been waiting for medium term for, how many months? Now tomorrow you will produce a great and detailed report explaining in detail what has happened, and what might happen, if this, that, or the other thing is 'verified' or 'confirmed'. Please realize that these terms have been, all along, inappropriate word choices, and are essentially meaningless. Fifteen factors 'verified' on Monday are often completely undone on Wednesday.
I am not criticizing your technical analysis skills, nor your efforts, which I know are very diligent. I just don't believe these efforts are of much value in today's market; basically, this year has been one of 'gold will do this, unless it does that". Frankly, I don't like paying money to lose money, and from about Oct of last year to now that has been the case.
I don't think we need 3 days or even one more day to conclude that gold is not going to see 1500 anytime soon. All you are doing is costing people money by not closing the shorts out today. Sure, we'll probably get a pullback, but you have been wedded to this idea of a big correction too long.
Frankly, I hope you are right and we get a huge decline in the next month. But I think you are going to lose a considerable number of subscribers if we don't. Again, this type of analysis doesn't seem to be working anymore.
A: The key detail: the above question was received on August 23rd, 2012. We flagged it to reply in detail later, and unfortunately, it got lost as then other flagged things covered it. We just discovered it today, while double-checking that we are replying to all messages that we received (we reply to some of them individually, especially those from accredited investors concerning special investment opportunities that they may qualify for).
We decided to quote it today to emphasize two things:
- Despite being able to pinpoint the turning points with near-perfect accuracy during the Covid-19 decline, there will also be times, when the market goes against us. While it may seem to be a great idea to put everything one owns into a heavily leveraged instrument right now (we can't lose, right?), it isn't such a great idea after all. Even with 90%+ accuracy, one has to be wrong every now and then, and when that happens, one needs to be sure that their account remains safe. They need to make sure that the correction in accuracy is just a correction in the account's value instead of being wiped out. The position size management is critical and this page features a simple simulation that every investor and trader should read - it's more or less in the middle of the page - a bit lower than the middle actually. It emphasizes both: the need to pay attention to risk in one's trading, and the need to be patient. The general rule of thumb is to have trades that don't risk more than 2% - 2.5% of capital per trade - and since our current size of positions is already huge (250% of the regular position size), it means that the maximum loss shouldn't exceed 5% - 6.25%). Different rules could apply to professionals, but in all cases, one needs to be aware of the risk and the fact that sometimes things will go against one.
- The technical analysis does, was, and will continue to work. All trades that we just executed and the massive amounts of money that you made were - all this was done thanks to the technical analysis. Your trading/investment account's results prove the usefulness of the technical analysis. Of course, it will not work in each case, but nobody said that it will work in each case. It will be useful regardless of changes in the market stages, political debates, economic cycles and so on. Why? Because it's essentially based on things that don't change. Whatever the prevailing economic theory is and whatever the business cycle part we are in, people will never stop feeling fear when things go bad, nor will they ever stop feel greed, when things get very profitable. These are the foundations of technical analysis, and all the techniques that we use on a daily basis is just how we can analyze it. The time when it starts to seem that technical analysis is no longer working, will really be the time, when one's patience is running out. Which brings us to point 3.
- As we already wrote above, patience is the key both in many trades, and in the entire concept of trading in general. Yes, the recent and the current trade are huge, and they are taking place fast, but this will not always be the case. At times, one would need to wait for weeks or months to make money on a given trade or for a series of trades to be profitable. It is quite often the case that people give up on a certain trade exactly at the moment when the market is about to turn in their favor. We've seen that countless times in previous years. People wait for profits on a given trade, they give up, stop reading the analyses and following the market, and it then finally moves as they wanted it to move. Then people get upset with the market and they come back to it only after many months, long after the trading opportunity missed is gone. And the worst thing is that people then often repeat the cycle - giving up on a trade just when it's about to become profitable. We received the above message on August 23, 2012, and you know what miners did next? After August 23, 2020, the GDX ETF moved higher by less than 17% and then it plunged by almost 60% in less than a year. Anyway, based on how volatile the market is right now and how similar is to what happened in 2008, it doesn't seem that we will have to wait long for the next big move...
Q: A word concerning the deployment of our long term investment capitol in your next missive would be appreciated. Thanks PS I intend to ride this bull with you to the bitter end!
A: Thank you for the trust! That's a great point about the investment capital. Yes, we might change our position in the long-term investment capital very soon. If gold plunges as we expect it to, we will most likely establish a full position in the investment capital. We generally planned not to enter the entire position at once, but given the volatility, the exceptionally favorable fundamental situation, and the myriads of technical confirmations, we might do so anyway. If we get only some of the confirmations, we might start with re-opening the long-term investment position in the PMs partially.
Q: Thanks for that, I have scouted google quickly, but don't have a clear answer for why the price of your continuous contract and my 'spot' related CFD, both shown in the screenshot, show very different behaviour in terms of reaching $1700 again, yours seem to say it did, whereas mine is well below circa 1620, peaked at 1645 odd. If you know the answer in a quiet time, I'd appreciate it.
A: Well, we can't speak for all the CFD providers out there - their values can differ from the futures prices, which is why we provide charts based on the latter. The futures are consistent over time, while CFDs may vary. While we can't say what made the price of the CFD that you're using very different from gold futures, we can say that since CFDs are ultimately a derivative on gold (just as gold futures are), the timing of the tops and bottoms should be the same as with gold and gold futures. Consequently, while the price targets from our gold-futures-based analysis may not apply directly to the CFD world, the moments to enter or exit the positions should be identical or at least very, very similar. You may want to monitor gold futures and/or silver, and/or (especially) mining stocks, to determine the entry and exit points in case of the instrument that you are using.
Q1: In the Gold & Silver alerts, the target for DUST ETF is 11.97$ & for JDST ETF its 16.27$. Their respective current prices on NYSE are coming 3.01$ and 2.72$ respectively. [Note: We updated them in the meantime, but the question still applies in general]
So accordingly, are these long positions whereas positions for GDX & GDXJ are short positions?
A1: Yes.
Q2: Do these ETF's, in which long position has to be taken, as far as i understand, and correct me if i am failing to grasp, will give approximate returns of 4 times & 5.9 times respectively of the capital deployed.
A2: To clarify, no positions have to be taken, especially the positions in the leveraged instruments, such as DUST or JDST. We're just writing our opinion what we view as justified from the risk to reward point of view. Everyone has to decide for themselves if they want to participate in a given trade or not. Please note that if one decides to proceed, one should not use a lot of their capital to do so (definitely not their entire capital in case of the leveraged ETFs like DUST or JDST!).
Still, in general, yes, in case of the leveraged ETFs, we expect their values to increase several times. Yes, we know that this seems extreme, but... These are extreme times, and we already made similarly extreme profits during both: the March decline, and the March rebound. Of course, that's just our opinion, and we could be wrong...
Q3: Secondly, say 1000 Equity Shares each are to be purchased ( i understand its long position) at current price, then if leverage is 2X now, as u wrote, then does it mean instead of full value of 3010$ & 2720$, i would be required to deploy 1000 X 3.01 / 2 =1505 $ for DUST and 1000 x 2.72 / 2 =1360 $ for JDST.
And thereby above mentioned profits of 4X & 5.9X as calculated by price moves, would further get doubled because of the available leverage of 2X on these and consequent half margin required to purchase 1000 shares each?
A3: Not really. The leverage is already "included" in the calculations for the leveraged products, and the purchase and exit are more straightforward. By buying, one is paying exactly what the ETFs are quoted at. Say, JDST closed at $2.50 yesterday, so to buy 1,000 shares, one would have to pay $2,500 (plus commission). If JDST gets to $14.87 and these 1,000 shares are then sold at that price, one would get $14,870 (minus commission). The profit would be $14,870 - $2,500 = $12,370 (minus the commissions). As the initial investment was $2,500 (plus commissions), this means a profit of (12370-2500)/2500 - 1 = 294.9% (actually a bit less due to commissions). Again, we can't guarantee that such gains would take place, but they are likely in our opinion.
Q: I'm really confused with the articles you write. This is not my expertise and I don't understand it well. However I have some insurance positions in precious metals as well as few miners. Could you please let me know, with a simple language, that what would be the bottom in gold and GDX, per your today evaluate of market? (I know it might change). I really appreciate it.
A: We are always providing our targets and all other trade-related details in the Summary of each Alert - precisely to make sure that even if something is unclear within the analysis, the summary will clarify it. The price targets are below the phrase "To summarize:". For instance, right now, the target for the GDX ETF is $10.32, and the price target for gold is $1,312.
On a side note, we are adding gold and silver back to the summary not as trade details (because we continue to think that miners have the best potential right now), but as a "FYI" (for your information) detail. It should be useful for those, who are not able to participate in the move in the mining stocks and/or would prefer to use silver and/or gold for whatever reason.
Summary
Summing up, it seems that we are already in the final huge downswing in the precious metals sector, but since it's the early part thereof, it's not yet volatile. This is in perfect tune with how the previous two declines in the mining stocks started.
Overall, it seems that the next major reversal might take place as early as next week. This might even be THE bottom for the precious metals sector.
The real panic on the US stock market will begin when people start dying from Covid-19 in the US in thousands per day. It might peak when the death toll is in tens of thousands per day. We hate to be right on this prediction, but we expect the number of the total confirmed cases in the US to be multiple times greater than the analogous number in China. At the moment of writing these words, the number of total confirmed cases in the US is about 217k and the death toll is above 5k and it's starting to accelerate (it just increased by more than 1k in a day).
It's 2008 on steroids.
Most importantly - stay healthy and safe. We're making a lot of money on these price moves (and we'll likely make much more in the following weeks and months), but you have to be healthy to really enjoy the results.
By the way, we recently opened a possibility to extend one's subscription for a year with a 10% discount in the yearly subscription fee (the profits that you took have probably covered decades of subscription fees...). It also applies to our All-Inclusive Package (if you didn't know - we just made huge gains shorting crude oil and are also making money on both the decline and temporary rebound in stocks). The boring time in the PMs is over and the time to pay close attention to the market is here - it might be a good idea to secure more access while saving 10% at the same time.
Important: If your subscription got renewed recently, but you'd like to secure more access at a discount - please let us know, we'll make sure that the discount applies right away, while it's still active. Moreover, please note that you can secure more access than a year - if you secured a yearly access, and add more years to your subscription, each following year will be rewarded with an additional 10% discount (20% discount total). We would apply this discount manually - please contact us for details.
Secure more access at a discount.
As always, we'll keep you - our subscribers - informed.
To summarize:
Trading capital (supplementary part of the portfolio; our opinion): Full speculative short positions (250% of the full position) in mining stocks (but not in gold nor silver) are justified from the risk to reward point of view with the following binding exit profit-take price levels:
Senior mining stocks (price levels for the GDX ETF): binding profit-take exit price: $10.32; stop-loss: none (the volatility is too big to justify a SL order in case of this particular trade); binding profit-take level for the DUST ETF: $11.47; stop-loss for the DUST ETF: none (the volatility is too big to justify a SL order in case of this particular trade)
Junior mining stocks (price levels for the GDXJ ETF): binding profit-take exit price: $9.57; stop-loss: none (the volatility is too big to justify a SL order in case of this particular trade); binding profit-take level for the JDST ETF: $14.87; stop-loss for the JDST ETF: none (the volatility is too big to justify a SL order in case of this particular trade)
Those who can't or prefer not to take positions against mining stocks, might want to consider speculative short positions in silver with $8.58 as the binding profit-take exit price.
For-your-information targets (our opinion; we continue to think that mining stocks are the preferred way of taking advantage of the upcoming price move, but if for whatever reason one wants / has to use silver or gold for this trade, we are providing the details anyway. In our view, silver has greater potential than gold does):
Silver futures profit-take exit price: $8.58
Gold futures profit-take exit price: $1,312 (the target for gold is least clear; it might drop to even $1,170 or so)
Long-term capital (core part of the portfolio; our opinion): No positions (in other words: cash)
Insurance capital (core part of the portfolio; our opinion): Full position
Whether you already subscribed or not, we encourage you to find out how to make the most of our alerts and read our replies to the most common alert-and-gold-trading-related-questions.
Please note that the in the trading section we describe the situation for the day that the alert is posted. In other words, it we are writing about a speculative position, it means that it is up-to-date on the day it was posted. We are also featuring the initial target prices, so that you can decide whether keeping a position on a given day is something that is in tune with your approach (some moves are too small for medium-term traders and some might appear too big for day-traders).
Plus, you might want to read why our stop-loss orders are usually relatively far from the current price.
Please note that a full position doesn't mean using all of the capital for a given trade. You will find details on our thoughts on gold portfolio structuring in the Key Insights section on our website.
As a reminder - "initial target price" means exactly that - an "initial" one, it's not a price level at which we suggest closing positions. If this becomes the case (like it did in the previous trade) we will refer to these levels as levels of exit orders (exactly as we've done previously). Stop-loss levels, however, are naturally not "initial", but something that, in our opinion, might be entered as an order.
Since it is impossible to synchronize target prices and stop-loss levels for all the ETFs and ETNs with the main markets that we provide these levels for (gold, silver and mining stocks - the GDX ETF), the stop-loss levels and target prices for other ETNs and ETF (among other: UGLD, DGLD, USLV, DSLV, NUGT, DUST, JNUG, JDST) are provided as supplementary, and not as "final". This means that if a stop-loss or a target level is reached for any of the "additional instruments" (DGLD for instance), but not for the "main instrument" (gold in this case), we will view positions in both gold and DGLD as still open and the stop-loss for DGLD would have to be moved lower. On the other hand, if gold moves to a stop-loss level but DGLD doesn't, then we will view both positions (in gold and DGLD) as closed. In other words, since it's not possible to be 100% certain that each related instrument moves to a given level when the underlying instrument does, we can't provide levels that would be binding. The levels that we do provide are our best estimate of the levels that will correspond to the levels in the underlying assets, but it will be the underlying assets that one will need to focus on regarding the signs pointing to closing a given position or keeping it open. We might adjust the levels in the "additional instruments" without adjusting the levels in the "main instruments", which will simply mean that we have improved our estimation of these levels, not that we changed our outlook on the markets. We are already working on a tool that would update these levels on a daily basis for the most popular ETFs, ETNs and individual mining stocks.
Our preferred ways to invest in and to trade gold along with the reasoning can be found in the how to buy gold section. Additionally, our preferred ETFs and ETNs can be found in our Gold & Silver ETF Ranking.
As a reminder, Gold & Silver Trading Alerts are posted before or on each trading day (we usually post them before the opening bell, but we don't promise doing that each day). If there's anything urgent, we will send you an additional small alert before posting the main one.
Thank you.
Sincerely,
Przemyslaw Radomski, CFA
Editor-in-chief, Gold & Silver Fund Manager

