

Briefly: in our opinion, full (300% of the regular position size) speculative short positions in mining stocks are justified from the risk/reward point of view at the moment of publishing this Alert.
Gold Miners
Yesterday’s (Jul. 26) session might have seemed to be something important or game-changing, as miners moved higher. But it wasn’t.
But miners moved higher while gold moved lower! Wasn’t that the opposite of what you described as very bearish?
It was, but the context was different. The magnitude and time frame were different. The miners’ underperformance that I had described took place over the previous weeks, and what happened yesterday was limited to… well, yesterday.
Consequently, miners’ strength seems to have just been a blip on the radar screen – a tiny correction in the moves in prices and ratios that have been taking place for many weeks.
It didn’t change anything from the technical point of view either.
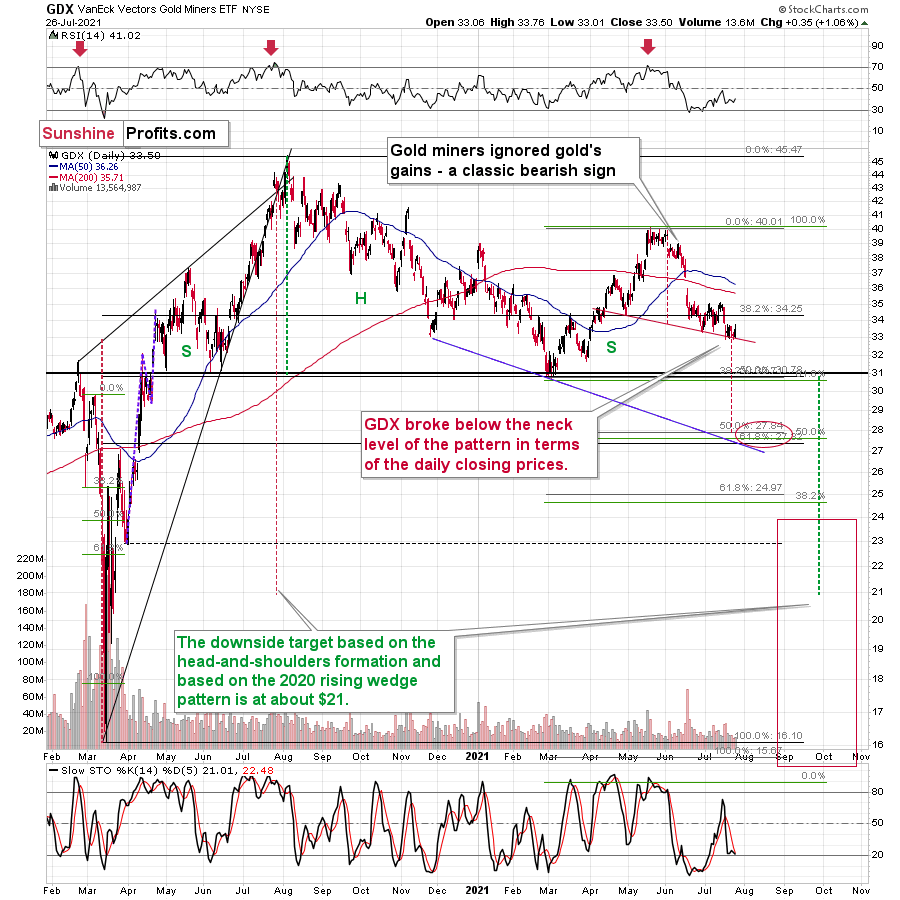
Senior miners even corrected before the end of the day.
And junior gold mining stocks?
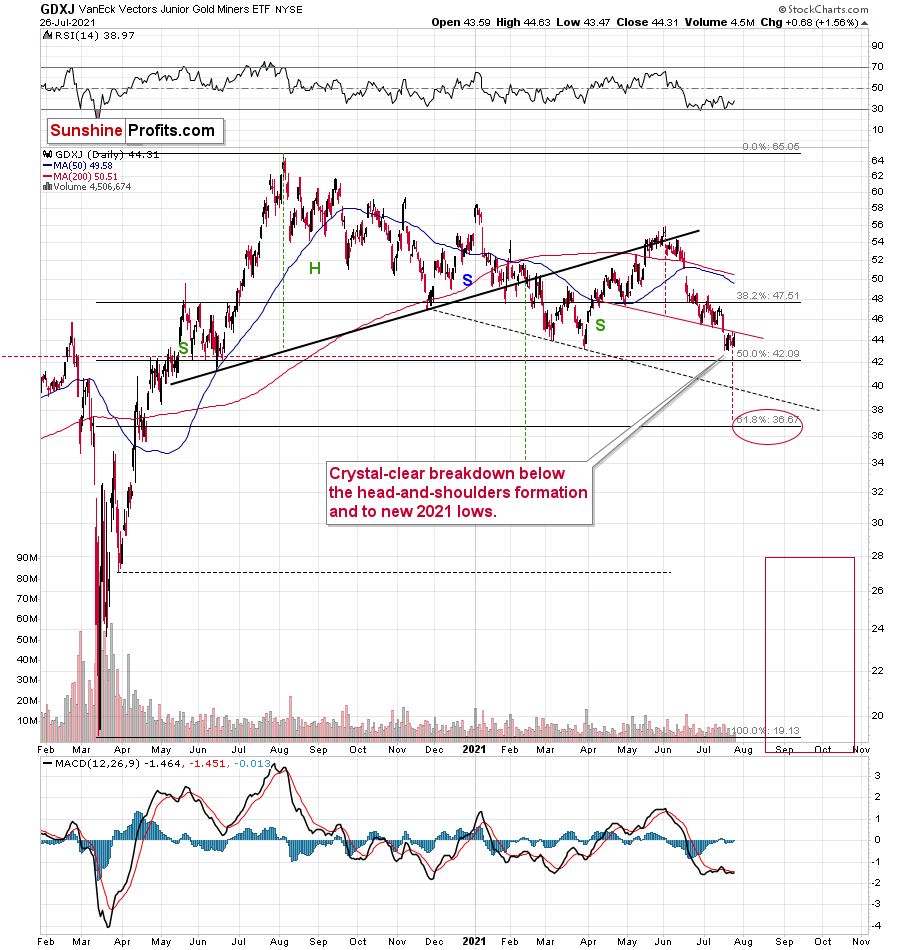
Junior miners (the GDXJ ETF) didn’t invalidate the breakdown below the neck level of the bearish head and shoulders formation. Consequently, the very bearish implications of the breakdown remain intact.
While the last several days were relatively calm in the PMs and in the USD Index, it seems that it’s not only the calm before the storm, but also the final part thereof.
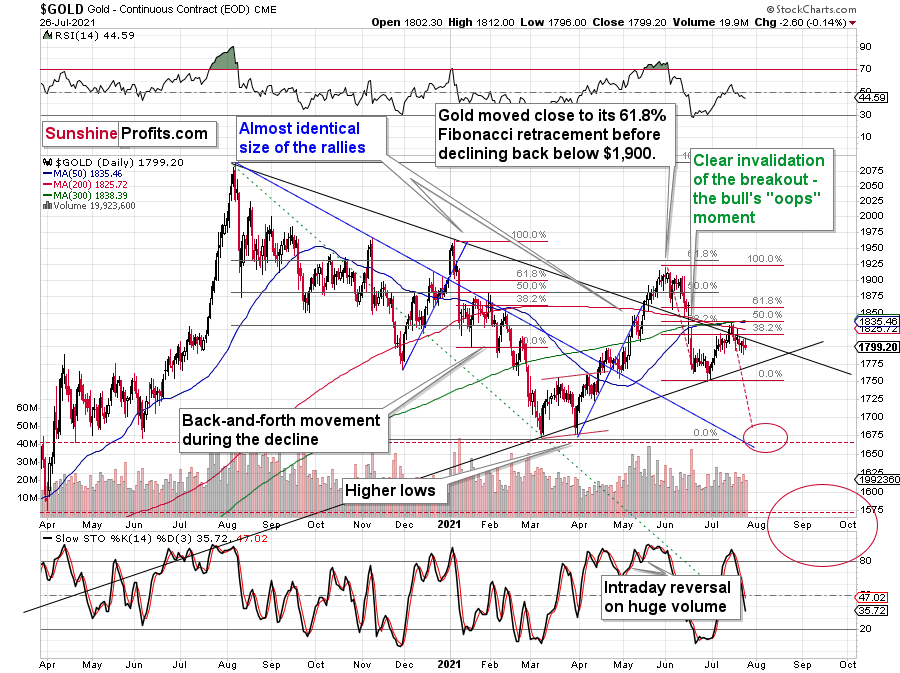
As I wrote earlier, gold didn’t do much yesterday – it moved slightly lower. The same is taking place in today’s pre-market trading – gold is about $2 lower. Basically, nothing changed, and gold is likely to move lower based, i.a., on the self-similarity to what happened in 2012-2013 and 2008 (as I discussed yesterday).
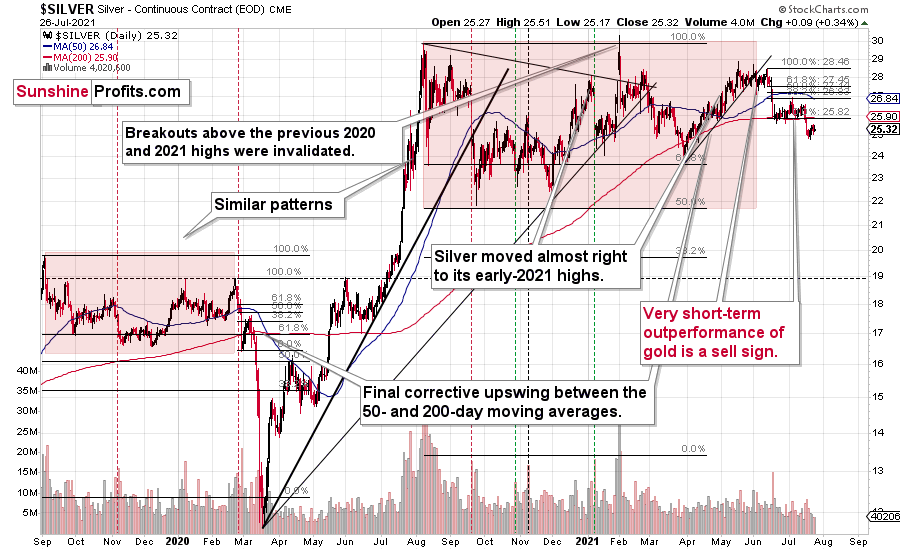
Silver corrected a bit, but it didn’t move back above its mid-June lows, so the breakdown below them was definitely not invalidated. It seems that the next big move in the price of the white metal will be to the downside.
The USD Index
The situation in the USD Index perfectly fits the “final part of the calm before the storm” narrative.
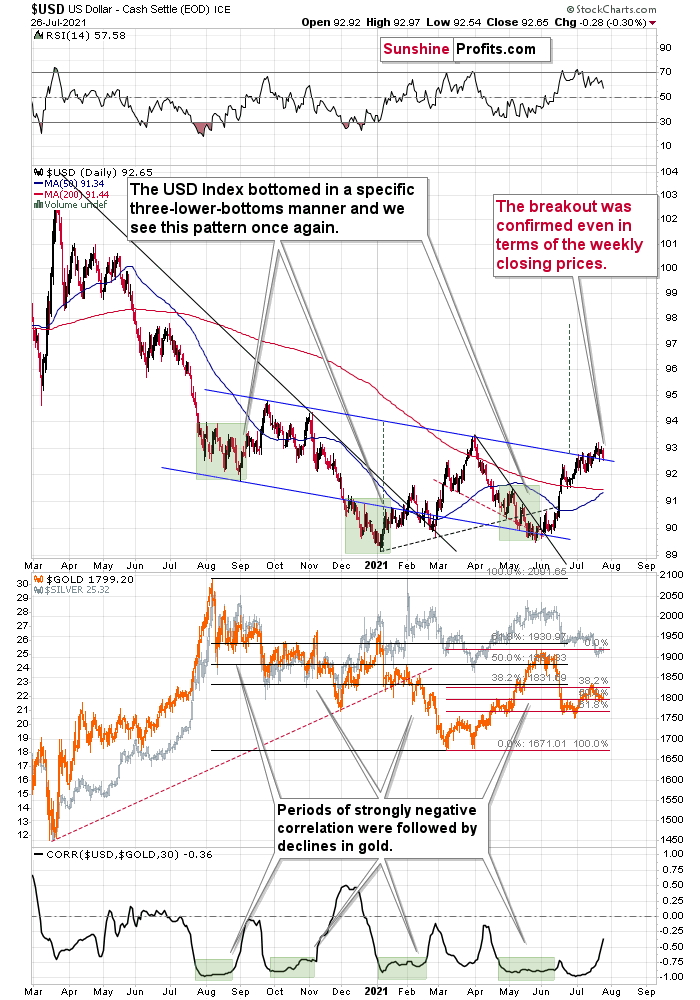
The USDX moved a bit lower yesterday, but this move didn’t take it back below the neck level of the previously broken inverse head-and-shoulders formation. Consequently, the USDX is likely to soar in the following weeks, which is likely to put very negative pressure on the PMs, almost (!) guaranteeing that they will decline in consequence.
Moreover, please note that the correlation between gold and the USD Index (lower part of the above chart) is now moving back toward the 0 level after a long period of being close to -1. This might not seem interesting until one compares it to what happened in gold when that was the case previously. In early September 2020, in mid-November 2020, and in mid-February 2021 we saw the same thing and that heralded short-term declines in gold in all three cases. Thus, the implications are bearish.
Having said that, let’s take a look at the markets from a more fundamental angle.
What Lies Beneath
After the European Central Bank (ECB) pushed all of its dovish chips into the middle, it’s time for the U.S. Federal Reserve (FED) to place its bets. And with the central bank’s two-day policy meeting kicking off on Jul. 27, the FED and the ECB will likely forge different paths in the coming months.
To explain, with the ECB revealing on Jul. 22 that its PEPP purchases will continue at “a significantly higher pace” and that maturing APP purchases will be reinvested for “an extended period of time,” the ECB’s dovish disposition is extremely bearish for the EUR/USD.
And while the ECB’s path has been quite predictable, there is confusion about the FED’s next move. However, it’s important to remember that the two regions are confronting significantly different realities. Case in point: with U.S. GDP growth prospects and realized inflation tracking well ahead of the Eurozone, we’re confident that the FED will reveal its taper timeline by (or before) its September 21/22 policy meeting. Conversely, with Eurozone inflation significantly lagging the U.S. – with inflation rising by 1.90% year-over-year (YoY) in June versus 5.32% YoY in the U.S. – the ECB has more wiggle room to remain dovish for longer. For context, both the FED and the ECB have inflation targets of roughly 2%.
Regarding bond yields, the FED’s hawkish divergence should put upward pressure on short-term interest rates. In turn, it should increase the spread between the front-end of the U.S. and Eurozone yield curves. As for the back-end, long-term interest rates are behaving as if the Delta variant and/or the FED’s forthcoming taper will depress the U.S. economy. And eager to front-run the potential outcome, bond investors have positioned for slower growth, lower inflation, and, eventually, a reenactment of the FED cutting interest rates.
However, because relative performance is what really matters (as it relates to the EUR/USD, the USD Index and their likely impact on the PMs), the spread between the long-end of the U.S. and Eurozone yield curves should also widen in the coming months.
Please see below:
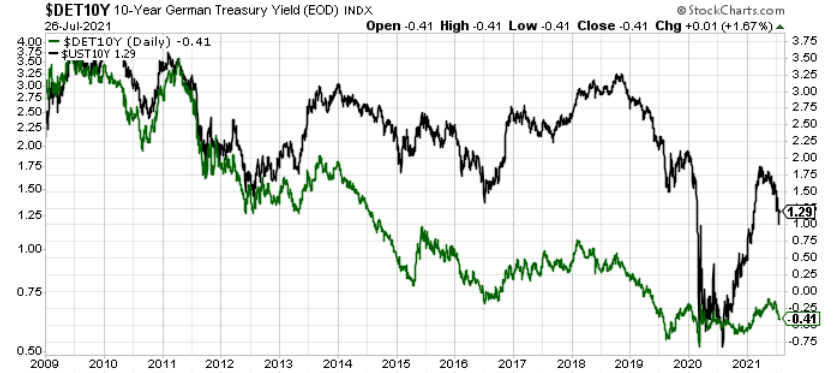
To explain, the green line above tracks the German 10-Year Bund yield, while the black line above tracks the U.S. 10-Year Treasury yield. For context, Germany is Europe’s largest economy and its yield serves as a viable proxy for the Eurozone. If you analyze the relationship, you can see that both variables moved in near-lockstep from 2009 until mid-2012. However, with the U.S. economy outperforming the Eurozone ever since, the yield spread has widened profoundly, and the German 10-Year Bund yield eventually went negative.
Thus, with the U.S. economy poised to outperform the Eurozone for the foreseeable future, a widening of the U.S.-German 10-year spread will likely commence in the coming months. Moreover, if the FED announces its taper timeline in September and the ECB remains patient, the eventual decline in the FED/ECB ratio (which compares the relative rise and fall of their respective balance sheets) will result in less funds available to soak up the profound supply of U.S. Treasuries. As a result, while the ECB would continue to suppress long-term interest rates through its asset purchases, U.S. investors would be left to navigate the Treasury market on their own.
Even More Spending Ahead!
Speaking of Treasuries supply, CNBC reported on Jul. 26 that Democrats and Republicans are in a mad dash to pass an infrastructure package before the Senate leaves Washington on Aug. 9 (until Sept. 10, planned).
“We’re about 90% of the way there” said Senator Rob Portman (of Ohio) on Jul. 25. And we’re confident about “getting it done this week,” For context, an agreement will appropriate $579 billion in new funding for transportation, broadband and utilities. On top of that, Democratic lawmakers are also rushing to pass (before Aug. 9) a second bill that provides funding for child care, education and climate change initiatives.
As a result, with the U.S. federal government still in the midst of its COVID-19 shopping spree and inflation already surging, another round of spending is like pouring gasoline on the inflationary fire. For example, billionaire investor Stanley Druckenmiller warned on Jul. 23 that “this is the biggest bubble I've seen in my career" and that out-of-control spending will lead to “dire consequences.”
"What are we going to get out of this?” He asked. “You're going to get a sugar high, higher inflation, then an economic bust.”
Please see below:
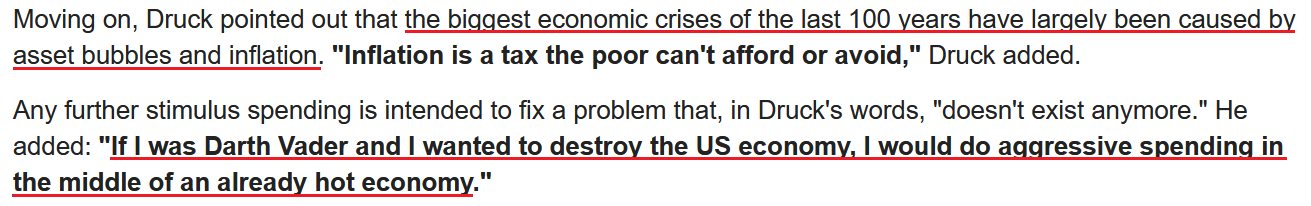 Source: MSNBC/Zero Hedge
And why is he so worried about inflation?
Well, with a litany of earnings calls littered with warnings, Hasbro was the latest to sound the alarm. For context, Hasbro is an American play and entertainment company that manufactures toys, games and also owns media assets. Moreover, on Jul. 26, CFO Deb Thomas said that “freight and input costs are significantly higher this year than last” and that the former is “over four times higher than what we had been experiencing earlier or last year even.”
More importantly, though, how is the company responding to the inflationary pressures?
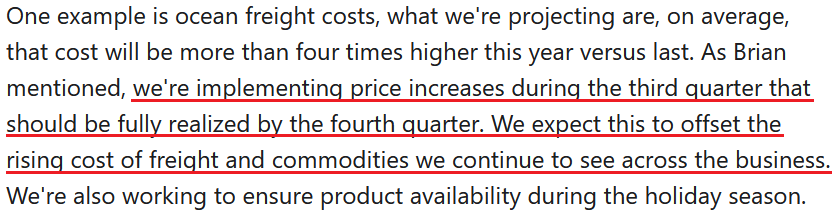 Source: Hasbro/The Motley Fool
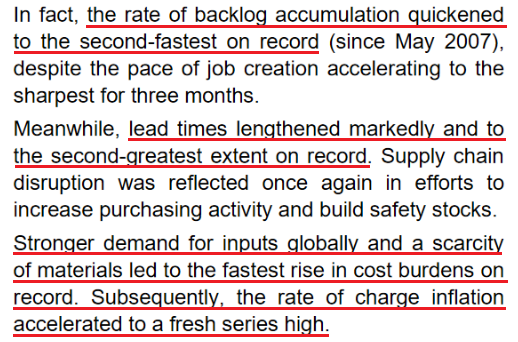
What’s more, IHS Markit released its U.S. Composite PMI on Jul. 23. And while the overall index declined from 63.7 in June to 59.7 in July, the report revealed that the rate of output growth was “among the fastest recorded over the survey’s 14-year history.” Moreover, while services headlined the deceleration – with IHS Markit’s U.S. Services Business Activity Index hitting a five-month low – its U.S. Manufacturing PMI hit a “series record high” in July. An excerpt from the report read:
“Supporting overall growth was a quicker rise in new orders across the manufacturing sector, as new and existing customers ramped up their spending. Firms also saw a stronger uptick in foreign client demand. In turn, the pace of output expansion accelerated to one of the fastest in seven years. Production rose at a slightly quicker pace despite further reports of material shortages.”
And sounding like a broken record…
 Source: IHS Markit
The bottom line? With inflation surging and the FED well ahead of the ECB, the hawkish divergence should suppress the EUR/USD and help uplift the USD Index (the currency pair accounts for nearly 58% of the USD Index’s movement). On top of that, as Druckenmiller pointed out, rampant inflation could force the FED to taper its asset purchases and/or raise interest rates more aggressively than investors expect. In turn, the panic could lead to a significant correction of U.S. equities. And if that scenario comes to fruition, the PMs could be in a world of trouble.
In conclusion, gold closed below $1,800 on Jul. 26, as the threat of a hawkish FED has investors front-running the two-day policy meeting. And while gold often rallies following FED Chairman Jerome Powell’s dovish press conferences, the yellow metal’s medium-term downtrend remains intact. With the stock market extremely euphoric, the FED likely to reveal its taper timeline in September and the U.S. 10-Year Treasury yield already at an all-time low relative to realized inflation, there are plenty of headwinds that could blow the PMs off their lofty perch. As a result, while we remain bullish over the long term, caution is advised over the next few months.
Overview of the Upcoming Part of the Decline
- The corrective upswing in gold might already be over, and another huge decline is likely just around the corner. In fact, it seems to be well underway in the case of mining stocks, especially junior miners.
- After miners slide in a meaningful and volatile way, but silver doesn’t (and it just declines moderately), I plan to switch from short positions in miners to short positions in silver. At this time, it’s too early to say at what price levels this would take place – perhaps with gold close to $1,600. I plan to exit those short positions when gold shows substantial strength relative to the USD Index, while the latter is still rallying. This might take place with gold close to $1,350 - $1,500 and the entire decline (from above $1,900 to about $1,475) would be likely to take place within 6-20 weeks, and I would expect silver to fall the hardest in the final part of the move. This moment (when gold performs very strongly against the rallying USD and miners are strong relative to gold – after gold has already declined substantially) is likely to be the best entry point for long-term investments, in my view. This might also happen with gold close to $1,475, but it’s too early to say with certainty at this time.
- As a confirmation for the above, I will use the (upcoming or perhaps we have already seen it?) top in the general stock market as the starting point for the three-month countdown. The reason is that after the 1929 top, gold miners declined for about three months after the general stock market started to slide. We also saw some confirmations of this theory based on the analogy to 2008. All in all, the precious metals sector would be likely to bottom about three months after the general stock market tops.
- The above is based on the information available today, and it might change in the following days/weeks.
Please note that the above timing details are relatively broad and “for general overview only” – so that you know more or less what I think and how volatile I think the moves are likely to be – on an approximate basis. These time targets are not binding or clear enough for me to think that they should be used for purchasing options, warrants or similar instruments.
Summary
To summarize, it seems that gold has already formed its short-term top and – based i.a. on the completed inverse head-and-shoulders pattern in the USD Index – gold is likely to fall substantially in the following weeks. Gold stocks’ exceptionally weak performance has been indicating that for many weeks, and given juniors’ recent breakdown to new yearly lows, it seems that the storm has already begun.
It seems that our profits on the short position in the junior mining stocks are going to grow substantially in the following weeks.
After the sell-off (that takes gold to about $1,350 - $1,500), I expect the precious metals to rally significantly. The final part of the decline might take as little as 1-5 weeks, so it's important to stay alert to any changes.
Most importantly, please stay healthy and safe. We made a lot of money last March and this March, and it seems that we’re about to make much more on the upcoming decline, but you have to be healthy to enjoy the results.
As always, we'll keep you - our subscribers - informed.
By the way, we’re currently providing you with the possibility to extend your subscription by a year, two years or even three years with a special 20% discount. This discount can be applied right away, without the need to wait for your next renewal – if you choose to secure your premium access and complete the payment upfront. The boring time in the PMs is definitely over, and the time to pay close attention to the market is here. Naturally, it’s your capital, and the choice is up to you, but it seems that it might be a good idea to secure more premium access now while saving 20% at the same time. Our support team will be happy to assist you in the above-described upgrade at preferential terms – if you’d like to proceed, please contact us.
To summarize:
Trading capital (supplementary part of the portfolio; our opinion): Full speculative short positions (300% of the full position) in mining stocks are justified from the risk to reward point of view with the following binding exit profit-take price levels:
Mining stocks (price levels for the GDXJ ETF): binding profit-take exit price: $37.12; stop-loss: none (the volatility is too big to justify a stop-loss order in case of this particular trade)
Alternatively, if one seeks leverage, we’re providing the binding profit-take levels for the JDST (2x leveraged) and GDXD (3x leveraged – which is not suggested for most traders/investors due to the significant leverage). The binding profit-take level for the JDST: $15.96; stop-loss for the JDST: none (the volatility is too big to justify a SL order in case of this particular trade); binding profit-take level for the GDXD: $37.02; stop-loss for the GDXD: none (the volatility is too big to justify a SL order in case of this particular trade).
For-your-information targets (our opinion; we continue to think that mining stocks are the preferred way of taking advantage of the upcoming price move, but if for whatever reason one wants / has to use silver or gold for this trade, we are providing the details anyway.):
Silver futures upside profit-take exit price: unclear at this time - initially, it might be a good idea to exit, when gold moves to $1,683
Gold futures upside profit-take exit price: $1,683
HGD.TO – alternative (Canadian) inverse 2x leveraged gold stocks ETF – the upside profit-take exit price: $12.88
Long-term capital (core part of the portfolio; our opinion): No positions (in other words: cash
Insurance capital (core part of the portfolio; our opinion): Full position
Whether you already subscribed or not, we encourage you to find out how to make the most of our alerts and read our replies to the most common alert-and-gold-trading-related-questions.
Please note that we describe the situation for the day that the alert is posted in the trading section. In other words, if we are writing about a speculative position, it means that it is up-to-date on the day it was posted. We are also featuring the initial target prices to decide whether keeping a position on a given day is in tune with your approach (some moves are too small for medium-term traders, and some might appear too big for day-traders).
Additionally, you might want to read why our stop-loss orders are usually relatively far from the current price.
Please note that a full position doesn't mean using all of the capital for a given trade. You will find details on our thoughts on gold portfolio structuring in the Key Insights section on our website.
As a reminder - "initial target price" means exactly that - an "initial" one. It's not a price level at which we suggest closing positions. If this becomes the case (like it did in the previous trade), we will refer to these levels as levels of exit orders (exactly as we've done previously). Stop-loss levels, however, are naturally not "initial", but something that, in our opinion, might be entered as an order.
Since it is impossible to synchronize target prices and stop-loss levels for all the ETFs and ETNs with the main markets that we provide these levels for (gold, silver and mining stocks - the GDX ETF), the stop-loss levels and target prices for other ETNs and ETF (among other: UGL, GLL, AGQ, ZSL, NUGT, DUST, JNUG, JDST) are provided as supplementary, and not as "final". This means that if a stop-loss or a target level is reached for any of the "additional instruments" (GLL for instance), but not for the "main instrument" (gold in this case), we will view positions in both gold and GLL as still open and the stop-loss for GLL would have to be moved lower. On the other hand, if gold moves to a stop-loss level but GLL doesn't, then we will view both positions (in gold and GLL) as closed. In other words, since it's not possible to be 100% certain that each related instrument moves to a given level when the underlying instrument does, we can't provide levels that would be binding. The levels that we do provide are our best estimate of the levels that will correspond to the levels in the underlying assets, but it will be the underlying assets that one will need to focus on regarding the signs pointing to closing a given position or keeping it open. We might adjust the levels in the "additional instruments" without adjusting the levels in the "main instruments", which will simply mean that we have improved our estimation of these levels, not that we changed our outlook on the markets. We are already working on a tool that would update these levels daily for the most popular ETFs, ETNs and individual mining stocks.
Our preferred ways to invest in and to trade gold along with the reasoning can be found in the how to buy gold section. Furthermore, our preferred ETFs and ETNs can be found in our Gold & Silver ETF Ranking.
As a reminder, Gold & Silver Trading Alerts are posted before or on each trading day (we usually post them before the opening bell, but we don't promise doing that each day). If there's anything urgent, we will send you an additional small alert before posting the main one.
Thank you.
Przemyslaw Radomski, CFA
Founder, Editor-in-chief

