

Briefly: in our opinion, full (250% of the regular position size) speculative short positions in mining stocks are justified from the risk/reward point of view at the moment of publishing this Alert.
Let's start today's analysis with a quote from the special week-end Gold & Silver Trading Alert:
There's also another reason why we might not see much bigger increases in the numbers of infected patients and in the official Covid-19 death toll. It might not be the case that the infections slowed down, but rather that the testing has slowed down. There are huge logistical problems with the Covid-19 tests.
And this is just the tip of the iceberg. Quoting this NY Times article (note: it's from March 27th):
"In three to four weeks, there will be a major shortage of chemical reagents for coronavirus testing, the result of limited production capacity, compounded by the collapse of global supply chains when the epidemic closed down manufacturing in China for weeks."
Here's another article confirming the same thing on the other side of the planet.
The situation with tests' availability is already bad, and it will get worse. Consequently, you might see a decline in the official numbers that are reported with regard to Covid-19 (both: the number of infected people, and the death toll). However, at the same time it might "turn out" that the total death count for a given week in a year is several times greater than the analogous number from the previous years, especially in case of the older people. And this specific multiplier might keep increasing despite the decline in the official numbers.
(...)
Here's the current "official" point of view. Quoting BBC's article:
"
The US now has at least 18,693 deaths and 500,399 confirmed cases, according to Johns Hopkins, which is tracking the disease globally. About half of the deaths were recorded in the New York area.
Italy has reported 18,849 deaths while globally more than 102,000 people have died with the virus.
Researchers had predicted the US death toll would hit its peak on Friday and then gradually start to decline, falling to around 970 people a day by 1 May - the day members of the Trump administration have floated as a possible date to start reopening the economy.
"I want to get it open as soon as possible," Mr Trump said at a Good Friday briefing at the White House. "I would say without question it's the biggest decision I've ever had to make."
However, no action would be taken until the government knew the "country [was] going to be healthy", he said. "We don't want to go back and start doing it over again."
"
The above fits our previous comments. Practically the only possible way in which the US daily Covid-19 death toll falls to about 1000 is due to limited testing. There's no doubt that Trump will keep on repeating that he wants to re-open the US economy to its full capacity as soon as possible - and it's no doubt that he does want that.
Are things even close to being as good in the US as they were in Singapore? Absolutely not. And Singapore just saw the second wave of the virus.
There's almost zero chance that the US economy will be fully re-opened by the end of April, and quite many people appear to believe that it's very likely... Which explains why the rally in the stock market did not end yet.
Now, the situation in the US seems to be stabilizing based on the official new cases and death count. The daily increase in US Covid cases was lowest in April, which seems encouraging. There are two words that need to be said here.
Limited testing.
On this page we can see how many tests have been conducted on each day in the US. The number of tests that were conducted has been declining in the recent days, and it almost reached its April 5 low. The recent peak of testing was reached on April 9 and April 10. That was the only time when we saw new test numbers above 150k for two days in a row. Knowing that, it's not surprising that the peak in new daily cases (so far) was on April 10th, and the previous high was on April 4th, which is when the record number of tests was conducted on a single day.
Why does it matter? Because it indicates that we might not be seeing a decline in the Covid-19 cases, but rather a decline in... testing.
There were 162,789 new tests conducted on April 9, and there were 32.4k new US cases on that day. This means that about 19.9% of those who were tested, were infected.
On April 13, there were only 24.9k new US cases, but only 129,114 tests were conducted. This means that about 19.3% of those who were tested, were infected. This means that there was no meaningful improvement, even though it seems to be so at first sight.
The Covid-19 situation is not getting better. Conversely, the situation with regard to Covid-19 testing might be getting worse.
Does the decline in official Covid19 death count paint a better picture? No, because with the smaller number of tests being conducted, it could easily be the case that the death toll is actually increasing and/or accelerating, but unless people who die, get tested, it's not counted as a Covid-19 death. What will be much more informative, is the total death count per week compared to such weeks in the previous years. If the number of tests declines, then the number of official Covid-19 deaths will have to decline as well, regardless of the situation getting better, or worse.
At this point we would like to reply to one of the questions that we received:
Q: As always, thanks for the huge work you clearly put into your analysis.
Your current thinking is all largely based on the pandemic resulting in 10,000 of deaths per day in the US, and going by your reply to a reader today, that is based on 40% getting the infection.
In this report, courtesy of healthdata.org (well respected I understand), they are suggesting much lower numbers with a peak in cumulative deaths in the US of 60,000 circa early August and their worse case scenario only getting to a max of 5,000 a day, their main scenario suggesting 2,200 a day.
I am guessing the main difference is in social distancing, i.e the 40% must presume weak social distancing to allow the virus spread. However, even if the lower numbers are closer to reality, it still seems apparent that life cannot return to anything like normal until a vaccine is in place or a huge number of people are immune from fighting off the virus, either scenario probably being about a year away and the subsequent devastating economic cost not being properly considered yet by the overly optimistic markets.
So, I am wondering what you think of the following and what impact they would have on your analysis in the PM/miners sectors
-The markets are feeling optimistic as they are hoping case numbers are flattening in some key areas, they not in the mood for any kind of sell off, in fact they are still looking for excuses to buy. Let's say they are half right and the deaths/cases do tail off as long as isolation is continued
-However, economics cannot return to anything like reality for a very long time, and the markets seem to overly optimistic about the possibility of V shaped recoveries etc.
A: Thank you for the message and for the link. In short, if you are correct about both: the death toll implications and the economic implications, it changes absolutely nothing in our predictions for the precious metals market and for the general stock market.
The stock market is likely to crash based on the enormous economic impact of the situation, and, in my opinion, gold is likely to slide in the early part of the next downswing of the stock market - just like it did in 2008. When stocks bottom, I think gold, silver, and miners will already be after a sizable rally.
So, even if the stock market doesn't continue to slide for the following months, but rather bottoms in a month or so, it shouldn't impact my expectations for the PMs and miners.
Furthermore, this means that even if we decide to use the model based on optimistic assumptions (such as the one from healthdata.org), my outlook for the PM market will remain intact as long as stocks don't bottom much sooner (within a week or so). And it's extremely unlikely in my view that the bottom in stocks is only a week away.
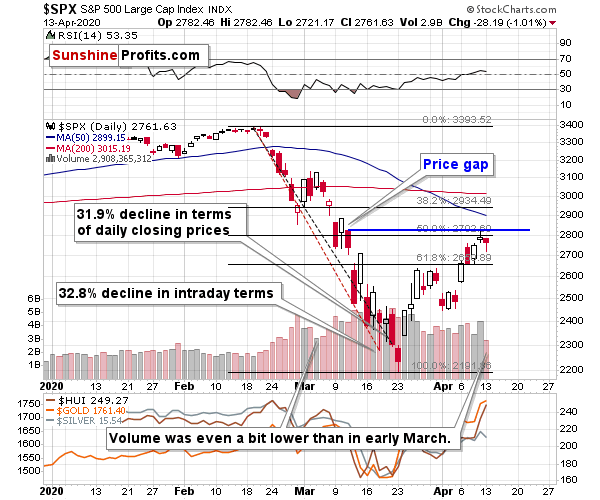
Stocks didn't decline after opening with a price gap yesterday, which means that the "evening star" formation wasn't completed. However, this doesn't mean that the situation is now bullish. Conversely, what we see now resembles the previous biggest correction during this downswing - the one that we saw in early March. It started with a relatively low volume and during the daily downswing. That's also what we saw yesterday.
Of course, the above is not the key detail factor behind the upcoming decline - fear in general and closing down a large part of the world for many weeks, along with broken supply chains, is the key detail. The above simply provides a timing indication.
Speaking of early March... The USD Index just did something that it also did back then.
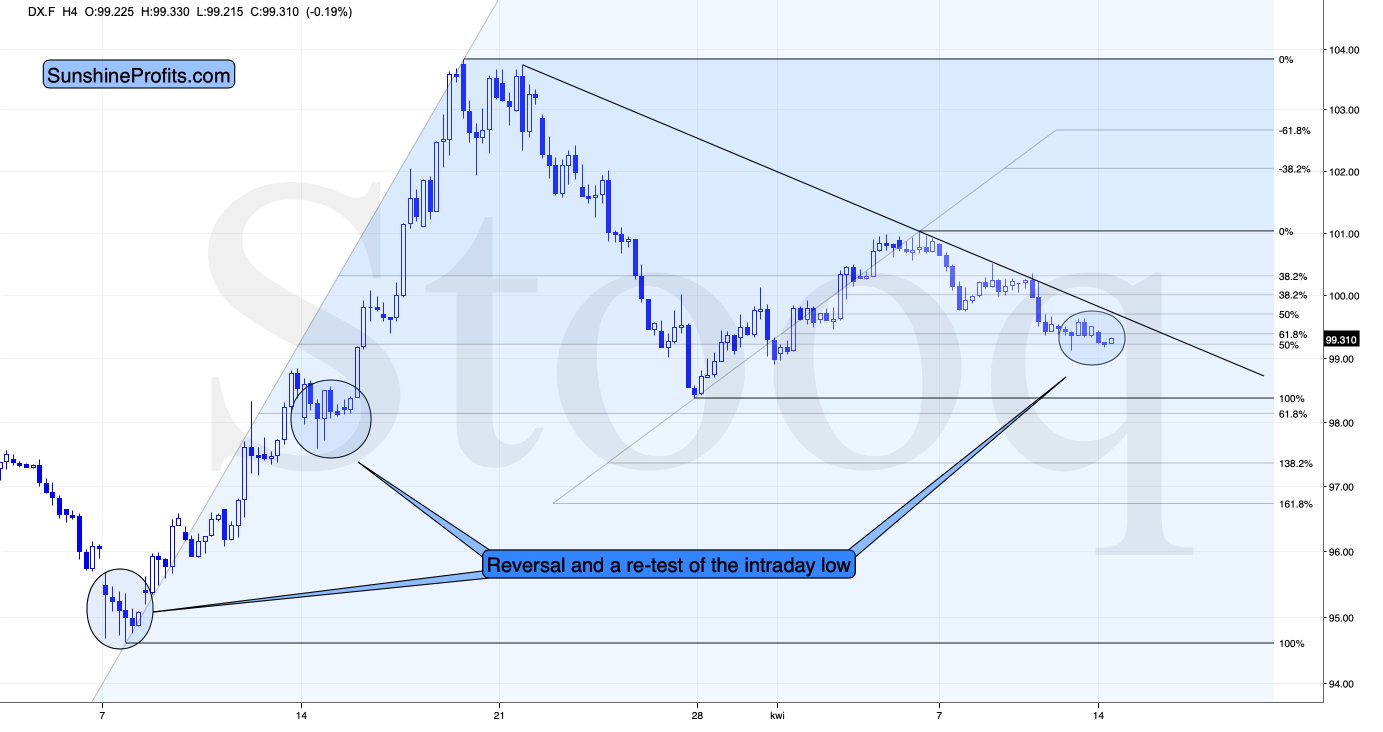
Looking at the 4-hour candlestick chart, we see that the USD Index just formed a reversal and is now testing the previous lows. There were very few 4-hour reversals in the recent days, but when we saw them, big and fast rallies followed. The early-March bottom is particularly similar to the current situation as the USD Index is - just like back then - after a visible decline, and the 4h reversal was followed by a re-test of the intraday low.
The similarities in the USD Index and in the general stock market suggest that the situation is now similar to what we saw in early March. But is the situation similar to early March also in case of gold, silver, and mining stocks?
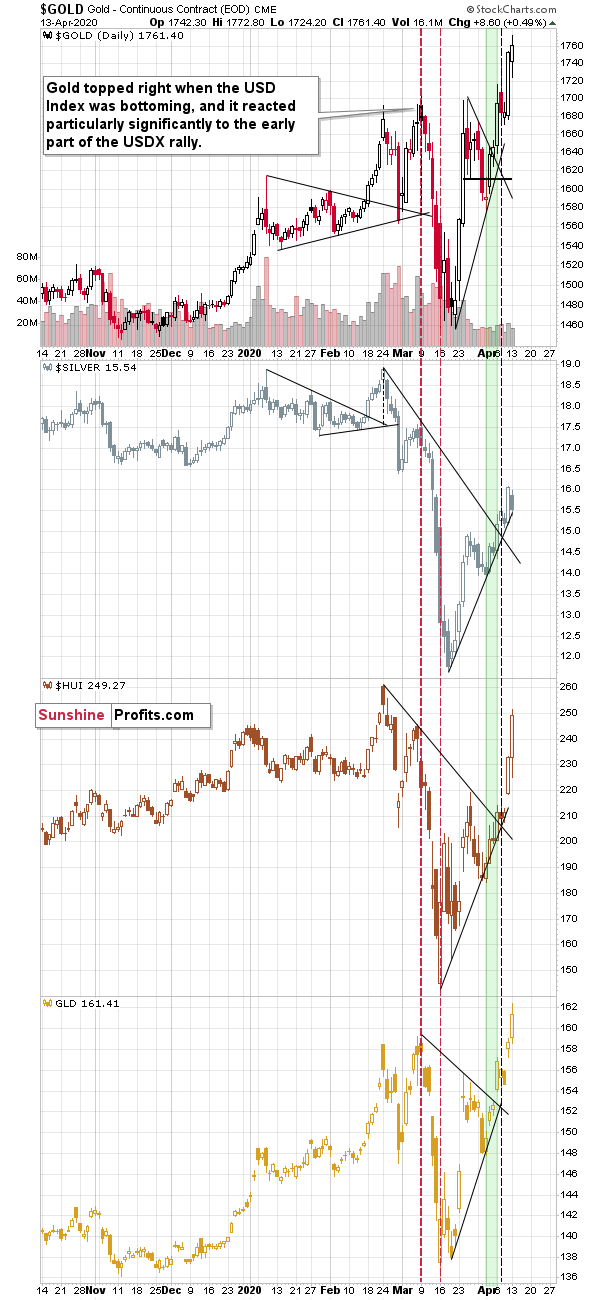
Gold is about $60 higher, silver is about $1.50 lower, and the HUI Index (proxy for gold stocks) is more or less at the same price levels.
There are some differences with regard to individual price levels, but overall they do seem similar. Gold, silver, and miners are after a short-term rally just as they were in early March. Back then, it took just 5 days for the HUI Index to slide by almost 100 index points...
Back then, the precious metals market declined along with the stock market and along with higher USD Index values... And it seems that both factors will come into play once again shortly.
Please focus one more time on the previous USD Index chart. There is a clear declining resistance line that's currently at about 99.7, which is just 0.4 above the current USDX value. Back in early March, when the USD Index broke above an analogous declining resistance line, the biggest part of gold's decline followed. Given the proximity of this resistance line, such a breakout could take place any hour now.
One might be wondering what would need to happen for the USDX to soar and PMs to slide. It doesn't have to be anything major, as the market moves appear to have already ran their courses and something that's just moderately bullish for the USDX or bearish for stocks could be enough to trigger the price moves. Please note that the US stock market didn't even manage to rally 1.5% after another $2T+ stimulus was announced.
Summary
Summing up, the outlook for the precious metals market remains bearish for the next few weeks, despite the upswing that we saw recently. The outlook might become bullish, if the strength in the PMs and miners persists and they prove to be able to rally despite falling stock prices and rallying USD Index, but it's much too early to say that this is already the case. Conversely, it seems that another move lower in the S&P 500 and another move higher in the USD Index are just around the corner, which would be likely to trigger a sell-off in the precious metals sector.
After the sell-off, we expect the precious metals to rally significantly. The decline might take as little as 1-3 weeks, so it's important to stay alert to any changes.
As always, we'll keep you - our subscribers - informed.
To summarize:
Trading capital (supplementary part of the portfolio; our opinion): Full speculative short positions (250% of the full position) in mining stocks is justified from the risk to reward point of view with the following binding exit profit-take price levels:
Senior mining stocks (price levels for the GDX ETF): binding profit-take exit price: $10.32; stop-loss: none (the volatility is too big to justify a SL order in case of this particular trade); binding profit-take level for the DUST ETF: $11.47; stop-loss for the DUST ETF: none (the volatility is too big to justify a SL order in case of this particular trade)
Junior mining stocks (price levels for the GDXJ ETF): binding profit-take exit price: $9.57; stop-loss: none (the volatility is too big to justify a SL order in case of this particular trade); binding profit-take level for the JDST ETF: $14.87; stop-loss for the JDST ETF: none (the volatility is too big to justify a SL order in case of this particular trade)
For-your-information targets (our opinion; we continue to think that mining stocks are the preferred way of taking advantage of the upcoming price move, but if for whatever reason one wants / has to use silver or gold for this trade, we are providing the details anyway. In our view, silver has greater potential than gold does):
Silver futures downside profit-take exit price: $8.58
Gold futures downside profit-take exit price: $1,312 (the target for gold is least clear; it might drop to even $1,170 or so)
Long-term capital (core part of the portfolio; our opinion): No positions (in other words: cash)
Insurance capital (core part of the portfolio; our opinion): Full position
Whether you already subscribed or not, we encourage you to find out how to make the most of our alerts and read our replies to the most common alert-and-gold-trading-related-questions.
Please note that the in the trading section we describe the situation for the day that the alert is posted. In other words, it we are writing about a speculative position, it means that it is up-to-date on the day it was posted. We are also featuring the initial target prices, so that you can decide whether keeping a position on a given day is something that is in tune with your approach (some moves are too small for medium-term traders and some might appear too big for day-traders).
Plus, you might want to read why our stop-loss orders are usually relatively far from the current price.
Please note that a full position doesn't mean using all of the capital for a given trade. You will find details on our thoughts on gold portfolio structuring in the Key Insights section on our website.
As a reminder - "initial target price" means exactly that - an "initial" one, it's not a price level at which we suggest closing positions. If this becomes the case (like it did in the previous trade) we will refer to these levels as levels of exit orders (exactly as we've done previously). Stop-loss levels, however, are naturally not "initial", but something that, in our opinion, might be entered as an order.
Since it is impossible to synchronize target prices and stop-loss levels for all the ETFs and ETNs with the main markets that we provide these levels for (gold, silver and mining stocks - the GDX ETF), the stop-loss levels and target prices for other ETNs and ETF (among other: UGLD, DGLD, USLV, DSLV, NUGT, DUST, JNUG, JDST) are provided as supplementary, and not as "final". This means that if a stop-loss or a target level is reached for any of the "additional instruments" (DGLD for instance), but not for the "main instrument" (gold in this case), we will view positions in both gold and DGLD as still open and the stop-loss for DGLD would have to be moved lower. On the other hand, if gold moves to a stop-loss level but DGLD doesn't, then we will view both positions (in gold and DGLD) as closed. In other words, since it's not possible to be 100% certain that each related instrument moves to a given level when the underlying instrument does, we can't provide levels that would be binding. The levels that we do provide are our best estimate of the levels that will correspond to the levels in the underlying assets, but it will be the underlying assets that one will need to focus on regarding the signs pointing to closing a given position or keeping it open. We might adjust the levels in the "additional instruments" without adjusting the levels in the "main instruments", which will simply mean that we have improved our estimation of these levels, not that we changed our outlook on the markets. We are already working on a tool that would update these levels on a daily basis for the most popular ETFs, ETNs and individual mining stocks.
Our preferred ways to invest in and to trade gold along with the reasoning can be found in the how to buy gold section. Additionally, our preferred ETFs and ETNs can be found in our Gold & Silver ETF Ranking.
As a reminder, Gold & Silver Trading Alerts are posted before or on each trading day (we usually post them before the opening bell, but we don't promise doing that each day). If there's anything urgent, we will send you an additional small alert before posting the main one.
Thank you.
Sincerely,
Przemyslaw Radomski, CFA
Editor-in-chief, Gold & Silver Fund Manager

